 I’m going to continue discussing the ranking and selection of issues for trading. I cannot possibly go into great deal on each of the ranking measures I have used over the years, but future articles will discuss some of the more important ones.
Mandatory Measures
Once you have your collection of ranking measures, you need to determine which are to be used along with the rules and guidelines (future article) as mandatory ranking measures. This means that you predefine the value range that they must be in before you can purchase that ETF. This is necessary to keep the subjectivity out of the process. I usually kept about 4-6 as the ones that must be met before an issue could be bought. As a reminder, I only buy ETFs, but this could apply to any type of investment issue.
Tie-Breaker Measures
Once you have determined your mandatory ranking measures, the remaining ranking measures are considered tie-breaker ranking measures. These are used to help in the selection process, especially when there are hundreds of issues that qualify based upon the mandatory measures. You can further reduce these into categories if desired, such as front-line tie-breakers, those that you use more than others.
Ranking Measures Worksheet
Table A and B show a partial view of my ranking measures worksheet. Once again, I had to split one table into two so it could be used in this article. If I had the space Table B would just be a continuation horizontally (additional columns) of Table A. It only shows the top few issues as an example since there are thousands of ETFs in the full listing. One really important concept to grasp when looking at technical values in a spreadsheet; is that you are only seeing a snapshot in time. Here is an example, let’s say that the Trend value is of primary importance and you have two ETFs, one with a Trend of 60 and one with a trend of 70, which would you choose? Well, the quick answer is probably 70 as that is a stronger trend measure than 60. However, don’t you also need to know which direction the trend indicator is heading? If the trend that was at 60 was in an uptrend, while the one with the trend measure at 70 was in a downtrend, a completely different picture is presented. This is why all of my mandatory ranking measures also show (removed for space) their individual 5-day rate of change, so that you can glean from the spreadsheet not only the absolute value of the ranking measure, but also the direction it is headed. It should be noted that any short-term period for rate of change will work.
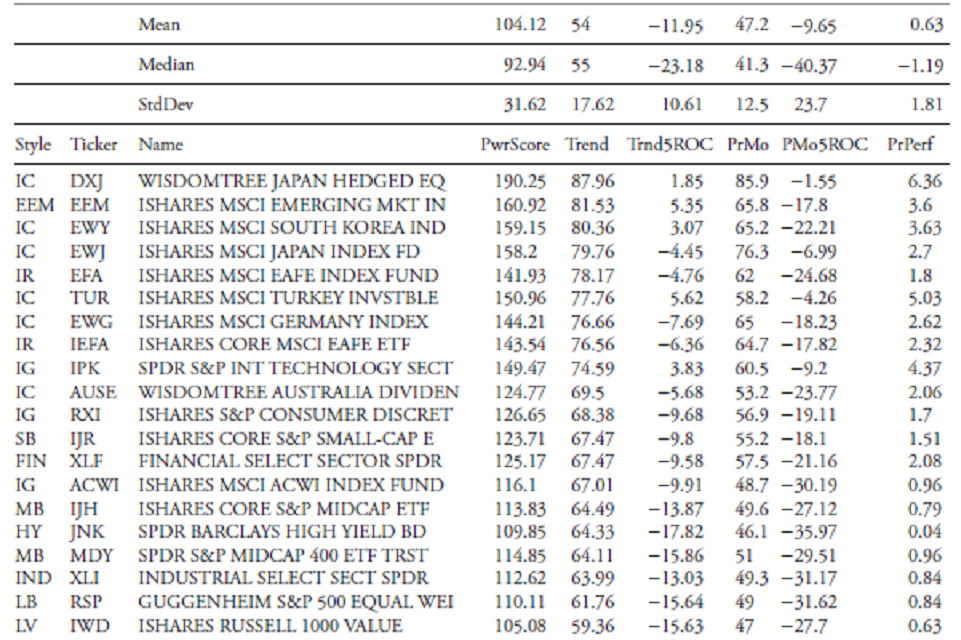 Table A
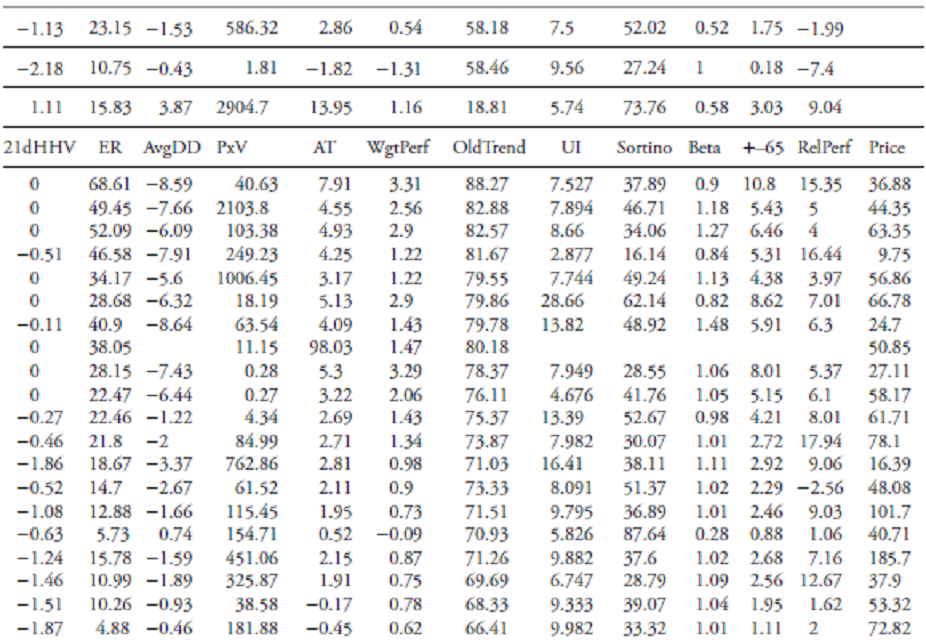 Table B (goes to the right of Table A)
Ranking Measures are all About Momentum
Throughout this series of articles it should be obvious that the ranking and selection process is centered around the concept known as momentum. Simply said, I want to buy an ETF that exhibits an upward trend which is determined by a number of different technical measures.
A final thought on momentum is that every day, in almost every newspaper’s business section there is an excellent list of stocks to buy. It is called the 52-week new high list, or often ‘stocks making new highs.’ If you were to only use this readily available tool, along with a simple stop-loss strategy, you would probably do much better at investing in the market. Sadly, many investors think about buying stocks like they think about buying soap at Wal-Mart, they look for bargains. While this is a valid method also known as value investing, it is very difficult to put into action and seems better in theory than practice. When you buy a stock, you buy it simply because you think you can sell it later at a higher price, I think momentum will work much better in that regard.
Dance with the Trend,
Greg Morris