DecisionPoint April 29, 2014 at 10:02 PM

I hadn't run my favorite PMO Rising scan in about a week so I decided to see if any charts showed up that were worthy of adding to my PMO Watch List... Read More
DecisionPoint April 28, 2014 at 10:43 PM
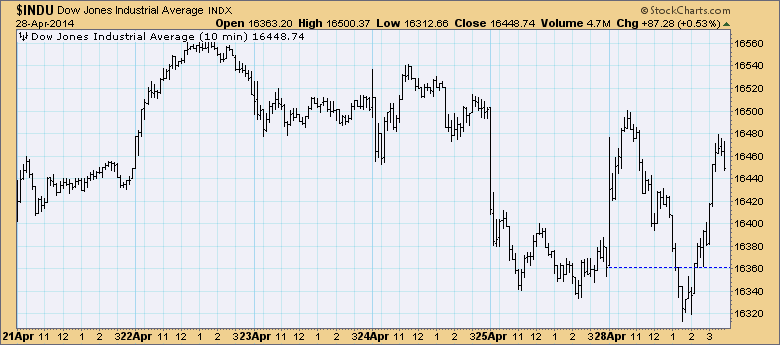
The market had a volatile day, swinging up, dipping low and then recovering to close up. Expectation on a rally would be short-term indicators switching direction and maybe even making climactic moves. Looking at the daily bar chart, price still looks like it is topping out... Read More
DecisionPoint April 25, 2014 at 01:09 AM
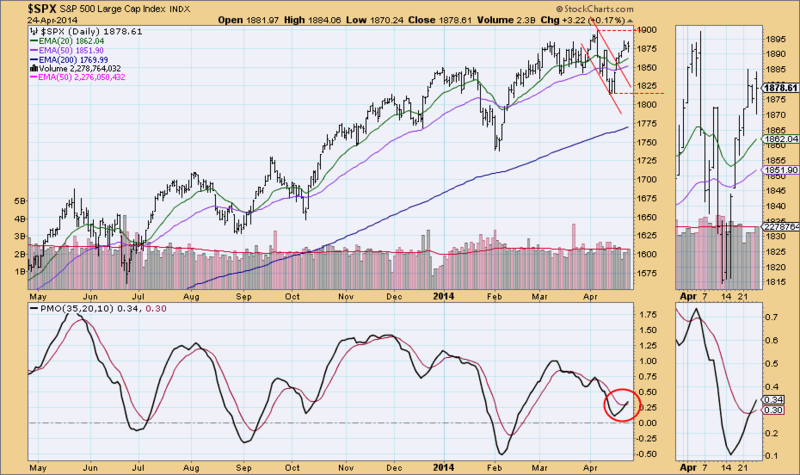
After breaking out from a short-term declining trend channel, the market seems to be losing steam. But, is it? The PMO has just had a positive crossover its 10-EMA triggering a PMO Buy signal. We may be looking at a fake-out PMO Buy signal like we saw in early April... Read More
DecisionPoint April 23, 2014 at 03:51 AM

One of the features that I used frequently on the DecisionPoint.com website was Gallery View in the ChartTool. I was happy to learn that you can not only use Gallery View on Stockcharts.com to get an in depth view on a stock, ETF, etc., but you can customize it... Read More
DecisionPoint April 15, 2014 at 06:55 AM

With the release of several DecisionPoint ChartPacks (to learn more about them and how to install them click here), many users have expressed that they are overwhelmed by the quantity of quality indicator charts... Read More
DecisionPoint April 12, 2014 at 09:43 PM
I wanted to take a moment and update everyone - especially existing DecisionPoint members - on the status of the StockCharts/DecisionPoint merger. I'll also try to address some of the more common questions we've had since the merger was announced back in February... Read More
DecisionPoint April 11, 2014 at 04:03 PM
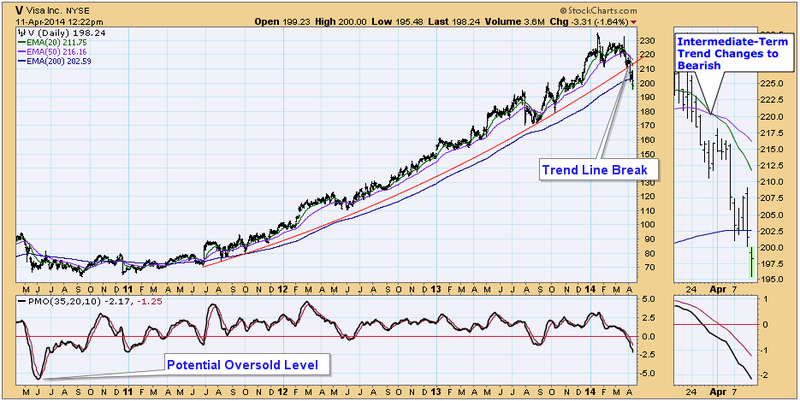
After a quick review of the charts of Dow 30 Industrial stocks, the worst looking chart, in my opinion, is that of Visa (V). The first and most obvious problem is that price has broken down through a shallow parabolic line that defines the upward trend... Read More
DecisionPoint April 10, 2014 at 08:14 PM
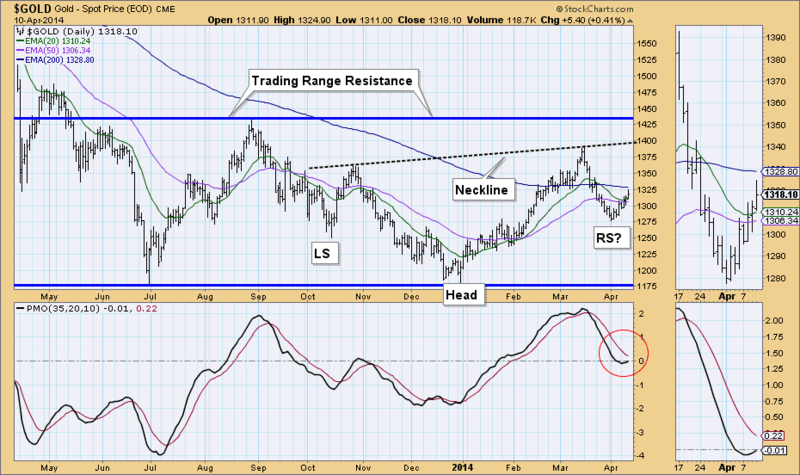
I pointed out a bullish Reverse Head and Shoulders possibly forming last week on Gold. It's still in play in my opinion, but the longer-term horizontal trading range, being a pattern that has been around longer, holds a bit more weight on what gold's next move will be... Read More
DecisionPoint April 08, 2014 at 04:16 AM

Today, I decided to pull from my archives of blogs written for Decision Point. In my opinion, this blog article states the simplicity of Decision Point Analysis. I have retooled it to include more up to date charts, as it was originally written in February of 2012... Read More
DecisionPoint April 03, 2014 at 09:49 PM
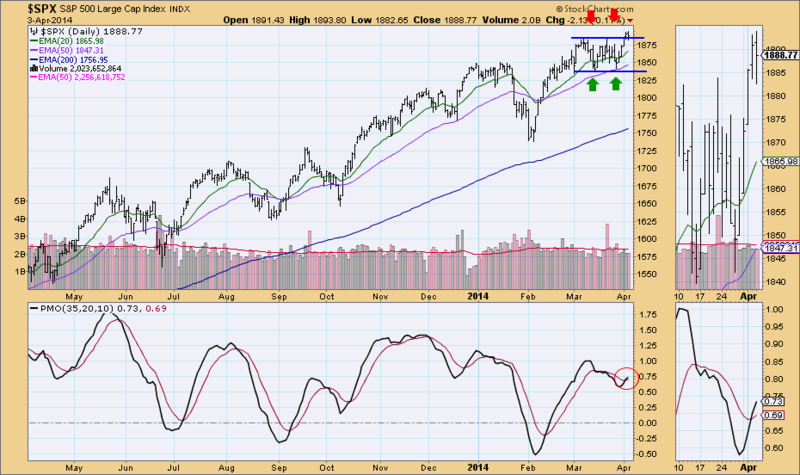
On Monday I wrote a blog "Double-Top to Double-Bottom?". I thought a review and update would be a great follow-up today, especially given the story the charts are telling... Read More
DecisionPoint March 31, 2014 at 09:16 PM
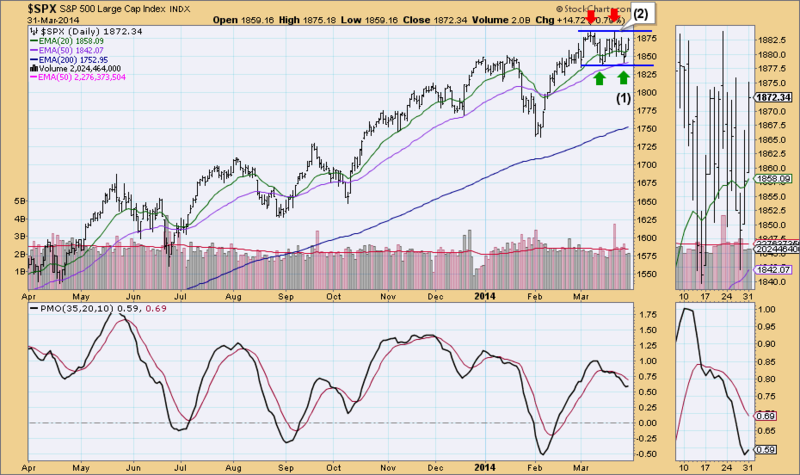
Ah, the bull market that wouldn't die. The DP Chart Gallery revealed some interesting charts today, starting with the SP500 Daily Chart. What appeared to be a bearish double-top formation is now looking like a bullish double-bottom... Read More