DecisionPoint March 31, 2016 at 10:53 AM
Welcome to Part II of Thrust/Trend Model (T/TM) education. In Part I, I discussed how the Intermediate-Term Trend Model (ITTM) and Long-Term Trend Model (LTTM) generate BUY/SELL and Neutral signals. The ITTM and LTTM make up the "Trend component" of the Thrust/Trend Model... Read More
DecisionPoint March 27, 2016 at 12:05 PM
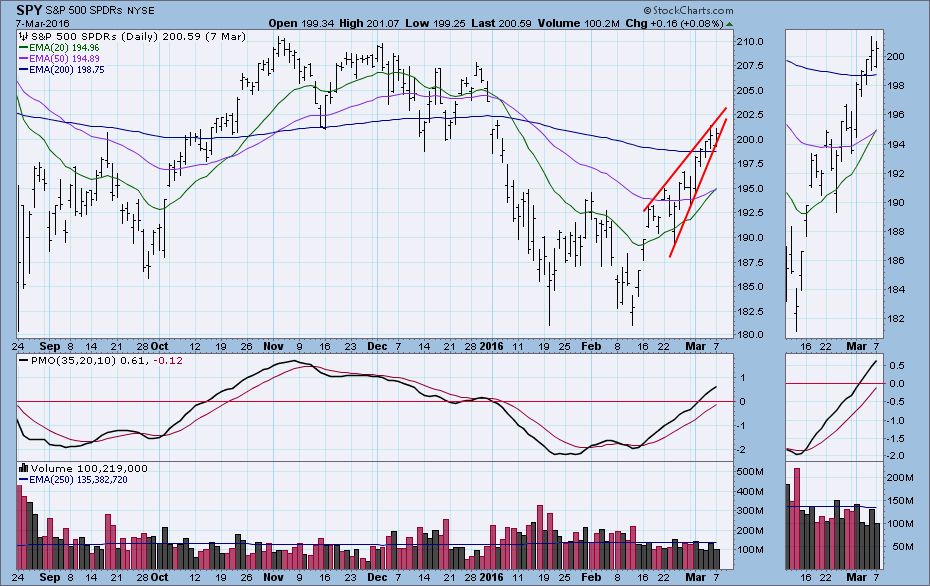
On Thursday SPY broke below a short-term rising trend line. This might not have been too big a deal, but there is other evidence that something more negative is developing... Read More
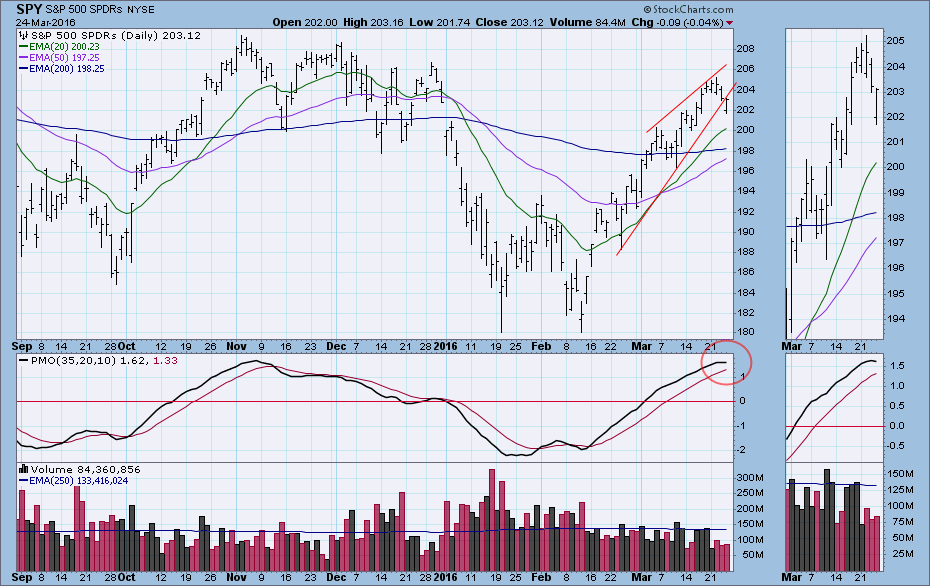
DecisionPoint March 24, 2016 at 10:48 AM
I'm going to give you jump on a ChartSchool article in the making on the DecisionPoint Thrust/Trend Model. Although Carl and I retired it from the DecisionPoint Market/Sector Summary, it is still available in the DecisionPoint Market Indicator ChartPack (free download!)... Read More
DecisionPoint March 19, 2016 at 11:34 PM
While watching the fourth season of House of Cards I have been reminded of the 50-50-90 rule: Anytime you have a 50-50 chance of getting something right, there's a 90% probability you'll get it wrong... Read More
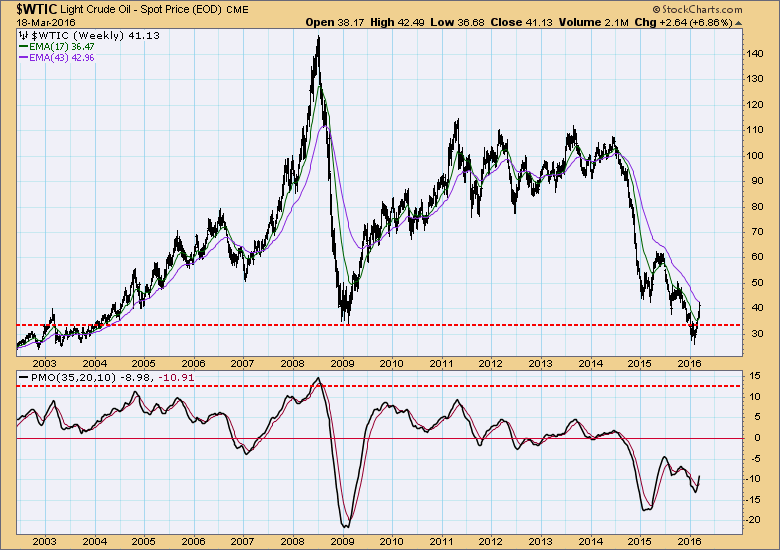
DecisionPoint March 17, 2016 at 07:13 PM

With the market overbought and ready for at least a pullback, I decided to run one of my bear market Price Momentum Oscillator (PMO) scans to see if I could find a few "dogs" out there. The scan produced a handful for review but the two below stood out to me... Read More
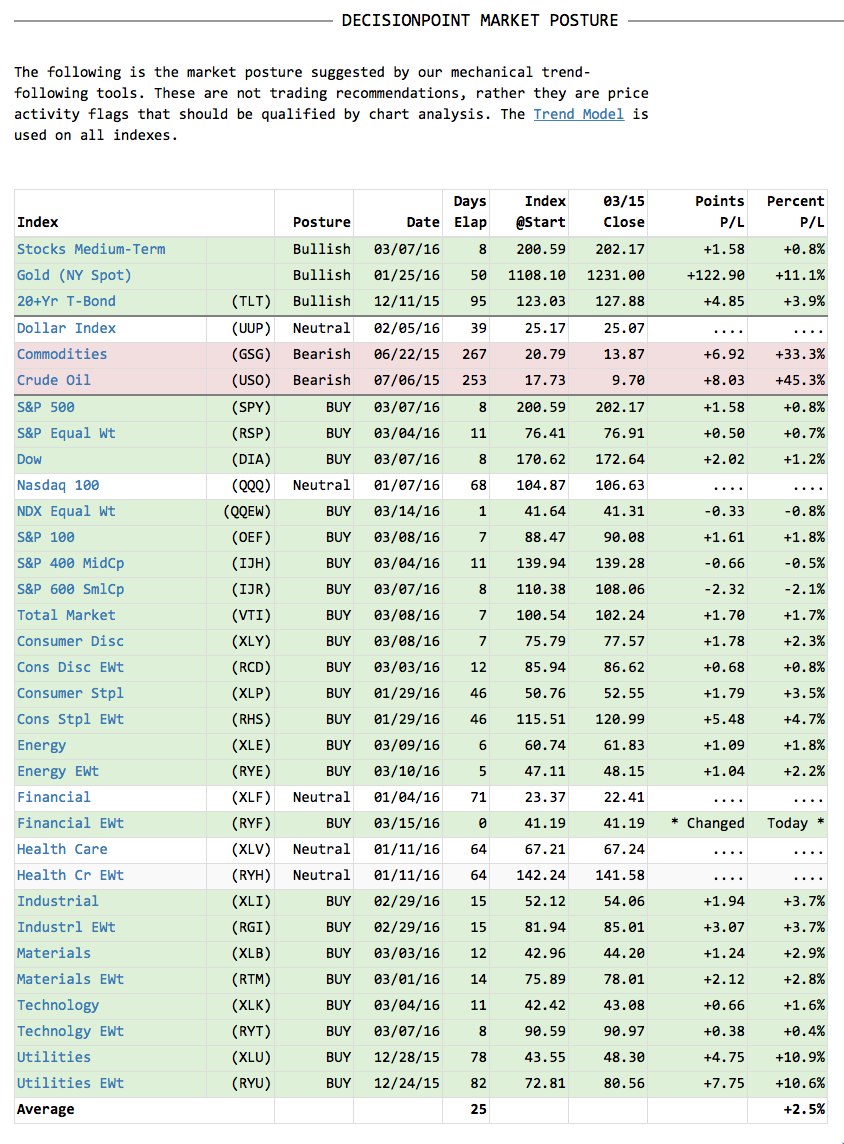
DecisionPoint March 15, 2016 at 06:58 PM
A reader and viewer emailed me and asked me to take a look at Deutsche Bank (DB). While I normally don't do specific chart reviews as part of my blogs or webinars, today we received a new Intermediate-Term Trend Model (ITTM) BUY signal on the equal-weight Financial ETF (RYU)... Read More
DecisionPoint March 12, 2016 at 11:40 PM
One of my favorite chart patterns is the wedge -- rising or falling -- because it can usually be depended upon to resolve opposite the direction the wedge is moving. Specifically, a rising wedge will usually resolve downward and vice versa... Read More
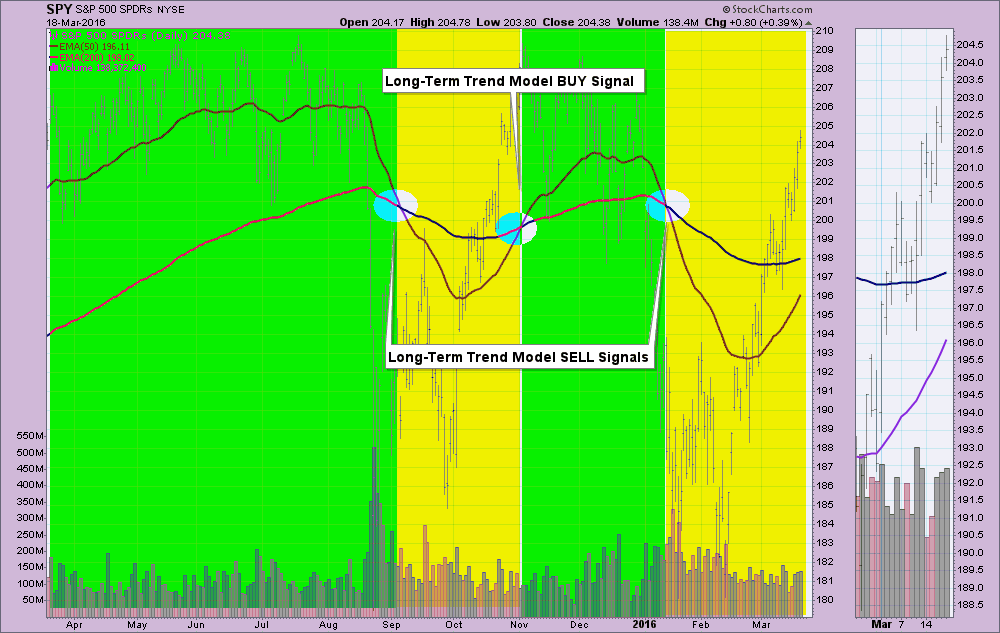
DecisionPoint March 11, 2016 at 08:48 PM

Short-term and Intermediate-Term Trend Model BUY signals began appearing on the DecisionPoint Scoreboards this week. I suggested in a previous ChartWatchers article that these signals would be the first indication that the bear market may be coming to a close... Read More
DecisionPoint March 08, 2016 at 07:32 PM
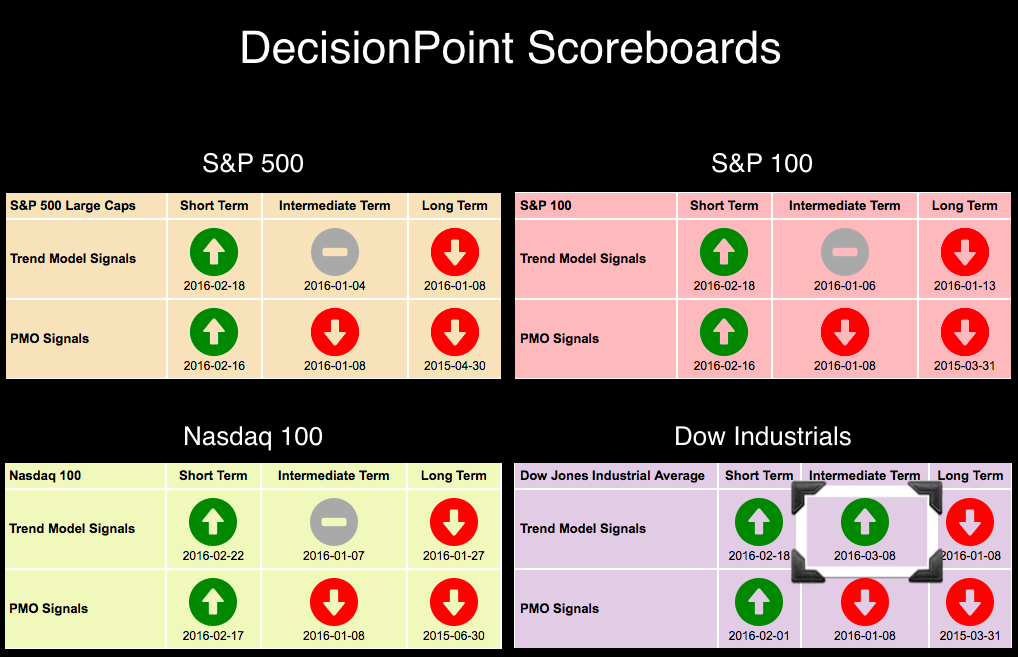
The DecisionPoint Scoreboards had a big change today, probably the first of a few more. The new Intermediate-Term Trend Model BUY signal for the Dow Industrials isn't necessarily a buying opportunity... Read More
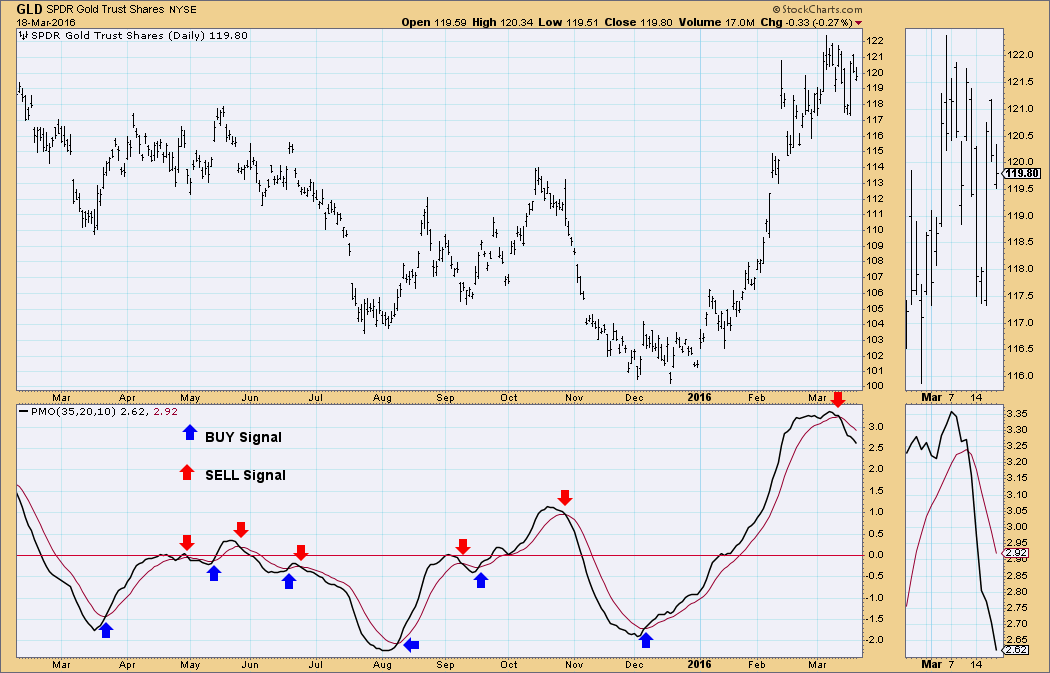
DecisionPoint March 06, 2016 at 12:16 PM
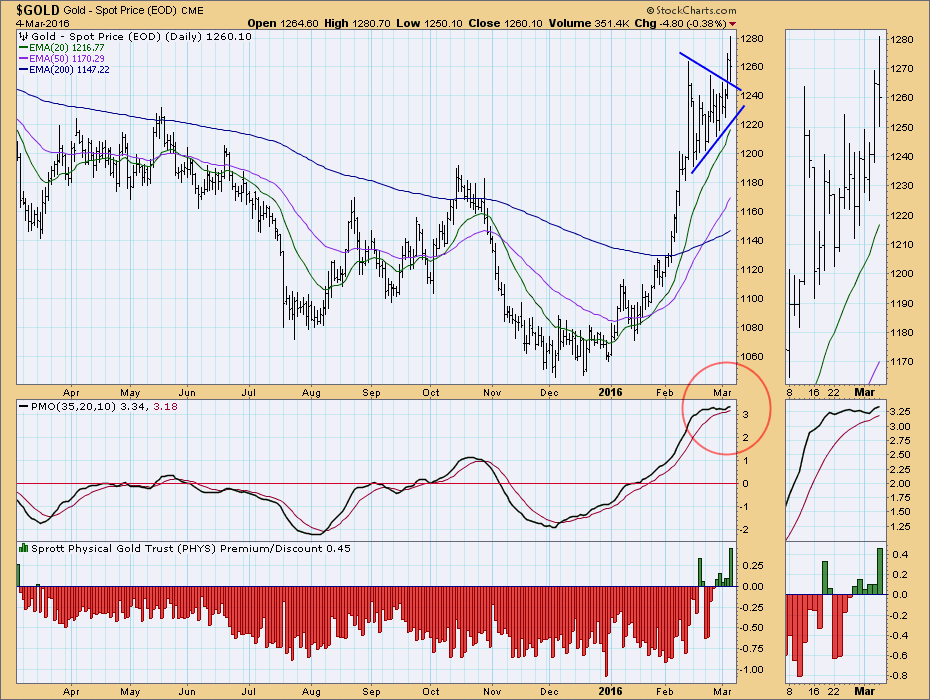
Last week I expressed my reluctance about writing an article about gold two weeks in a row; yet, here I am with article number three. I couldn't help it because I'm seeing a chart pattern that makes me think that gold will be experiencing a correction very soon... Read More
DecisionPoint March 03, 2016 at 08:08 PM
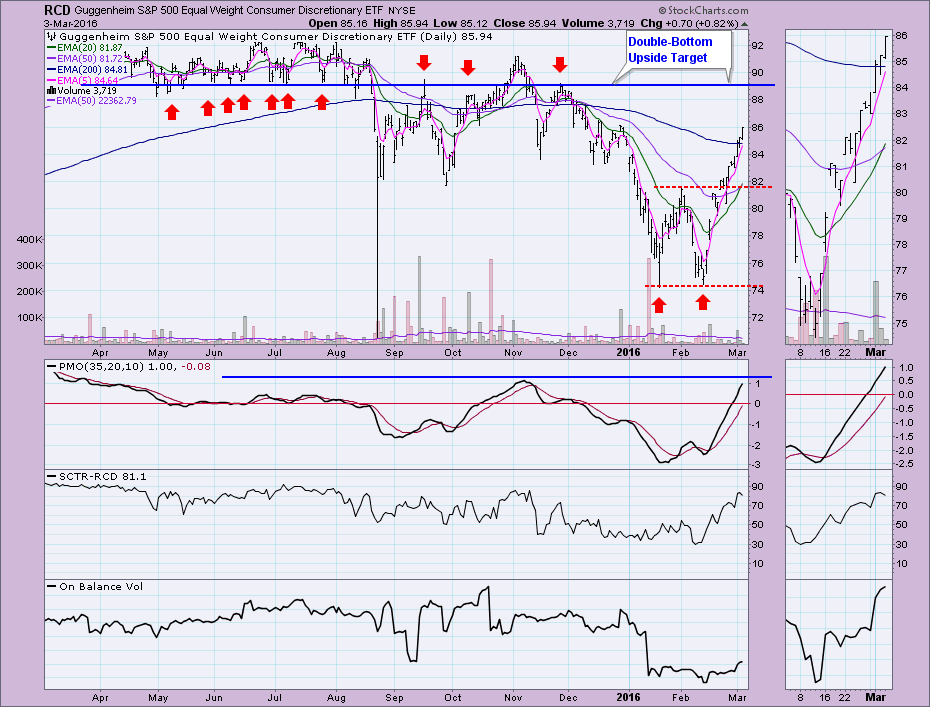
I suspect a few eyebrows were raised when they saw the title to my DecisionPoint Alert blog article today, "Fierce Overhead Resistance Looming". Resistance lines, support lines and trend lines are usually considered stronger based on how many times price "touches" them... Read More