Last week there was a one-day decline that didn't actually last a whole day. On Wednesday this week there was a rather more robust decline, but it didn't last a full day either, and the market took back a good chunk of its losses by the closing bell. As of Friday, the market was once again hitting new, all-time highs. Well, I should clarify that most broad market indexes were doing that, but two Dow components (Chevron and Merck) had a really bad day and kept the Dow nearly flat.
The DecisionPoint Weekly Wrap presents an end-of-week assessment of the trend and condition of the stock market (S&P 500), the U.S. Dollar, Gold, Crude Oil, and Bonds.
STOCKS
IT Trend Model: BUY as of 11/15/2016
LT Trend Model: BUY as of 4/1/2016
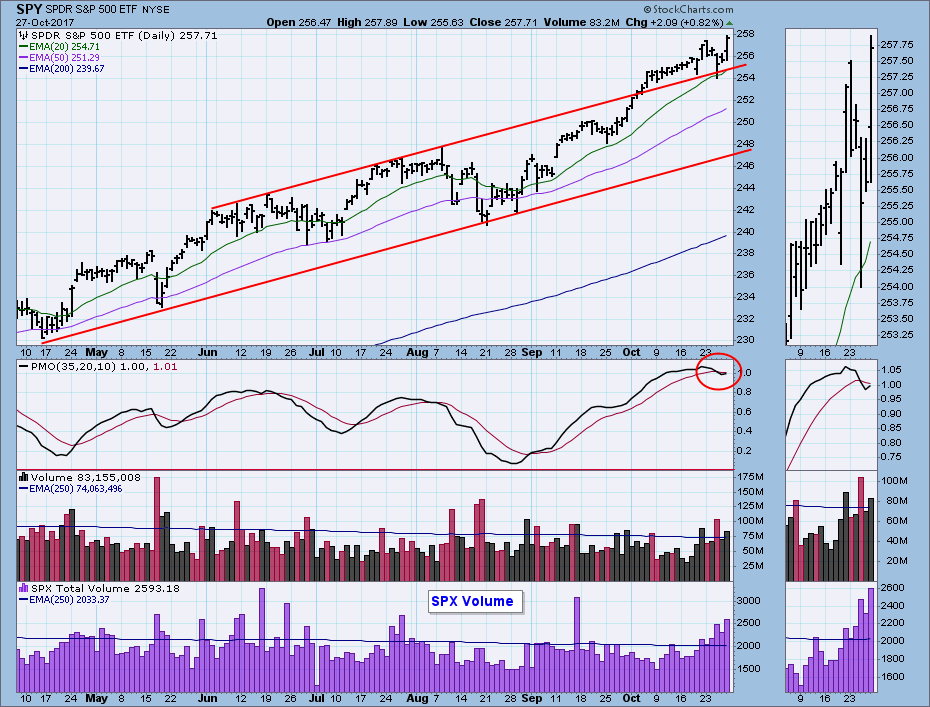
Daily Chart: SPY has reached the top of its trading channel. To clarify, the top line is drawn parallel to the rising bottoms line and placed on convenient rising tops, but I'm not sure how valid it will prove to be, because there are only two tops spaced far apart. Nevertheless, the PMO has topped and crossed down through the signal line, hinting that a price top may be at hand. The PMO turned up again on Friday, so the message is mixed.
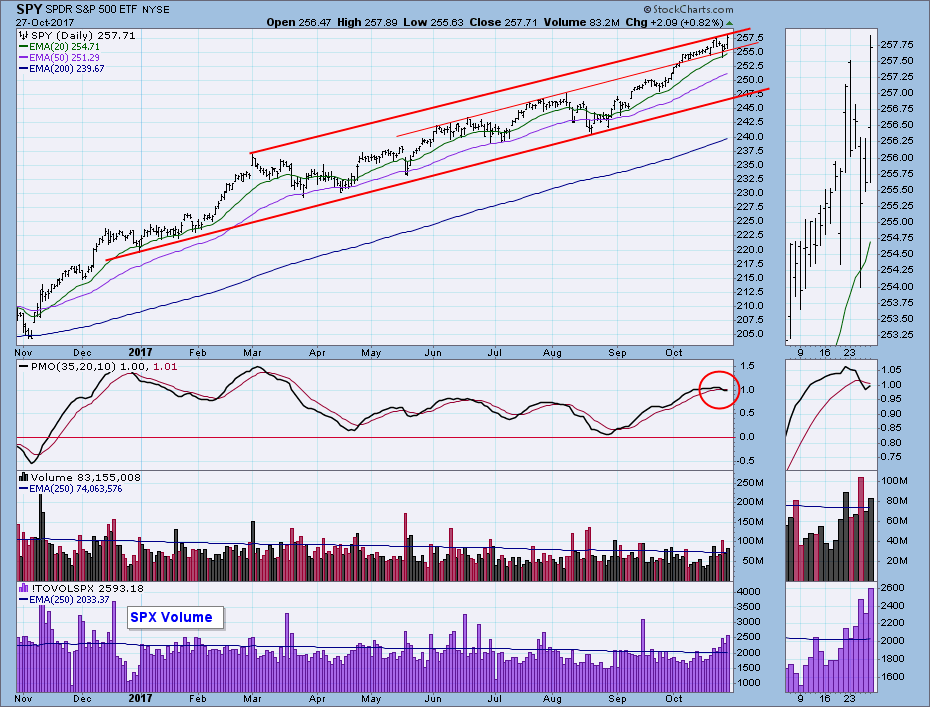
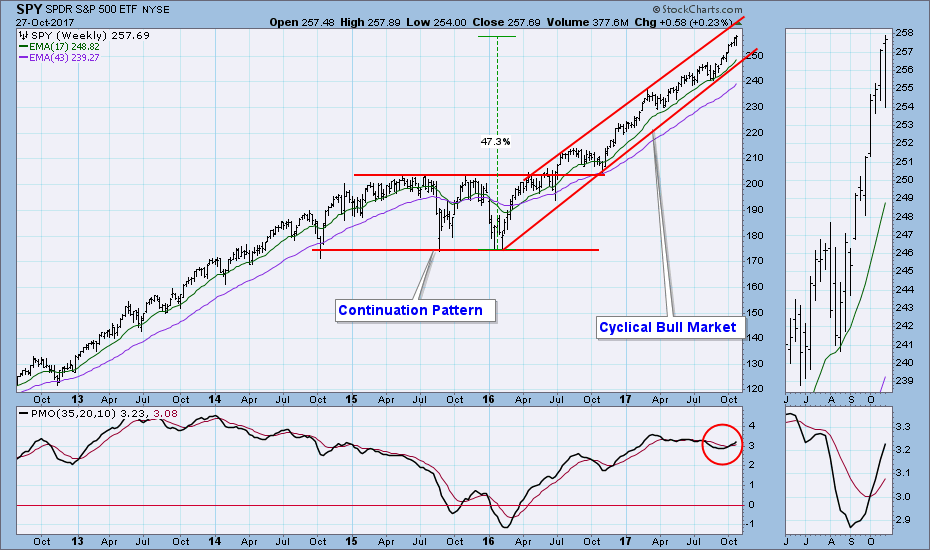
Weekly Chart: As usual, this time frame gives us a better perspective. We can see that there is still plenty of room left before price reaches the top of the rising trend channel, which makes the message from the daily chart above less compelling. The weekly PMO is rising above the signal line, which is positive.
Short-Term Market Indicators: In spite of price going up, these indicators continue to unwind, with the STO-V falling below the zero line.
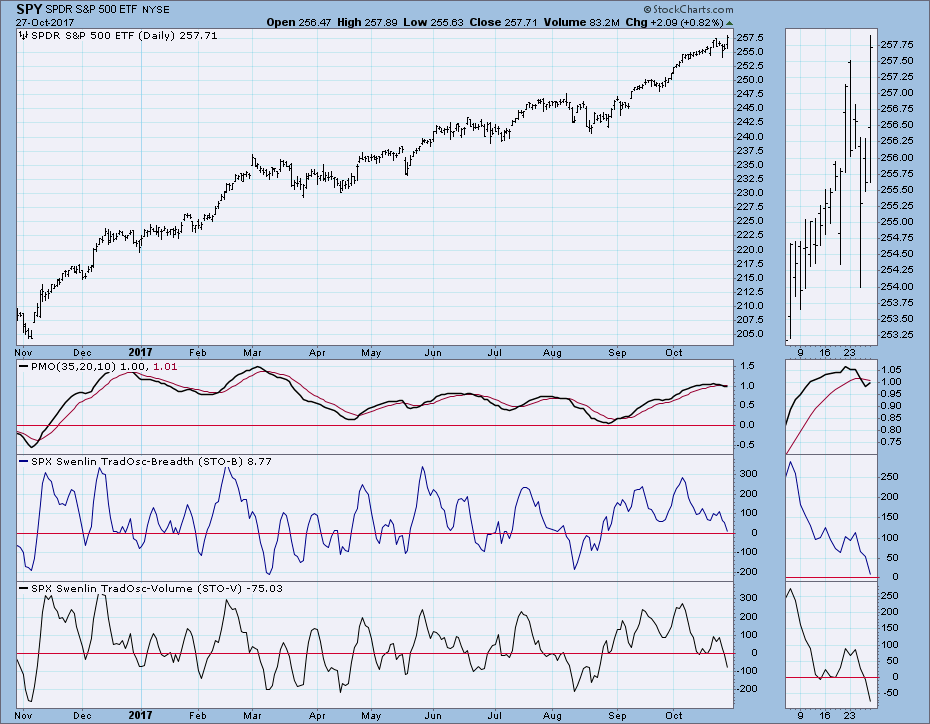
Intermediate-Term Market Indicators: The ITBM and ITVM have topped in overbought territory, and they continue to fall, shading the rally with a measure of suspicion.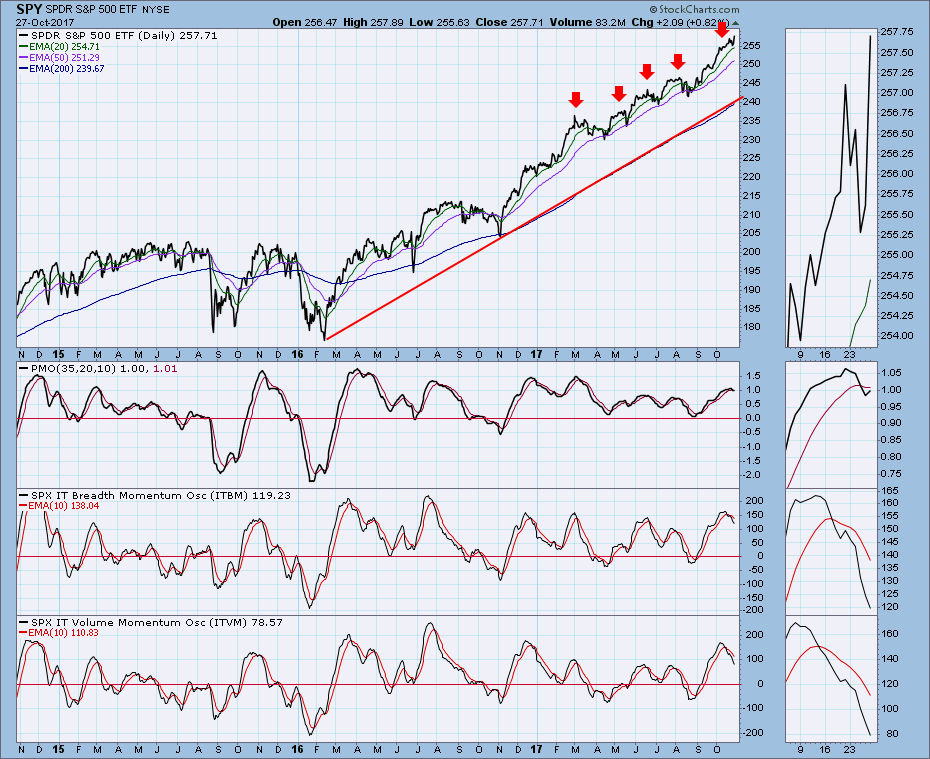 Conclusion: The rally off the November low has been relentless, and the periodic corrections have been minor. For over two months market has been rallying, correcting with pullbacks that are minuscule, so we are being conditioned to expect only blue skies. And yet, after I looked at the short- and intermediate-term charts just above, I could only conclude that the market is still vulnerable for a correction. Indicators sometimes top way ahead of price, and we shouldn't relax until they start moving higher again.
DOLLAR (UUP)
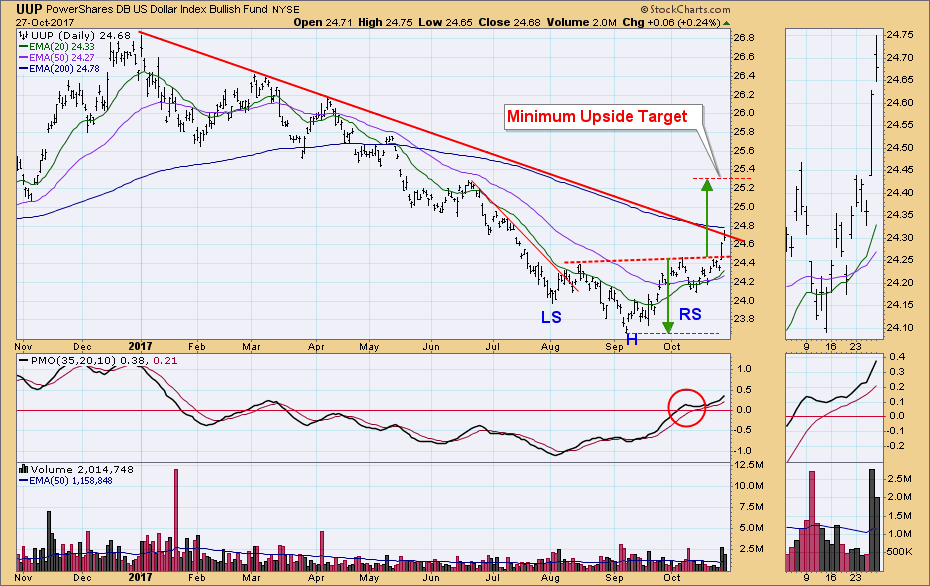
IT Trend Model: NEUTRAL as of 10/23/2017
LT Trend Model: SELL as of 5/24/2017
Daily Chart: The reverse head and shoulders pattern 'executed' when UUP broke up through the neckline. This means that the minimum upside target is equal to the distance between the head and the neckline. It is significant that the declining tops line has been engaged, as this could interfere with the rally.
Weekly Chart: The declining tops line seems more pertinent in this time frame, but the fact that the weekly PMO is above the signal line and rising, implies that the rally will continue.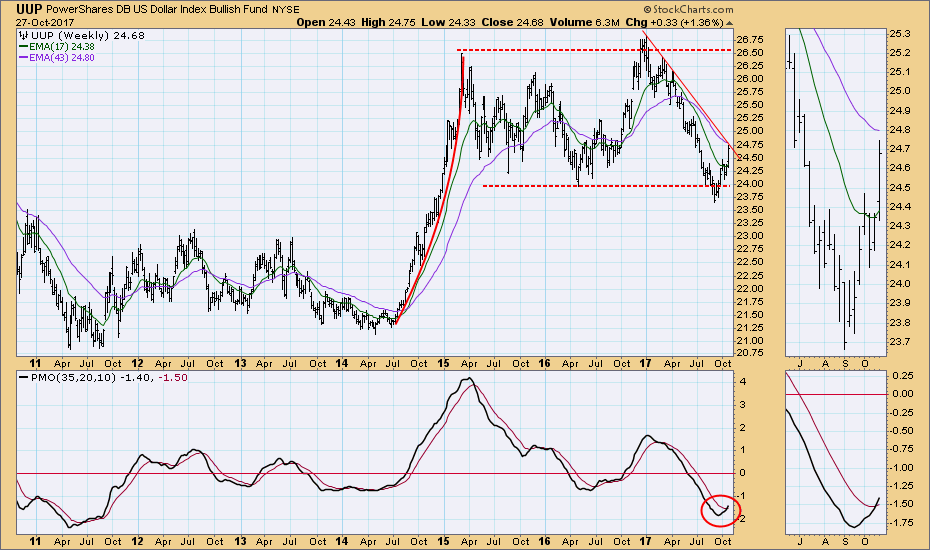
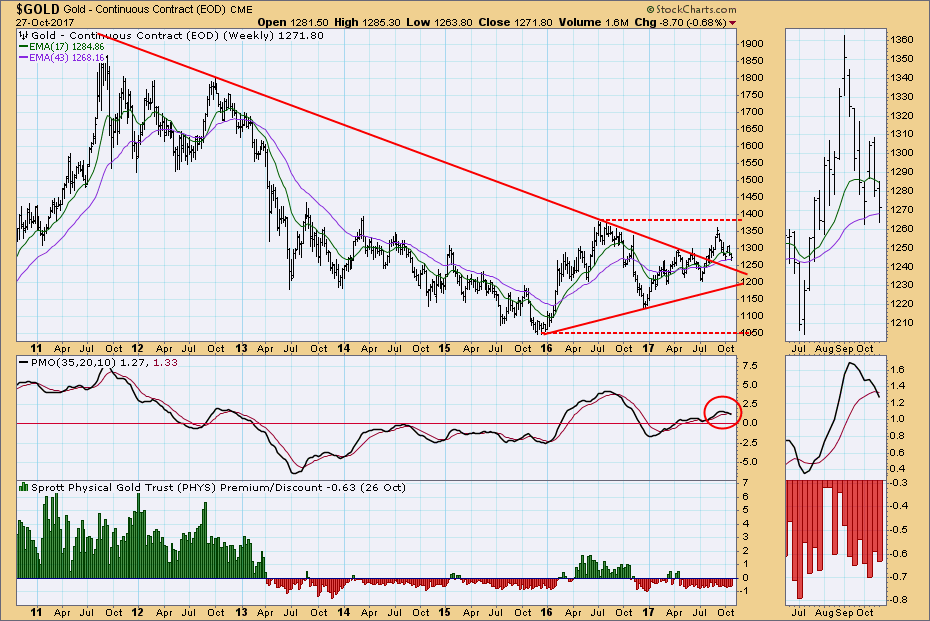
GOLD
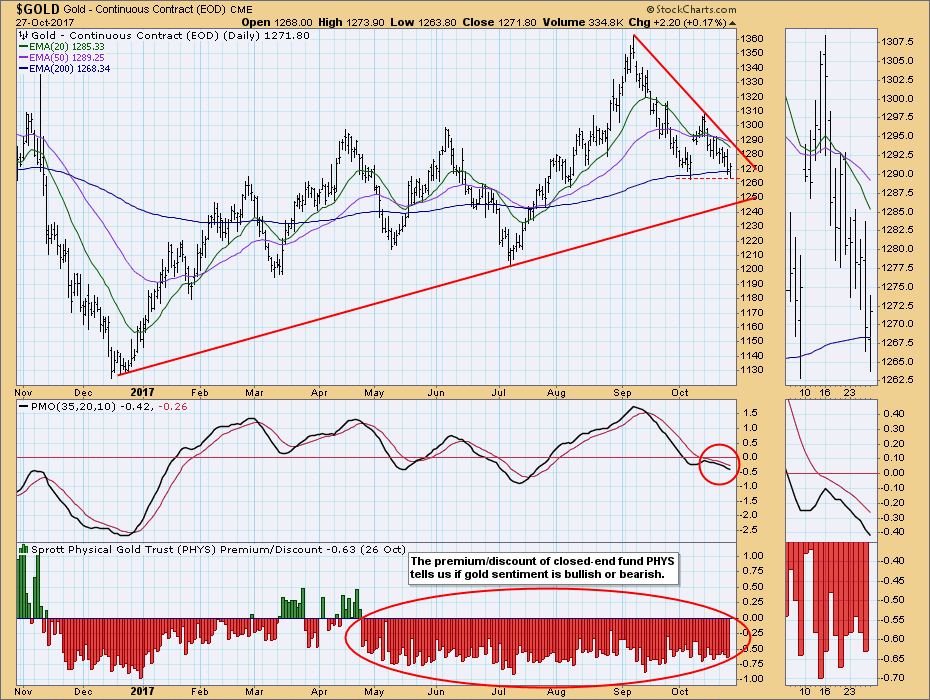
IT Trend Model: NEUTRAL as of 10/20/2017
LT Trend Model: BUY as of 4/12/2017
Daily Chart: Gold is on track for hitting a lower low in the decline from the September top. The PMO is below the signal line and falling, but the rate of decline is slow enough to offer some hope that we may see a price bottom in the near future; however, continued strength of the dollar (see above) will dash that hope.
Weekly Chart: Gold remains above the long-term declining tops line, but the weekly PMO has fallen below the signal line. The rally from the 2016 low remains intact, but the tremulous rise of the PMO during that period shows how tortured the advance has been.
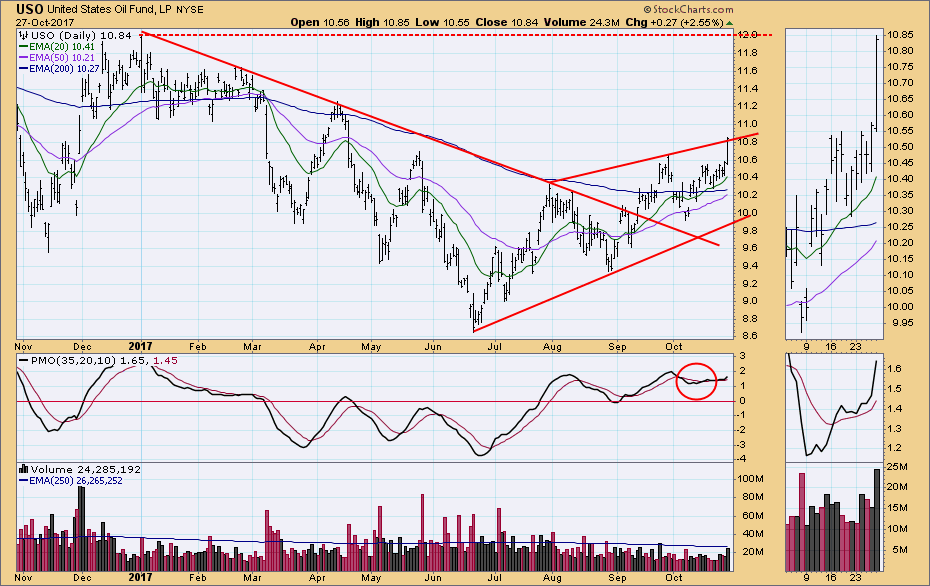
CRUDE OIL (USO)
IT Trend Model: BUY as of 9/6/2017
LT Trend Model: SELL as of 3/9/2017
Daily Chart: USO has reached the top of a rising wedge formation. I harbor some doubt that the wedge will resolve downward because: (1) It is not a very tight wedge; (2) the decline from the September high never reached the bottom of the wedge; and (3) the PMO suggests that the current up move may continue for an upside breakout.
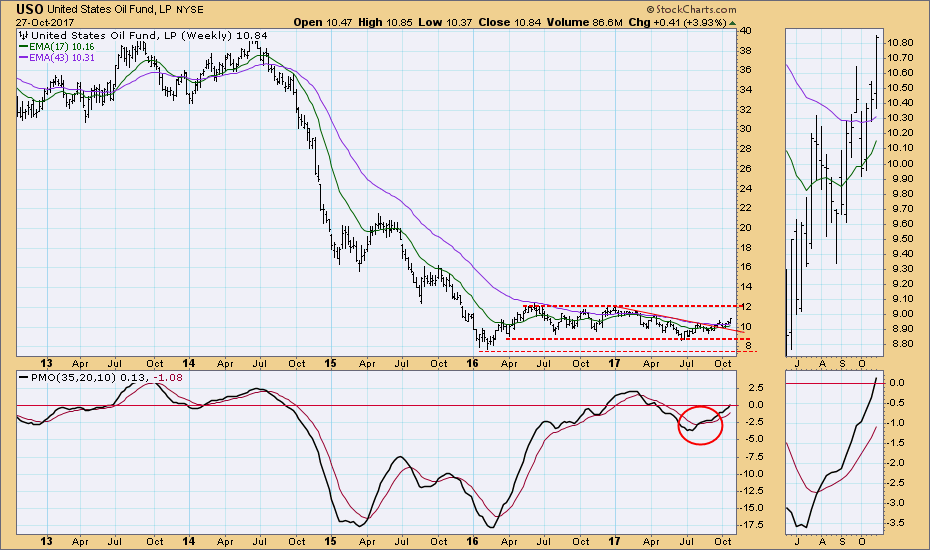
Weekly Chart: This week USO made another new high in the rally from the July low. The weekly PMO is rising, but the rate of climb seems a bit labored. I still see the top of the trading range as the likely rally limit.
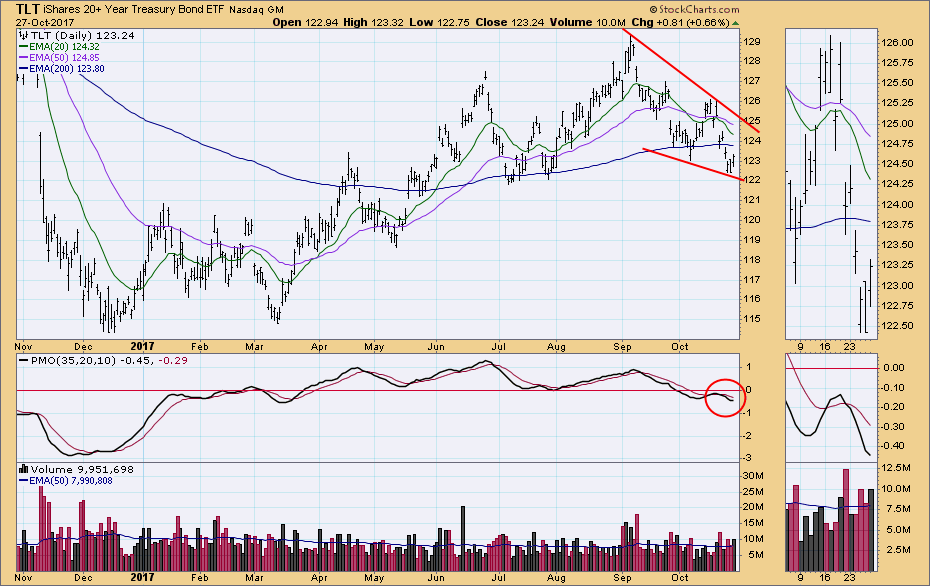
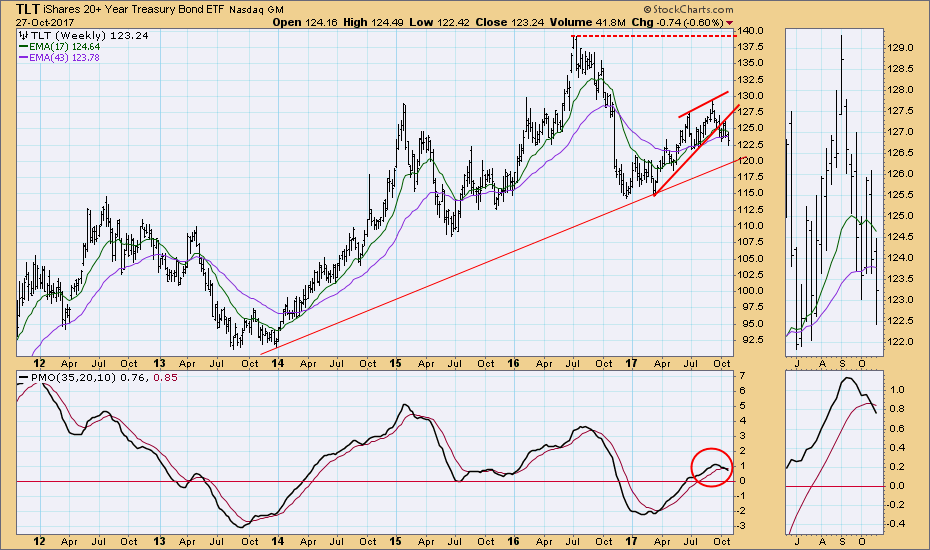
BONDS (TLT)
IT Trend Model: NEUTRAL as of 10/5/2017
LT Trend Model: BUY as of 6/16/2017
Daily Chart: Based upon Friday's bounce, a falling wedge formed this week. If the very short-term up trend continues, it would strengthen the technical expectation of an upside breakout.
Weekly Chart: Weeks ago TLT broke down from a rising wedge formation, which was the technical expectation. This week TLT made a lower low, establishing a down trend from the September top. The weekly PMO is below the signal line and falling, painting a bearish picture in this time frame.
**Don't miss any of the DecisionPoint commentaries! Go to the "Notify Me" box toward the end of this blog page to be notified as soon as they are published.**
Technical Analysis is a windsock, not a crystal ball.
Happy Charting!
- Carl
NOTE: The signal status reported herein is based upon mechanical trading model signals, specifically, the DecisionPoint Trend Model. They define the implied bias of the price index based upon moving average relationships, but they do not necessarily call for a specific action. They are information flags that should prompt chart review. Further, they do not call for continuous buying or selling during the life of the signal. For example, a BUY signal will probably (but not necessarily) return the best results if action is taken soon after the signal is generated. Additional opportunities for buying may be found as price zigzags higher, but the trader must look for optimum entry points. Conversely, exit points to preserve gains (or minimize losses) may be evident before the model mechanically closes the signal.
Helpful DecisionPoint Links:
DecisionPoint Shared ChartList and DecisionPoint Chart Gallery
Price Momentum Oscillator (PMO)
Swenlin Trading Oscillators (STO-B and STO-V)
