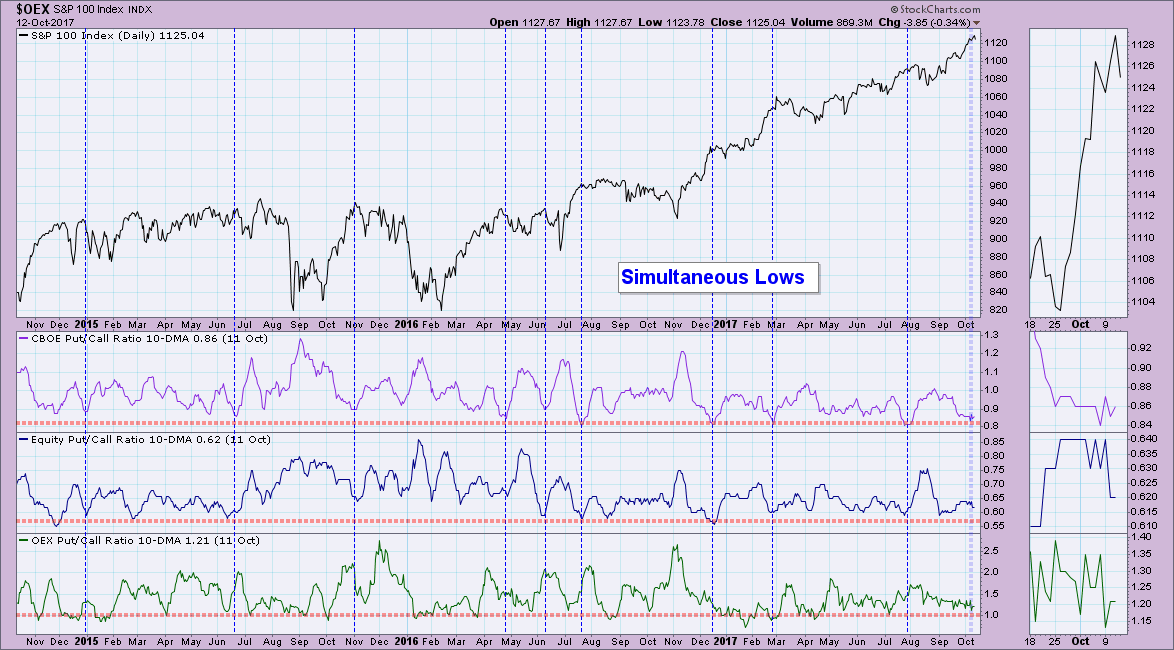
A MarketWatchers LIVE viewer emailed me today and suggested I revisit the Put/Call Ratio chart. Upon recommendation, I did just that and was glad that he pointed it out to me so that I could point it out to you. I'll be talking about it in more detail during tomorrow's MarketWatchers LIVE show, so be sure to join Tom and I at 12:00p - 1:30p EST or catch the latest episode on our webinars page.
I really didn't have to update the annotations here because in an article I wrote in December 2016 pointed out the same configuration. Typically when these ratios reach simultaneous lows (the OEX ratio will many times have an inverse relationship to the other two because those tend to be used as hedges by large money movers), it precedes a period of correction or consolidation. Remember, as the ratio gets smaller and smaller, that means that the amount of calls is accelerating faster than the amount puts. When everyone is buying calls, that implies traders are extremely bullish. When everyone is very bullish, that is generally when the market reverses.
I took a quick peek at the new numbers for the American Association of Individual Investors (AAII) sentiment poll and you can see that the little guys are feeling more bullish which is why the ratio is getting larger. We certainly aren't looking at bullish extremes on this ratio but it does suggest an increase in bullishness which is bearish for the market.
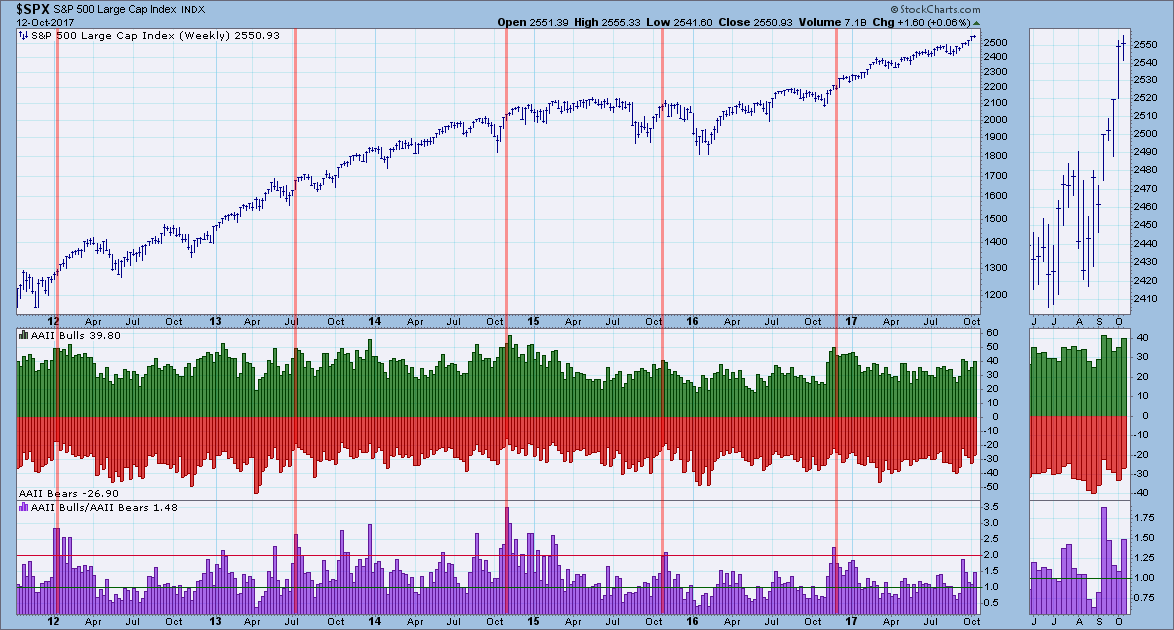
Conclusion: Let's face it, it is extremely hard to be bearish in the face of a strong bullish windstorm, but the market is overbought and ready for a longer break or <gasp> a correction. I believe the ratios can get more overbought and in the area of sentiment, more bullish. The AAII chart is clear that while investors are very bullish, the amount of bears isn't dissipating that quickly.
Helpful DecisionPoint Links:
DecisionPoint Shared ChartList and DecisionPoint Chart Gallery
Price Momentum Oscillator (PMO)
Swenlin Trading Oscillators (STO-B and STO-V)
Technical Analysis is a windsock, not a crystal ball.
Happy Charting!
- Erin
**Don't miss DecisionPoint Commentary! Add your email below to be notified of new updates"**
