I have a few DecisionPoint charts that are "must-see" right now. Anytime I look at my ChartLists and a chart smacks me in the face, I always try to share it. Today during the MarketWatchers LIVE show, two of those charts got me and the third, Carl slid my way to make sure I saw it. Glad I did!
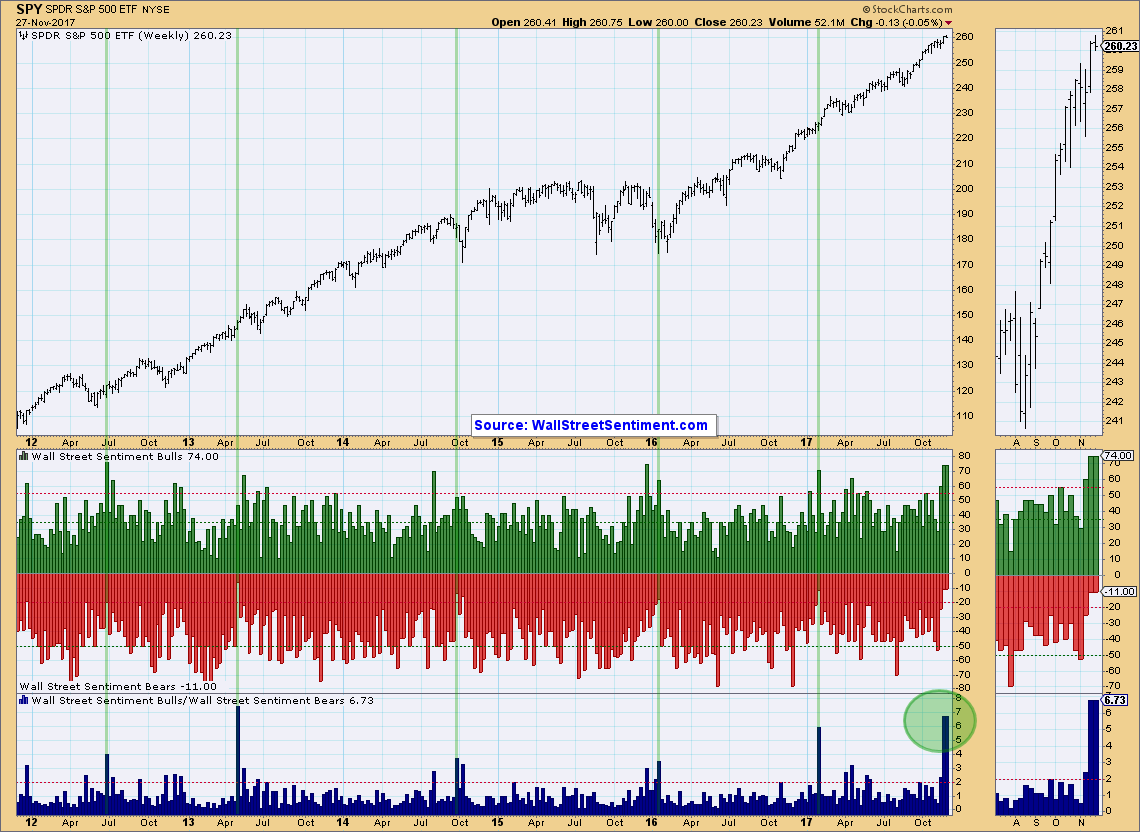
Carl sent me the Wall Street Sentiment Survey chart. I generally review this on the MarketWatchers LIVE show, but didn't get an opportunity with the jam packed show we recorded today. I think a quick look at this chart, even without annotations, would have popped you in the nose too! The bull/bear ratio on the WSS chart has hit the roof! There are more than 6 times the amount of bulls to bears. I think this is due to a few factors. First, we are now entering the usually bullish holiday season, so many of the pollees who are familiar with seasonality, may have chosen to look at that to influence their vote. Second, after a very positive trading week, some may have thought it was an initiation to higher prices. My bull vote came in because our short-term indicators on Wednesday were still rising, but have plenty of room to move even higher.
Typically, sentiment is contrarian and if you see a preponderance of bulls, it is likely we will see a pullback or decline. I consider the Wall Street Sentiment Survey to be slightly different. This survey asks what those polled think the market will do the following week only. With a shorter timeframe, the market timers who take this poll tend to be more right than contrarian. I've annotated the times we've seen similar bull/bear ratios. I happen to think that timers are going to be right this week, although as Mark Young noted in his Survey publication--we could see weakness, but not likely an end to the current rally.
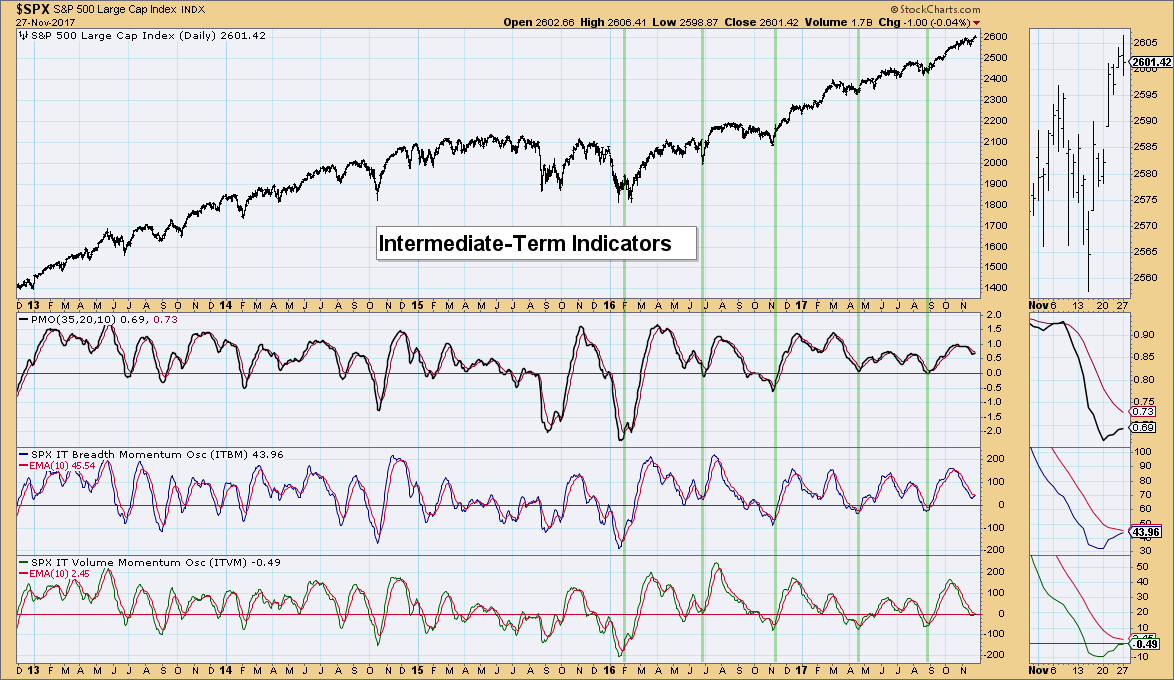
The Intermediate-Term Indicators, ITBM and ITVM have bottomed and appear to be ready to make positive crossovers on their signal lines. This suggests more rally to come!
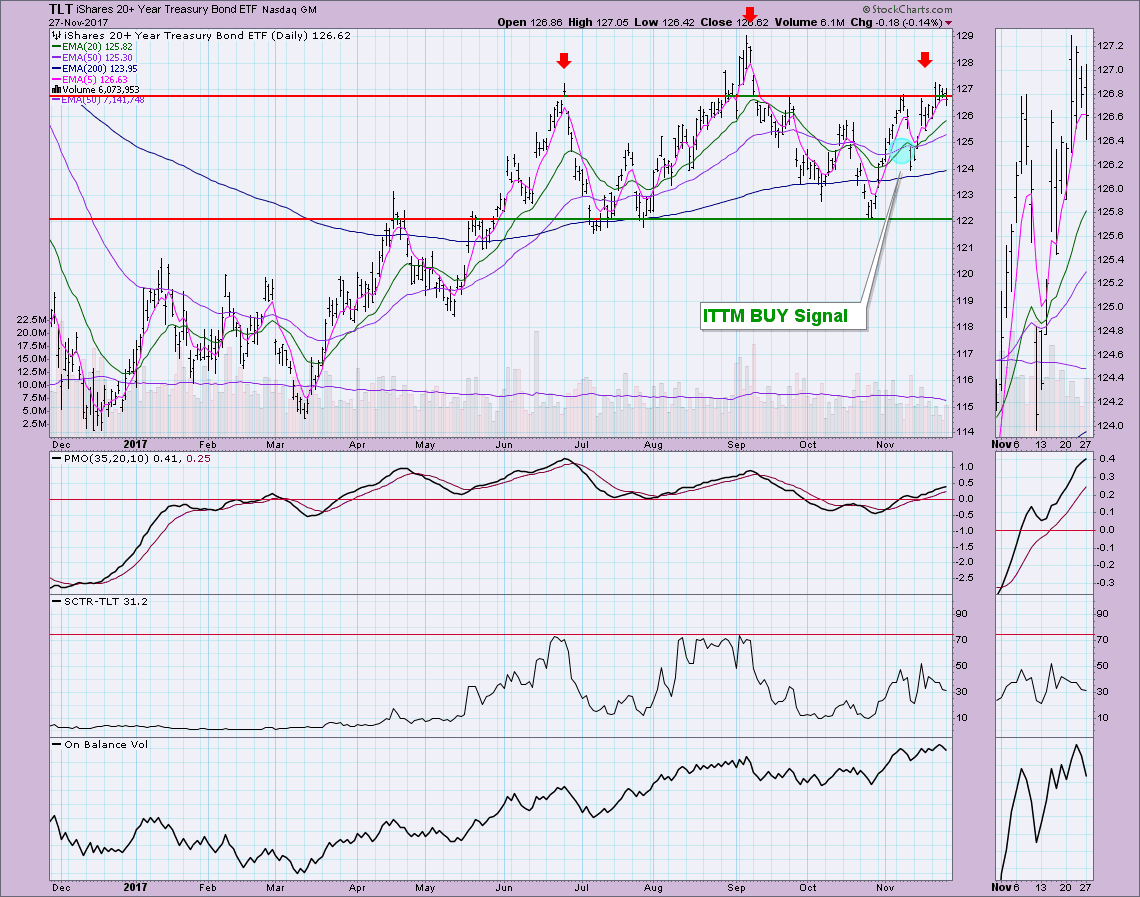
I hadn't seen it until today's show--Greg Schnell pointed out a possible complex head and shoulders that might be forming on TLT. The critical point to the formation of this pattern is right now as it works on putting in a right shoulder. Price has hit resistance, managed to climb slightly above it and now has closed below it. The $127 level needs to be overcome or we could be seeing a large topping head and shoulders firm up. The good news is that the PMO is still rising and OBV looks healthy enough on the current ITTM BUY signal.
Helpful DecisionPoint Links:
DecisionPoint Shared ChartList and DecisionPoint Chart Gallery
Price Momentum Oscillator (PMO)
Swenlin Trading Oscillators (STO-B and STO-V)
Technical Analysis is a windsock, not a crystal ball.
Happy Charting!
- Erin
**Don't miss DecisionPoint Commentary! Add your email below to be notified of new updates"**
