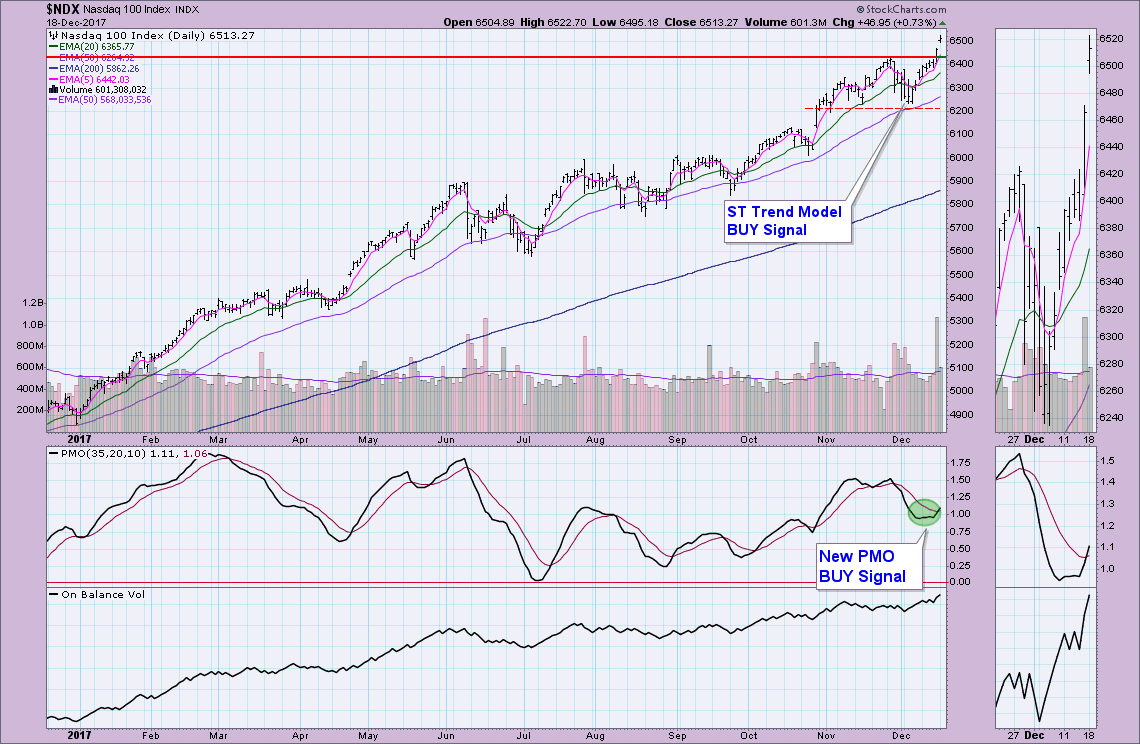
 The only red arrow left on the DP Scoreboards was erased today as the NDX triggered a PMO BUY signal on the daily chart. The last time we saw no red on the Scoreboards, it lasted about two days. The bull winds are blowing hard, so I think this all "green" board should stick around a bit longer.
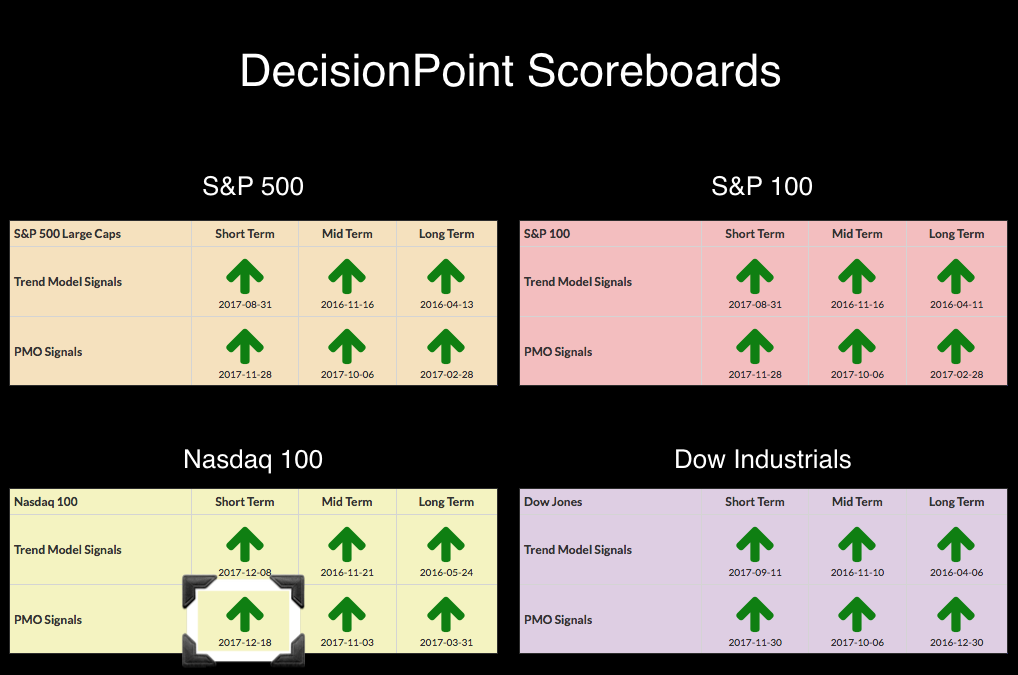
STOCKS
IT Trend Model: BUY as of 11/15/2016
LT Trend Model: BUY as of 4/1/2016
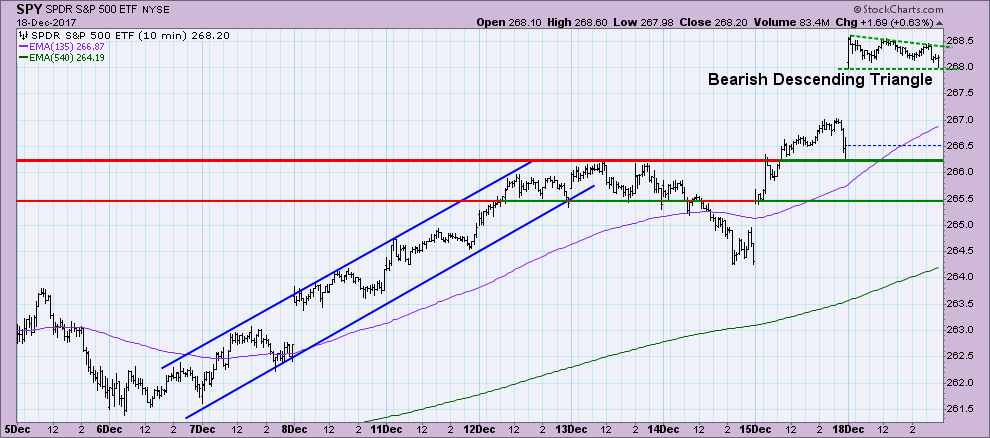
The 10 minute bar chart suggests to me we are about to experience some "pause". First it looks like a possible island reversal and combine that with a descending triangle, I'd be looking for a pullback tomorrow. Of course, it could rip back up in the afternoon after a decline in the morning.
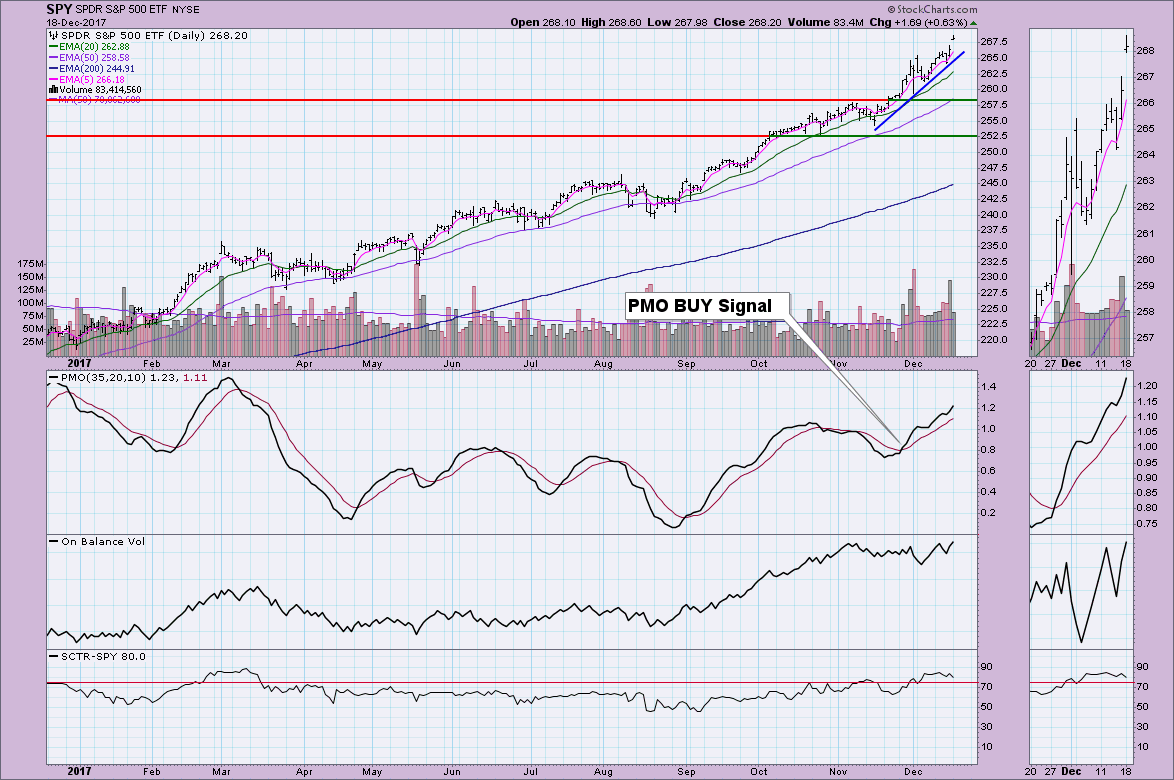
 The indicators are still configured quite positively for the SPY. Volume was nice on this rally (note Friday's volume was unusually high due to options expiration) and the OBV is rising with price. As noted above, I'd be a little concerned about today's gap closing, but I doubt the decline will become something more serious.
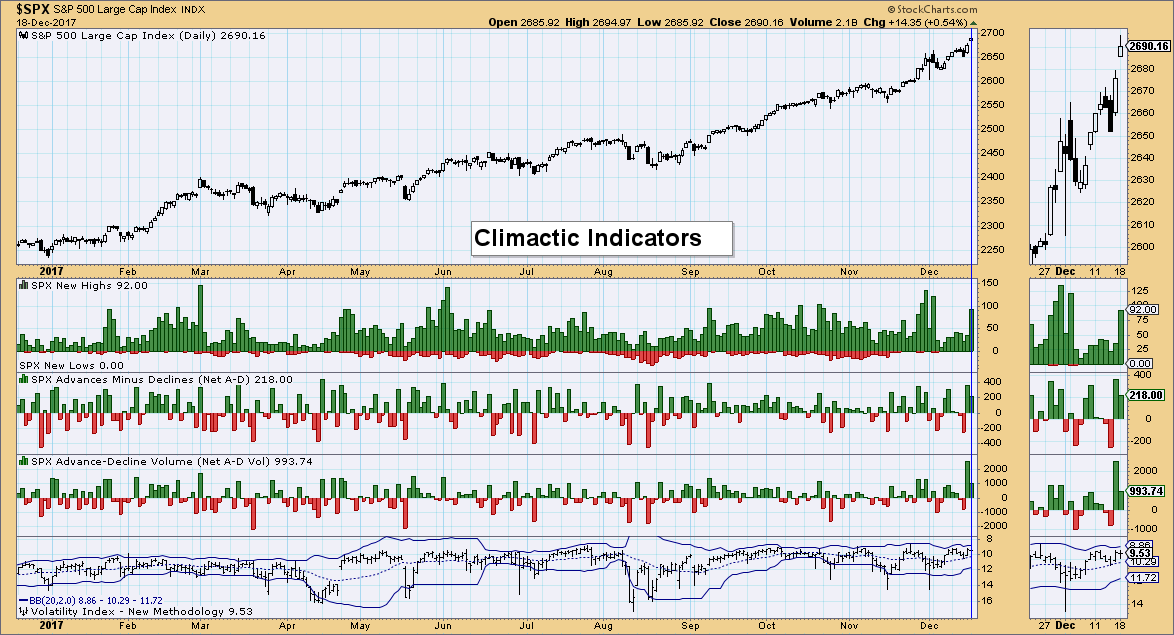
Climactic Indicators: These indicators shouted "upside initiation" on Friday's readings and that's exactly what we saw today. New highs popped today which is generally bearish for the market thereafter. I think this just bolsters the case for a pause right now.
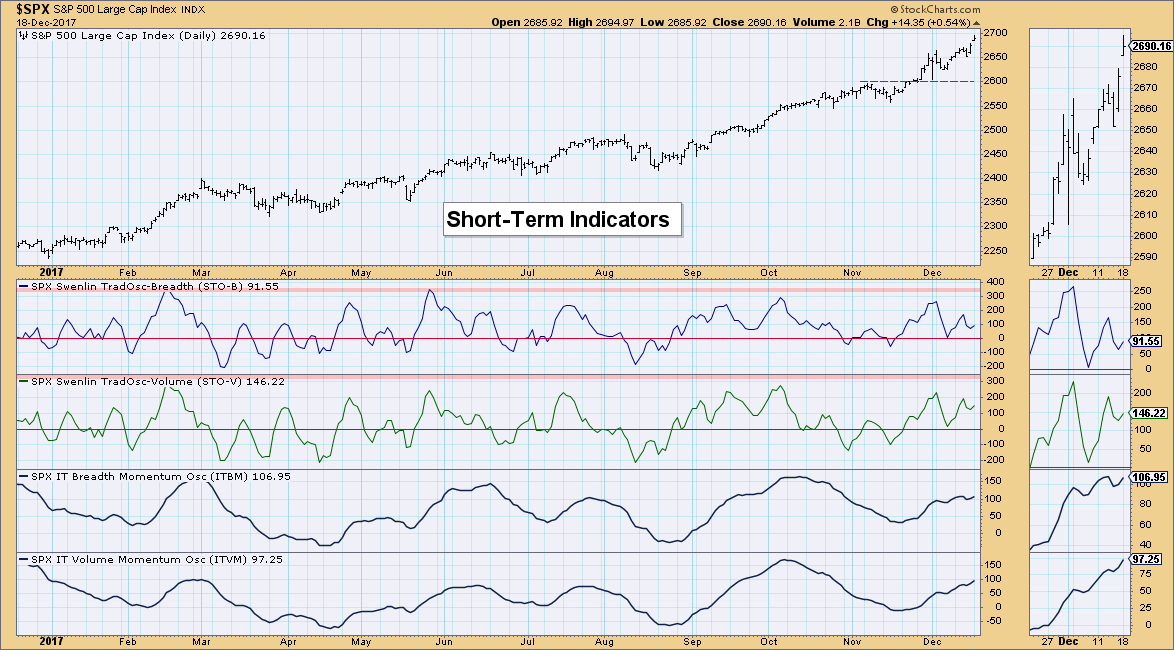
Short-Term Indicators: This indicators have turned back up which is short-term bullish. They aren't particularly overbought, but today is the first day they have made their way higher.
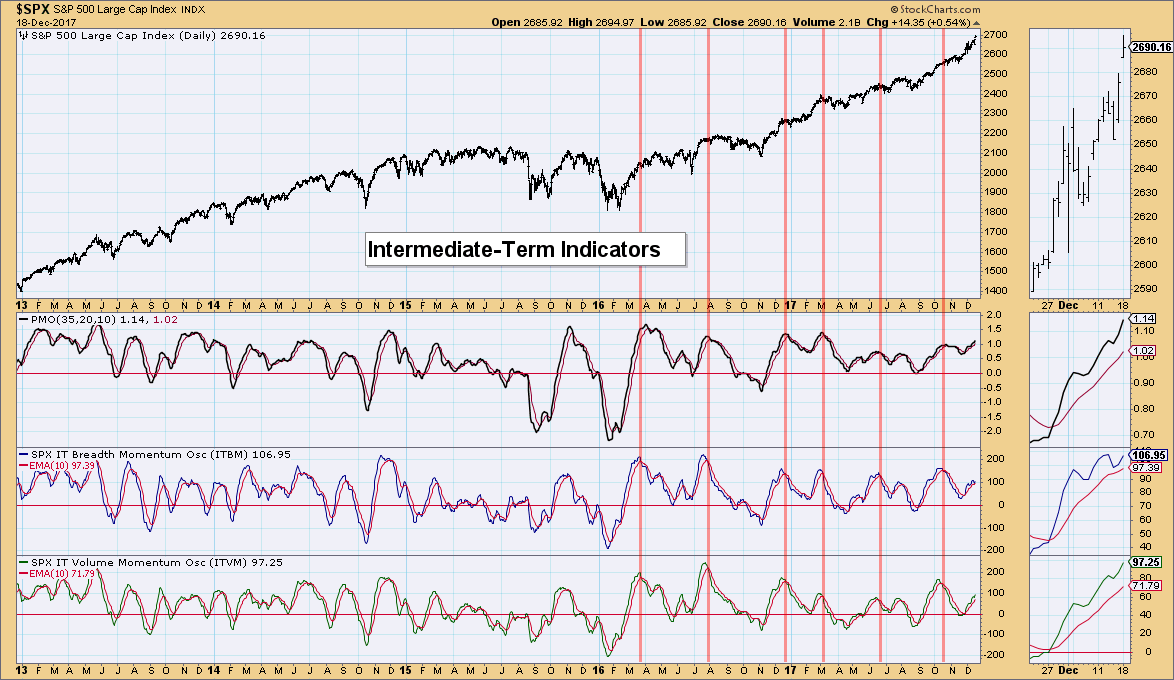
Intermediate-Term Indicators: As I mentioned last week when these indicators were falling, we don't need to concern ourselves too much until we see negative crossovers signal lines. I think the indicator movement in the thumbnail makes it clear why I wait for crossovers.
Conclusion: It's the week before Christmas and typically we see rallies. The market needs a pause and I think we will see it over the next two weeks. Overall, I don't expect to see any outrageous rallies or price shocks through holiday trading. However, talk to me in January and I likely will have changed that tune.
DOLLAR
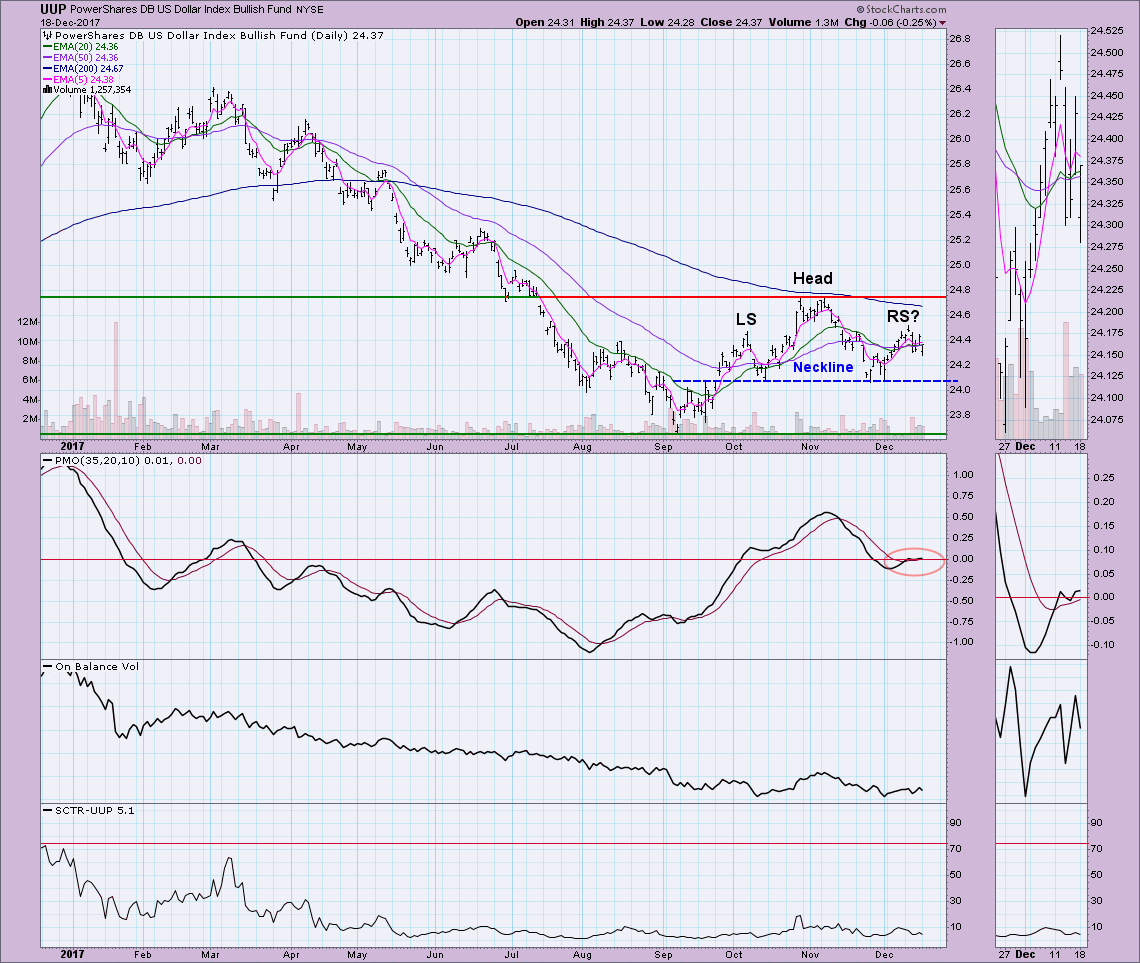
IT Trend Model: BUY as of 12/12/2017
LT Trend Model: SELL as of 05/24/2017
Talk about a textbook head and shoulders formation. I'm not so sure we will see it execute though. The PMO is really fighting this decline and has even managed to get itself above the zero line. The OBV doesn't look so bad in the thumbnail either with rising tops and bottoms right now.
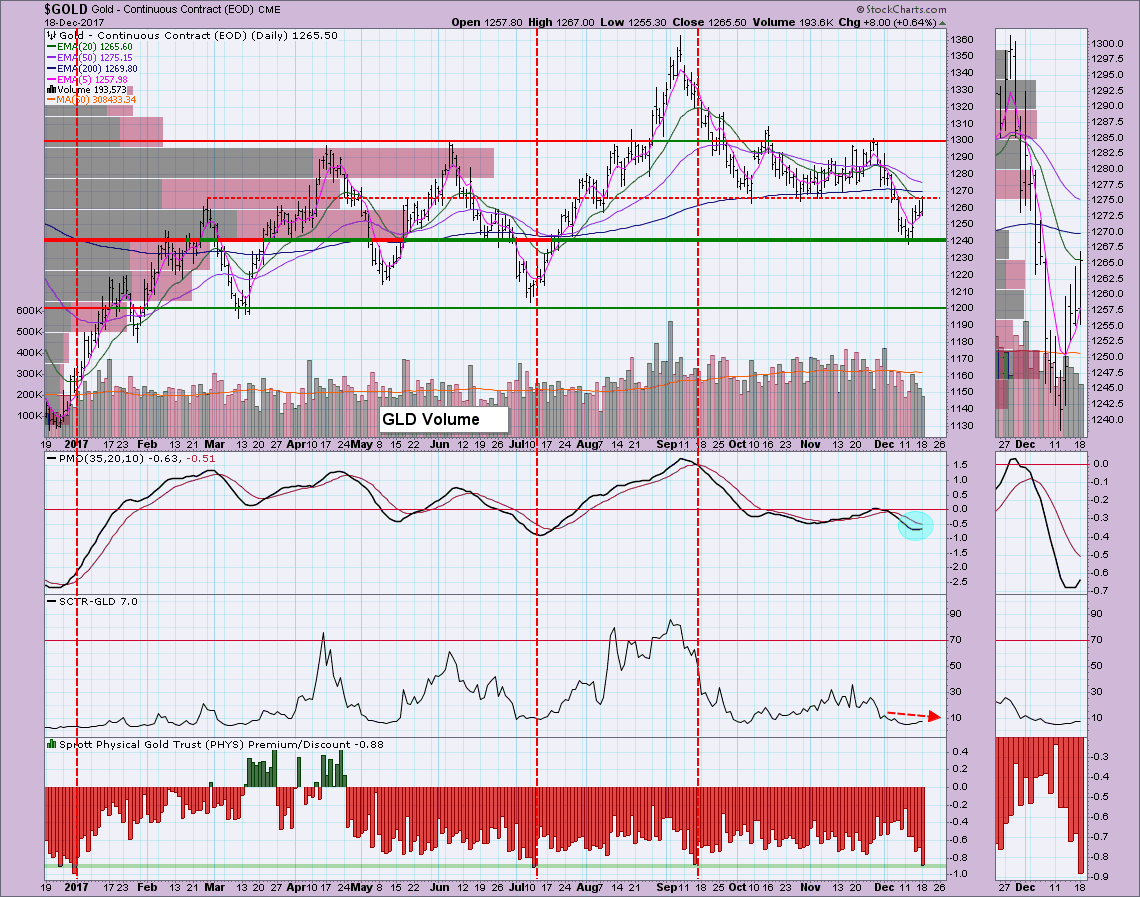
GOLD
IT Trend Model: NEUTRAL as of 10/20/2017
LT Trend Model: BUY as of 4/12/2017
Gold is finally ready to rally in my estimation. It was amazing how price managed to find support right where volume by price would suggest. This new rally is now accompanied by a PMO that has turned up nicely. Most importantly, I have highlighted when we've seen especially high discounts and the ensuing rally that will usually follow. Everyone's first question is what happened in September? In this case look at the PMO and SCTR positioning. I would not have been looking for a bottom and correctly so. However, when the PMO is configured positively, a rally does seem to ensue. The configuration is positive right now minus the EMAs which require a few positive crossovers right now to get the faster moving EMAs to the top.
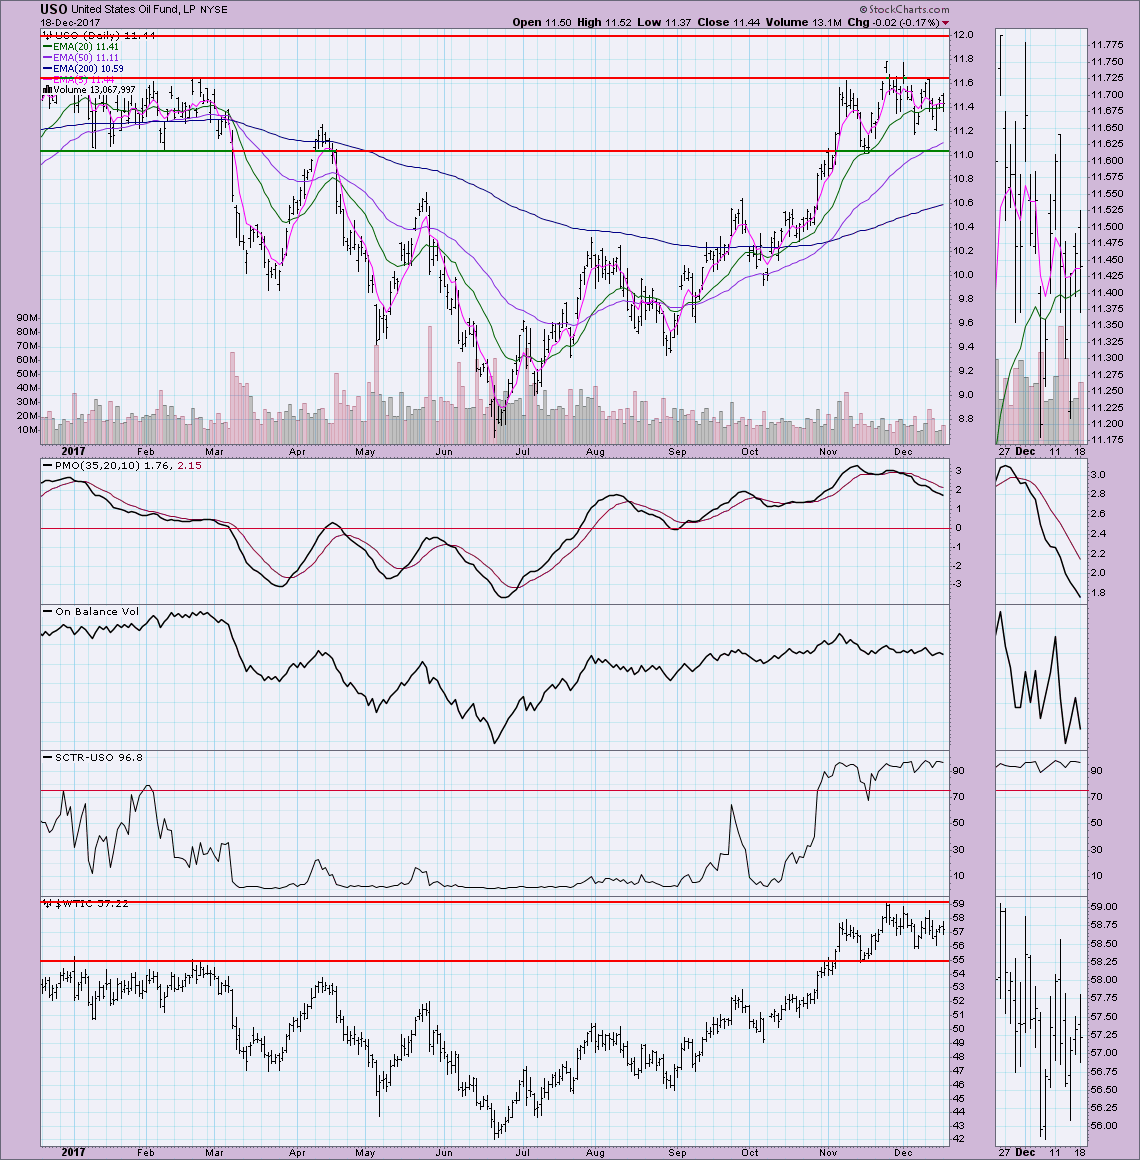
CRUDE OIL (USO)
IT Trend Model: BUY as of 11/2/2017
LT Trend Model: BUY as of 9/7/2017
USO and Oil have been consolidating sideways, albeit in a volatile manner. It looks like a bull flag forming in the intermediate term. The OBV doesn't look great and the PMO is declining. A little more consolidation will do Oil some good as it brings the PMO out of overbought territory without a deep decline.
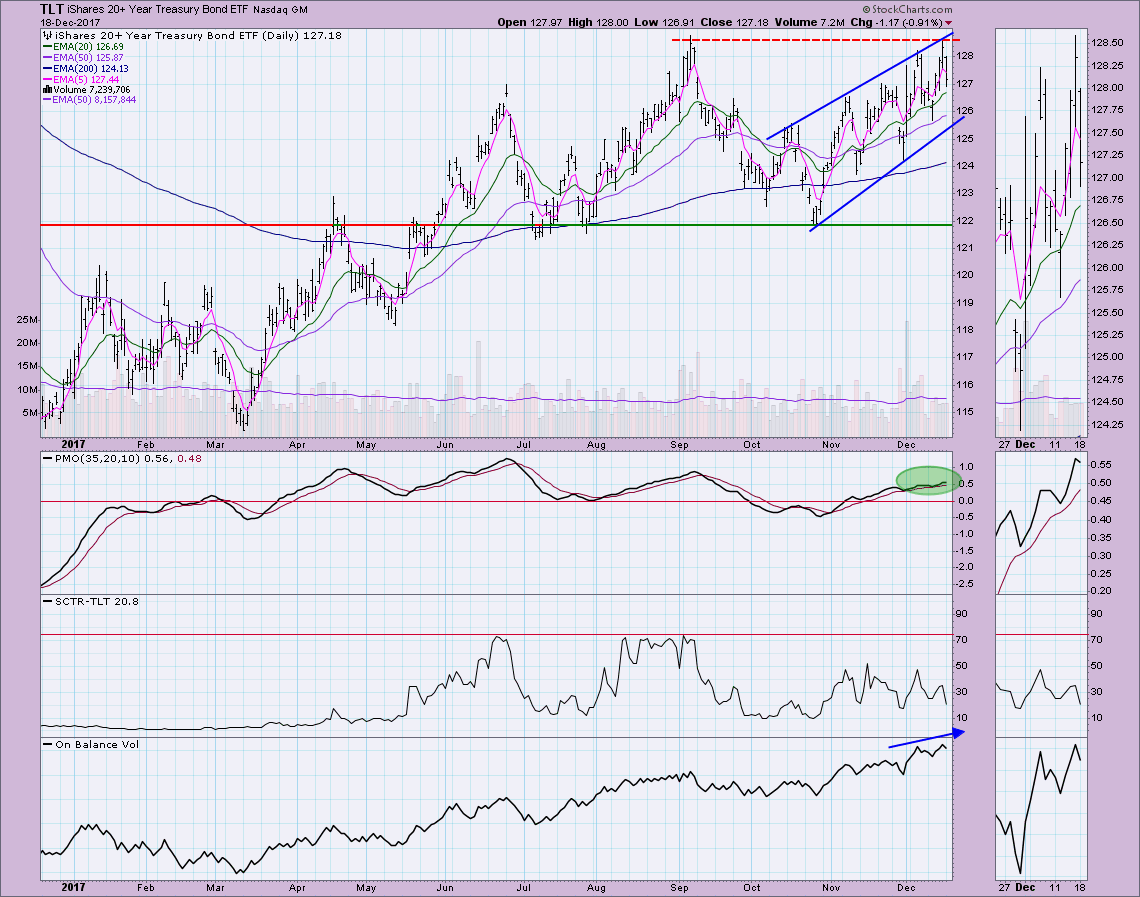
BONDS (TLT)
IT Trend Model: BUY as of 11/8/2017
LT Trend Model: BUY as of 6/16/2017
I don't like this set up on TLT. While not particularly negative, given the bullish confirmation between the OBV tops and price tops. However, we are looking at a large rising wedge which is bearish and an unsuccessful test of overhead resistance. The PMO has ticked down, but it is slowly rising with price and isn't fully overbought. So many mixed messages here, I would avoid it.
Helpful DecisionPoint Links:
DecisionPoint Shared ChartList and DecisionPoint Chart Gallery
Price Momentum Oscillator (PMO)
Swenlin Trading Oscillators (STO-B and STO-V)
Technical Analysis is a windsock, not a crystal ball.
Happy Charting!
- Erin
**Don't miss DecisionPoint Commentary! Add your email below to be notified of new updates"**
