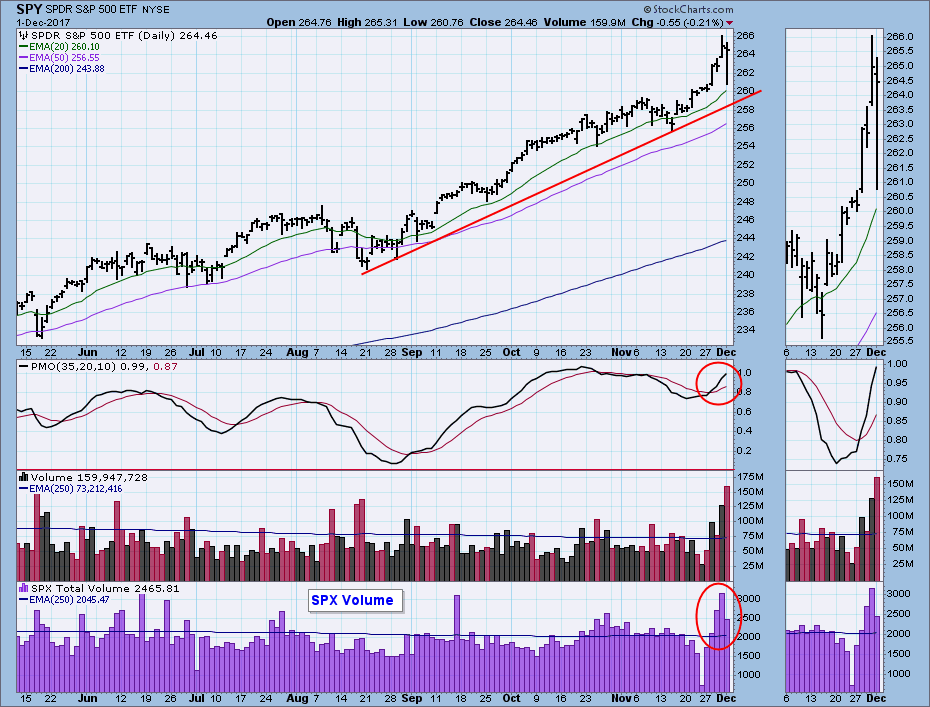
There were a couple of news stories on which to blame Friday's pullback, but my opinion is that the vertical up move of the prior three days was a short-term blowoff that needed to be corrected. The blowoff is most readily identified by the rapidly expanding volume midweek, capped by a buying climax on Thursday. I usually include the SPX volume panel with the SPY chart because it tells the story of the S&P 500, whereas SPY volume is all about the ETF.
The DecisionPoint Weekly Wrap presents an end-of-week assessment of the trend and condition of the stock market (S&P 500), the U.S. Dollar, Gold, Crude Oil, and Bonds.
STOCKS
IT Trend Model: BUY as of 11/15/2016
LT Trend Model: BUY as of 4/1/2016
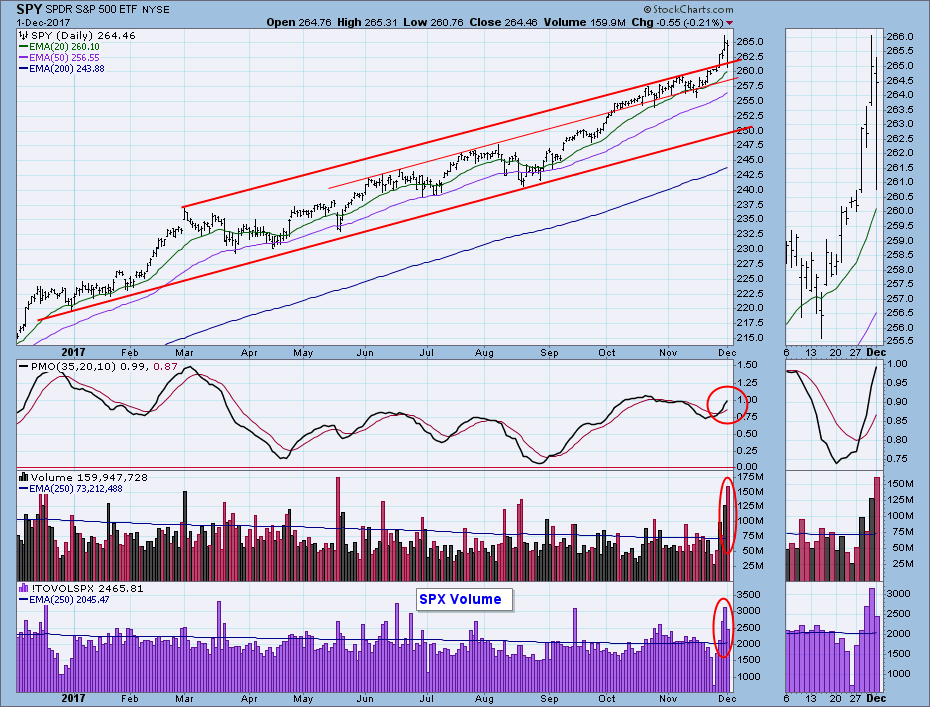
Daily Chart: This week price broke out of the fanciful rising trend channel that appears on the one-year daily chart. While there was a furious pullback to the point of breakout on Friday, price closed well above the top of the channel. SPX volume blewoff on Thursday, and SPY volume spiked on Friday, hinting that there was a selling climax.
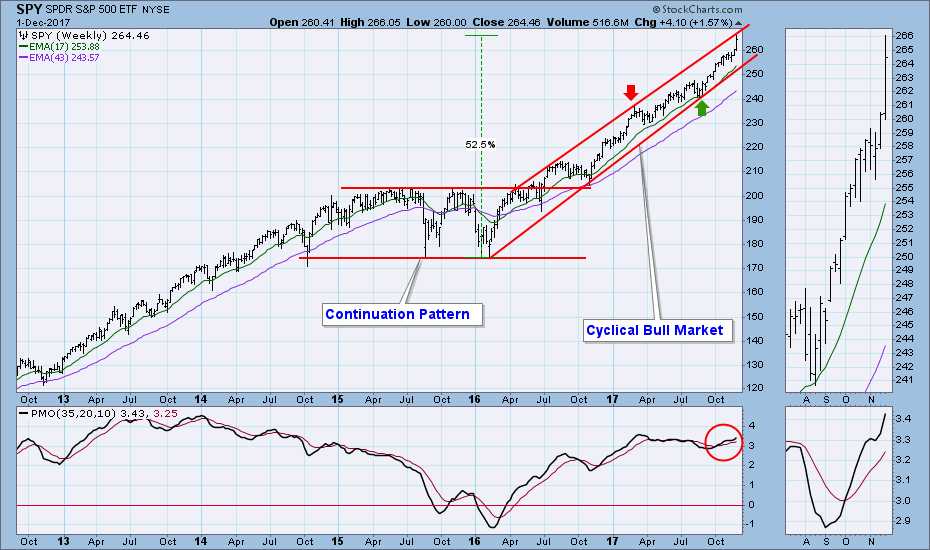
Weekly Chart: In this time frame we can see that price has reached the top of the nominal rising trend channel that has contained the cyclical bull market for almost two years. The angle of ascent has become so steep, it seems reasonable that price should start movement toward the bottom of the channel. That doesn't necessarily mean lower prices. Earlier this year a correction took place (from red arrow to green arrow) that was not really the usual correction -- SPY finally hit the rising trend line at a level that was higher than where the correction began.
Short-Term Market Indicators: These indicators are getting overbought, but not so much as to interfere with the rally yet.
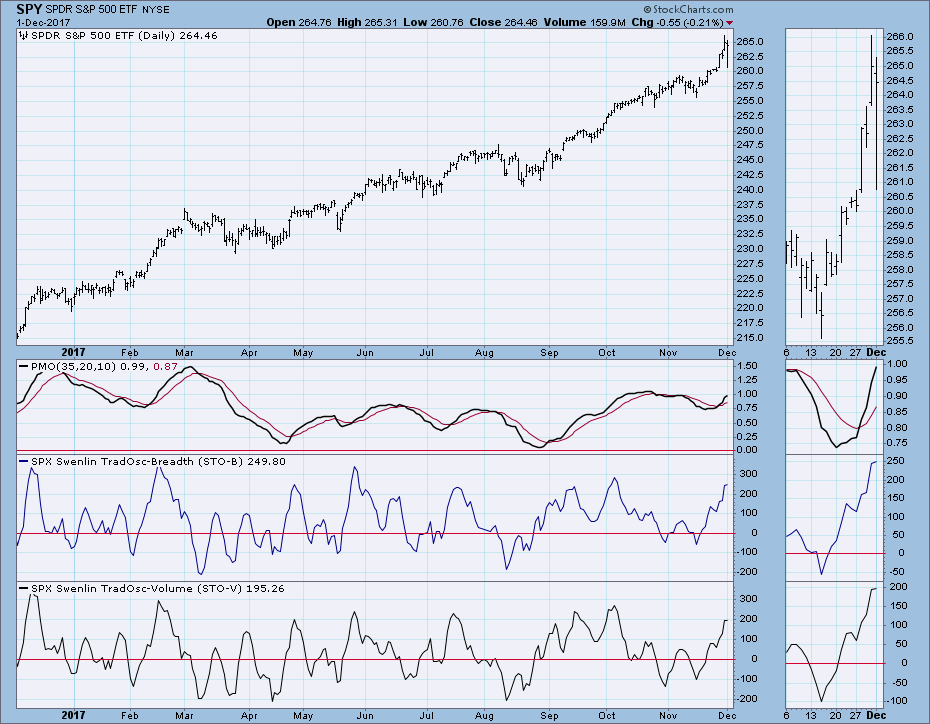
Intermediate-Term Market Indicators: These indicators have plenty of room to accommodate much higher prices. We're still looking at a very nice setup for a continued rally.
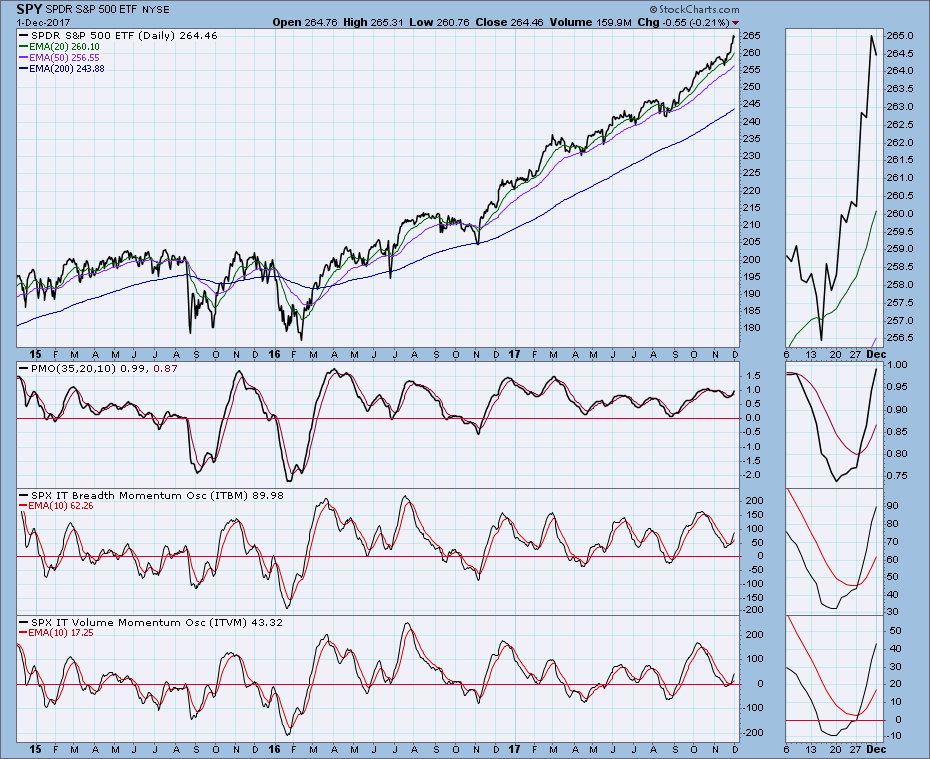
Conclusion: In spite of plenty of cover stories explaining Friday's pullback, the technical picture tells us that the market just got overheated and ascended at an unsustainable angle. The fact that Friday's deep pullback didn't last very long tells me that the bull is still alive and well -- plenty of people out there buying the dip. For the record, I don't consider that intraday air pocket a "dip" for people with an intermediate-term time horizon. Nevertheless, it was a high-volume selling climax that may have offset Thursday's blowoff. Notice on the chart immediately above that SPY is displayed in line format. The line is simply too steep, and we cannot expect it to be sustained much longer without some kind of action to digest the advance. Having said that, because of Christmas seasonality my outlook is for the market to continue higher at least until the end of the year.
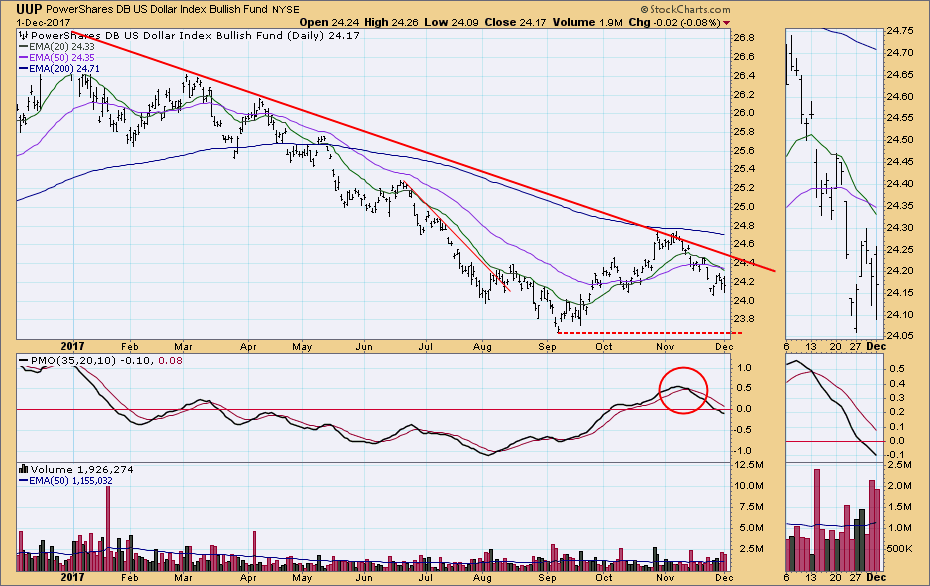
DOLLAR (UUP)
IT Trend Model: SELL as of 11/30/2017
LT Trend Model: SELL as of 5/24/2017
Daily Chart: On Thursday the UUP 20EMA crossed down through the 50EMA. Since the 50EMA is below the 200EMA, an IT Trend Model SELL signal was generated. This is the most bearish configuration of the Trend Model.
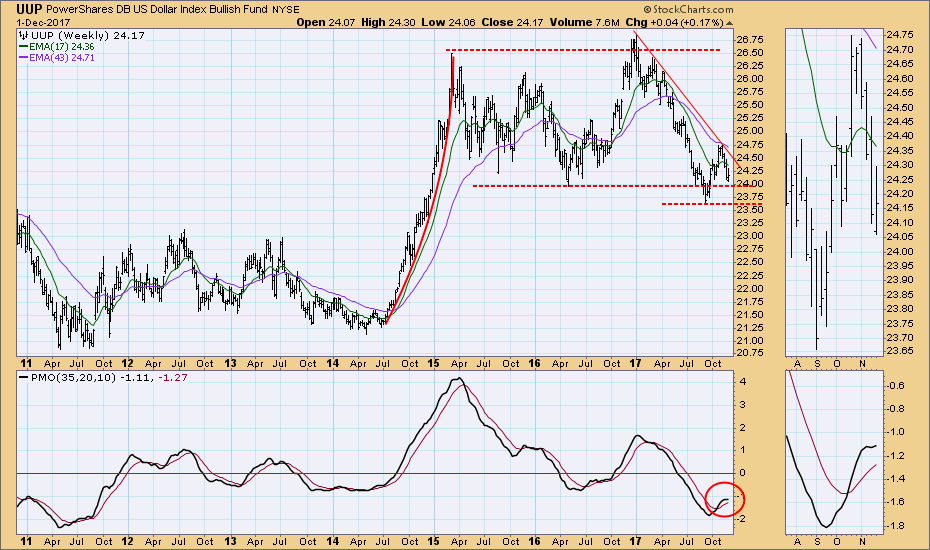
Weekly Chart: The broader picture shows UUP approaching a line of support drawn across the 2016 low, and the 2017 low provides another level of support. The weekly PMO is being indecisive.
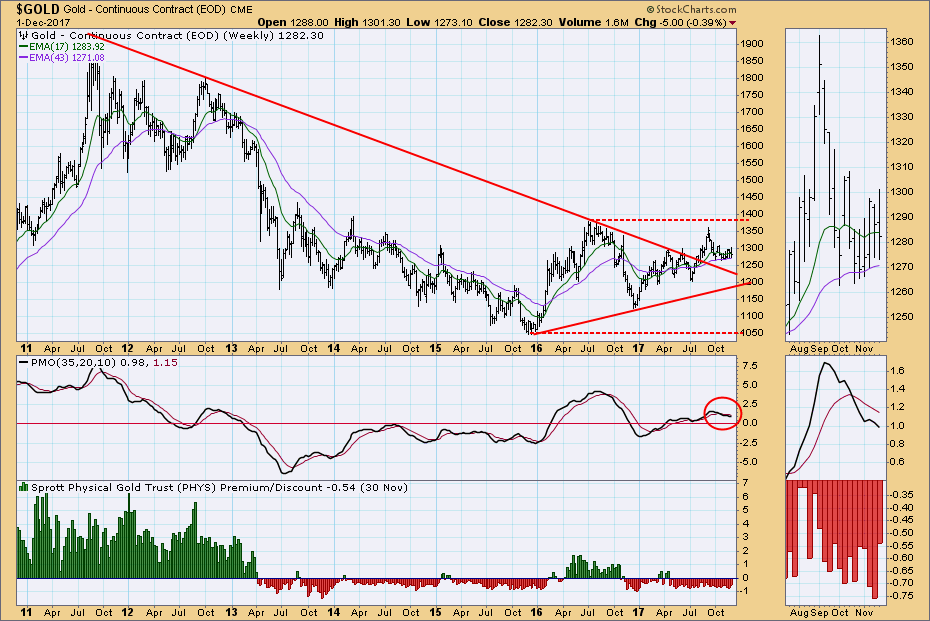
GOLD
IT Trend Model: NEUTRAL as of 10/20/2017
LT Trend Model: BUY as of 4/12/2017
Daily Chart: Gold came close to generating a new IT Trend Model BUY signal this week, but the 20EMA turned down just below the 50EMA. The daily PMO has topped, and sentiment remains bearish. Price is approaching the intersection of horizontal support and the rising trend line drawn from the December 2016 low, so maybe support will hold and upward movement resume.
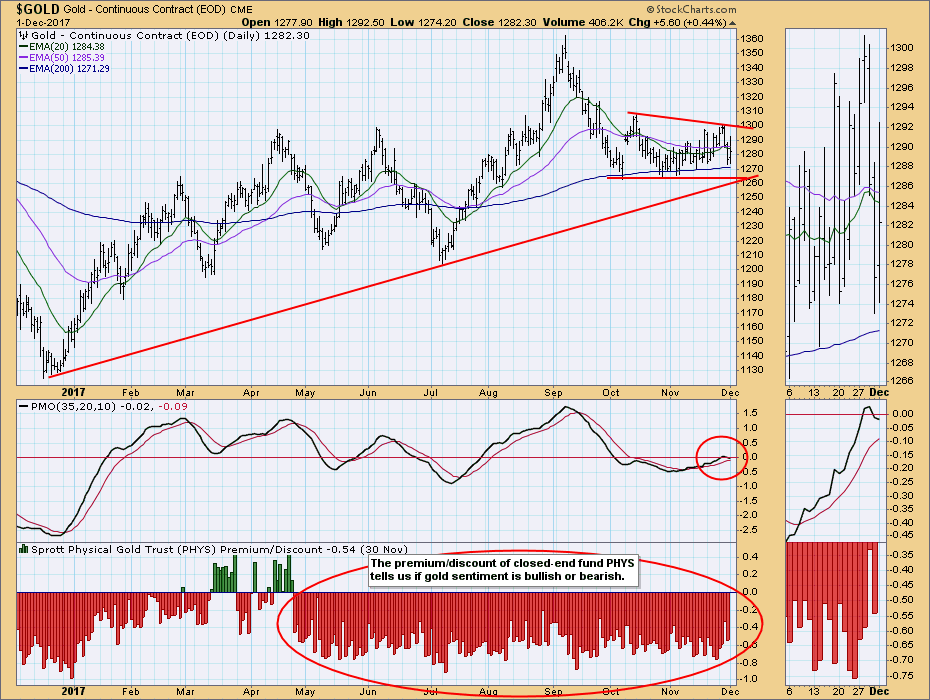
Weekly Chart: The weekly PMO is below the signal line and falling. Gold price remains slightly positive, but it starting to move sideways.
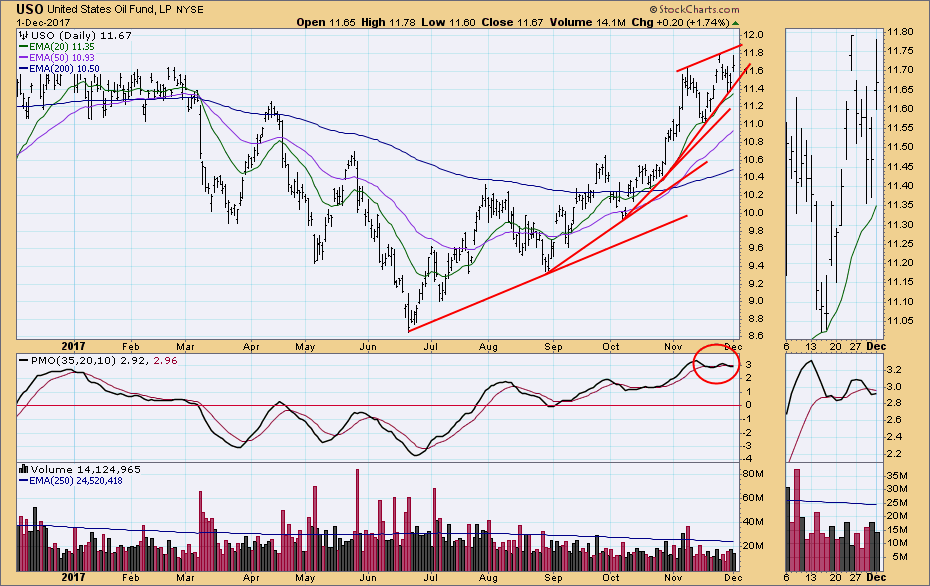
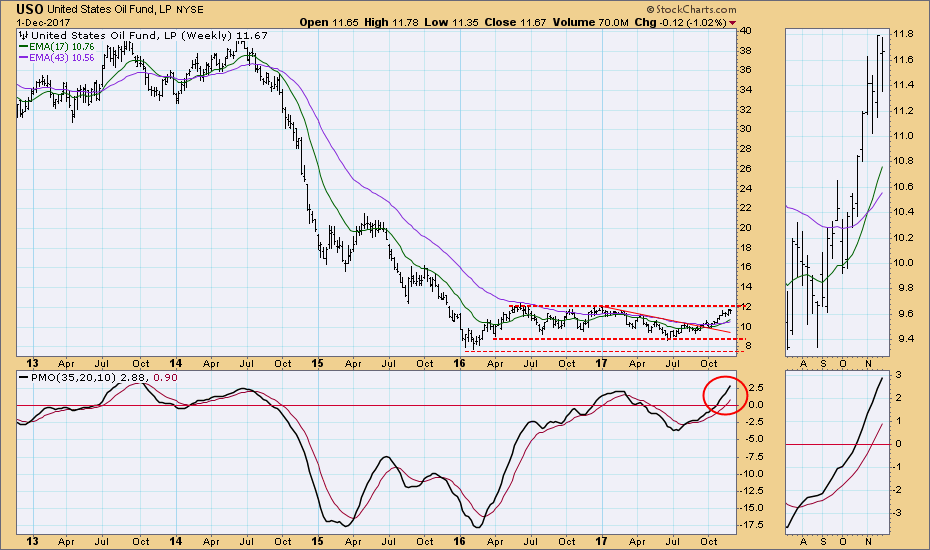
CRUDE OIL (USO)
IT Trend Model: BUY as of 9/6/2017
LT Trend Model: BUY as of 11/2/2017
Daily Chart: Ever-accelerating rising trend lines, and the formation of a rising wedge pattern make me think that we will be seeing a price pullback very soon.
Weekly Chart: USO is approaching the top of the trading range, and the weekly PMO is very overbought. Considering the rising wedge we can see on the daily chart, I assume that price will be stopped by the overhead resistance and will turn down.
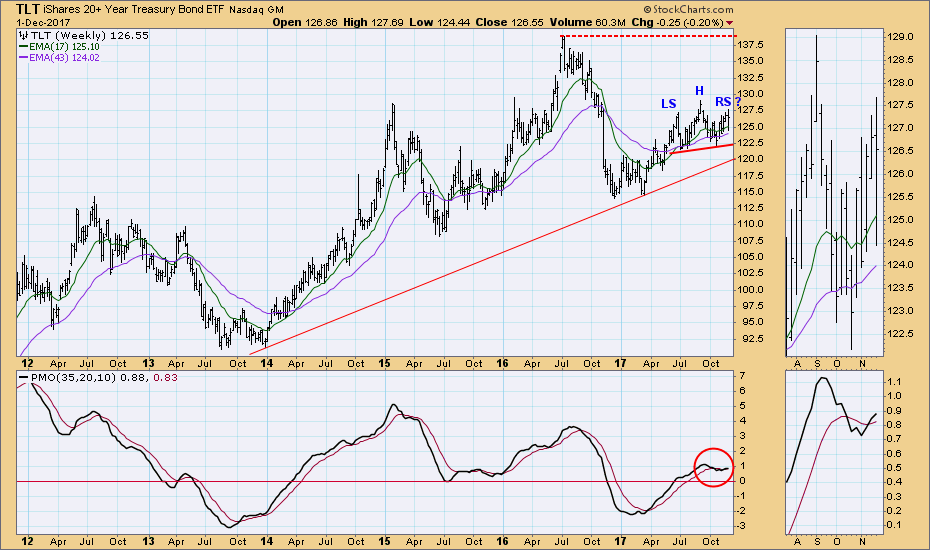
BONDS (TLT)
IT Trend Model: BUY as of 11/8/2017
LT Trend Model: BUY as of 6/16/2017
Daily Chart: The rising wedge formation fulfilled expectations by breaking down this week, but there was a quick upside reversal on Friday. I left the lower edge of the wedge in place for purposes of illustration, but it will need to be adjusted next week.
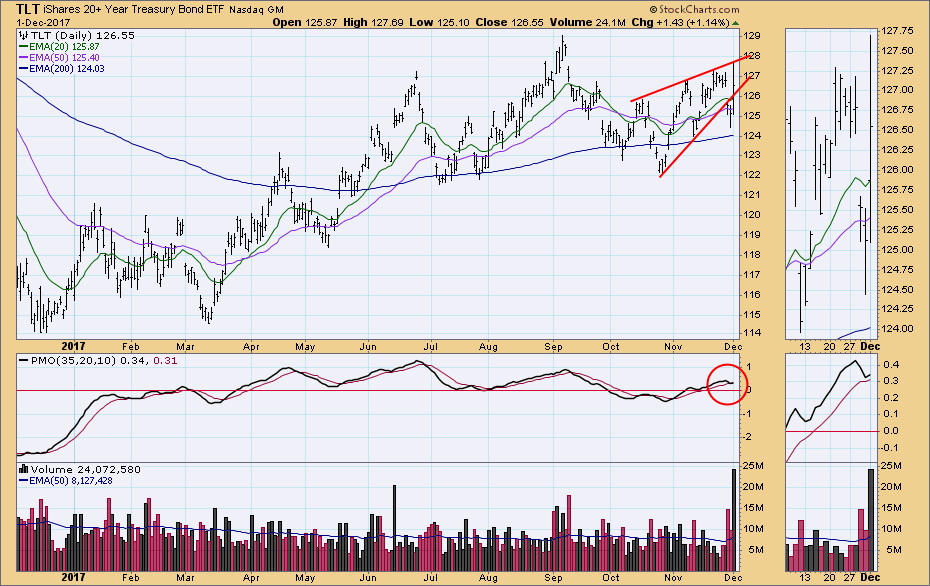
Weekly Chart: TLT still has a bearish head and shoulders pattern developing, but negative implications are undermined by the weekly PMO, which is rising above the signal line.
**Don't miss any of the DecisionPoint commentaries! Go to the "Notify Me" box toward the end of this blog page to be notified as soon as they are published.**
Technical Analysis is a windsock, not a crystal ball.
Happy Charting!
- Carl
NOTE: The signal status reported herein is based upon mechanical trading model signals, specifically, the DecisionPoint Trend Model. They define the implied bias of the price index based upon moving average relationships, but they do not necessarily call for a specific action. They are information flags that should prompt chart review. Further, they do not call for continuous buying or selling during the life of the signal. For example, a BUY signal will probably (but not necessarily) return the best results if action is taken soon after the signal is generated. Additional opportunities for buying may be found as price zigzags higher, but the trader must look for optimum entry points. Conversely, exit points to preserve gains (or minimize losses) may be evident before the model mechanically closes the signal.
Helpful DecisionPoint Links:
DecisionPoint Shared ChartList and DecisionPoint Chart Gallery
Price Momentum Oscillator (PMO)
Swenlin Trading Oscillators (STO-B and STO-V)
