 I am often asked why I use an inverted scale on my Volatility Index charts. The answer is that I find it to be an excellent overbought/oversold indicator in the short term when it's flipped. Typically it is said that if the VIX is low that is bullish for the market because there is complacency or a lack of fear of investing. I agree that in the big or slightly longer-term picture that is true. However, I think that many miss out on the 'sentiment' value of the VIX. Remember that sentiment readings are contrarian. So, if everyone is bullish, that is bearish for the market in the shorter term. In my opinion, the VIX is an outstanding sentiment indicator in the very short term and since sentiment is contrarian, I flip the scale.
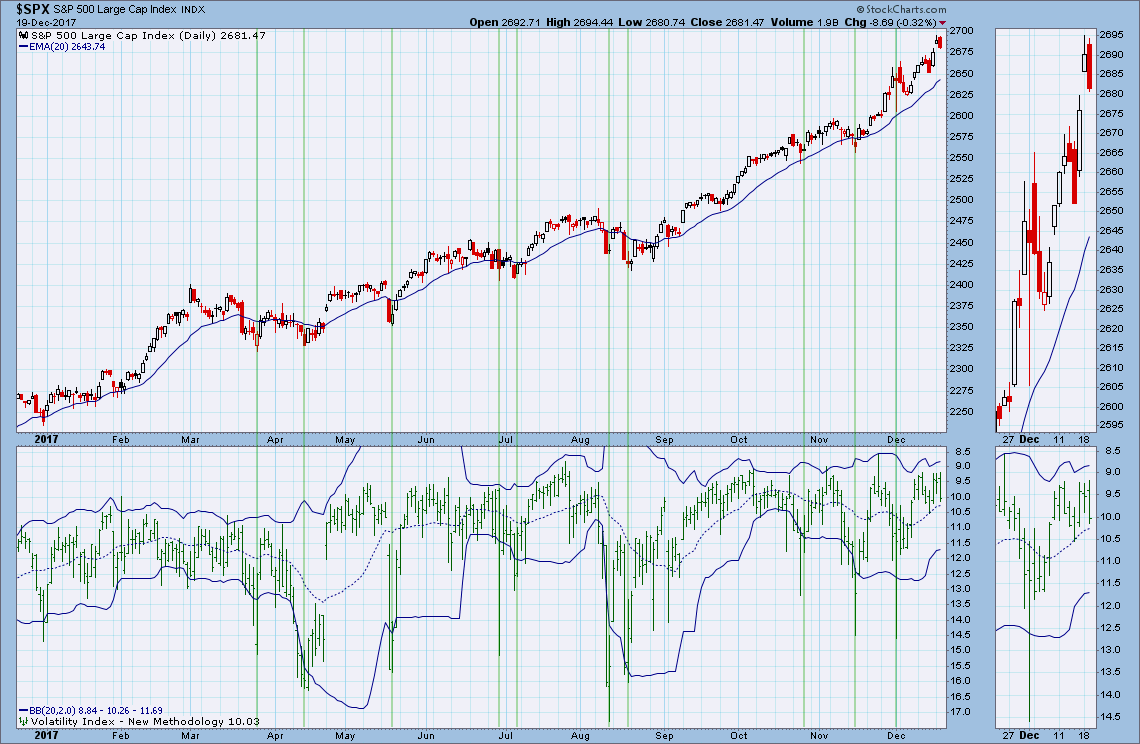
Similar to candlestick analysis, my analysis of the VIX gives me information for the next day or two. Here's the latest VIX chart for the SPX. Notice that when the VIX punctures the lower Bollinger Bands on an inverted scale, it is an oversold reading. Also notice that when we see these punctures, it is usually followed by a day or two (or more) of rally. The opposite is true for downside penetrations of the lower Bollinger Bands. Below I've annotated when VIX readings punctured the lower bands. While it isn't completely perfect, it does make a great case for using high VIX readings as an oversold, not overbought or bearish indicator.
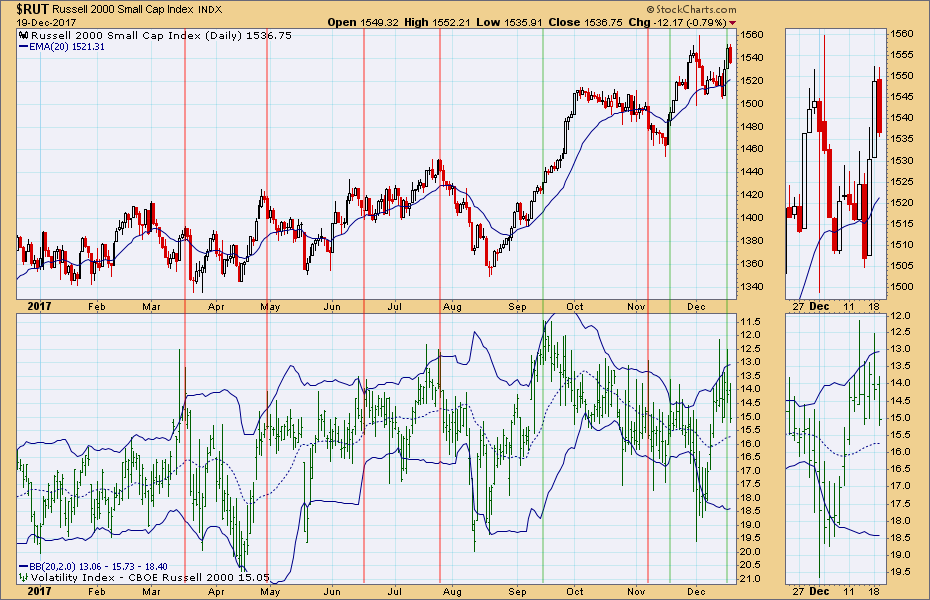
I bet you didn't know this, but StockCharts has more than just the VIX. In the DecisionPoint Market Indicator ChartPack (free!) there are also volatility indexes for the OEX ($VXO), NDX ($VXN), QQQ ($QQV), Russell 2000 ($RVX), Dow ($VXD), Gold ($GVZ) and Crude Oil ($OVX). Below is an example using the Russell 2000 overbought $RVX readings, generally lead to declines.
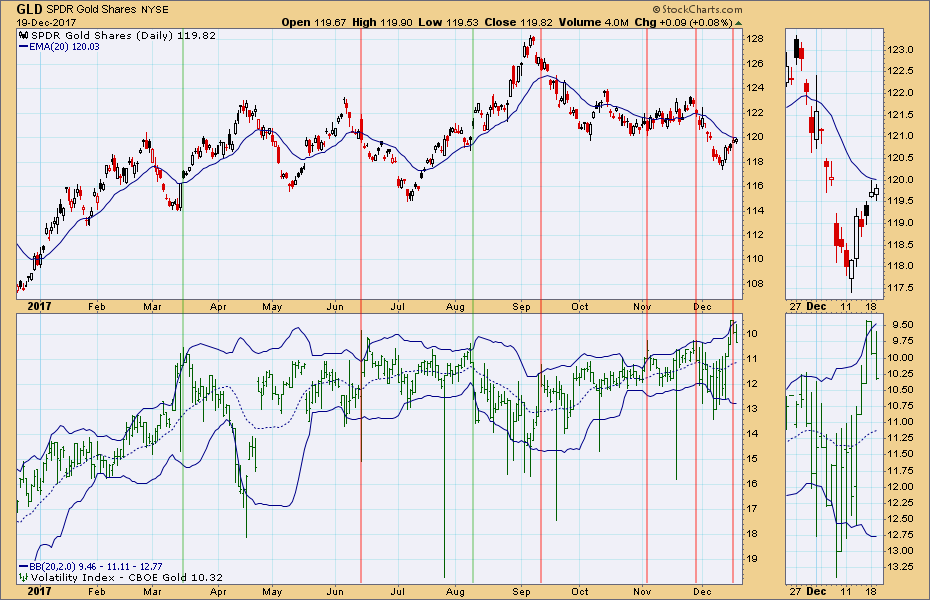
The volatility index for Gold is fascinating as well given we have just penetrated the upper Bollinger Band and notice price stopped rising today.
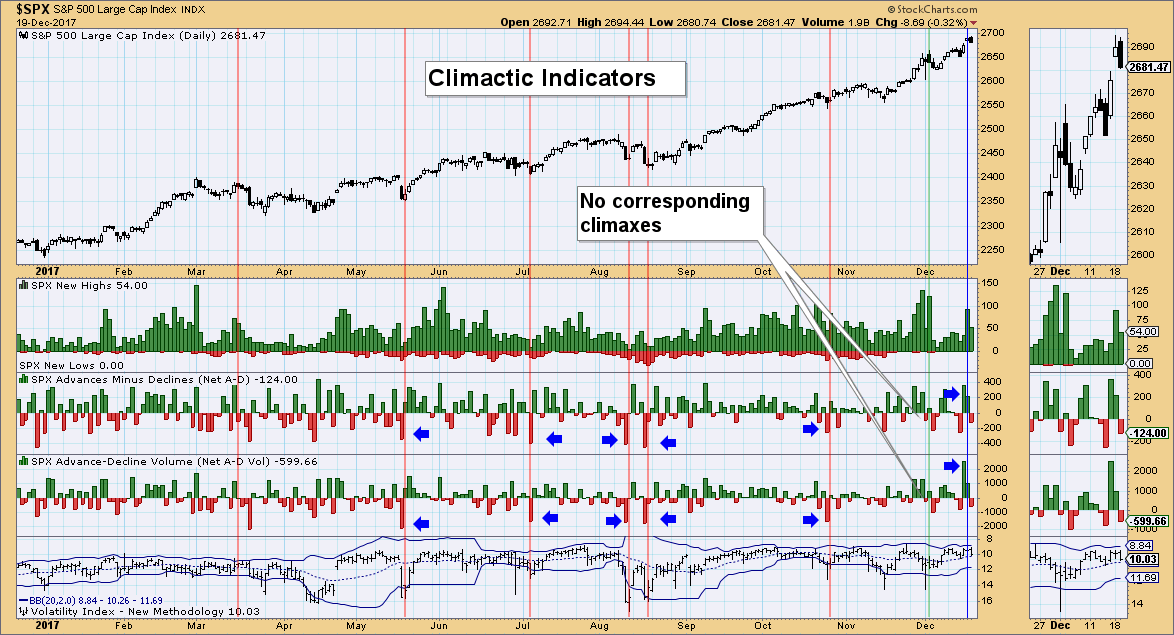
I'll reiterate...nothing is ever perfect, but using volatility in short-term analysis can be quite useful. If volatility has been saturated in one direction or the other, I have warning or confirmation on possible trading conditions. Used in conjunction with the Net Advances minus Declines for price and volume and the tool becomes a little more accurate for short-term trading/analysis. Below is the Climactic Indicators chart that most DecisionPoint fans have seen many times. I find that climactic readings on net advances/declines combined with Bollinger Band punctures make results more accurate or can be used as a confirmation tool.
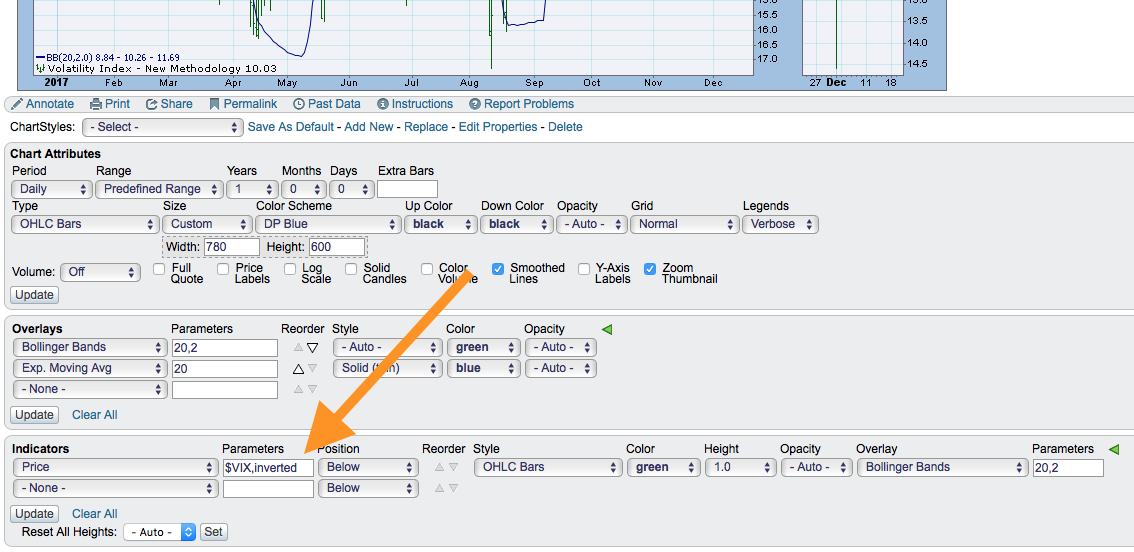
If you are a short-term trader, it isn't always easy to get an accurate temperature of the overall market in a very short-term timeframe. We all talk about trading the trend or momentum and as a very short-term trader it can be exceedingly helpful to have insight on the market conditions for the next day or two using volatility charts. The key is to invert that scale. You can do that by either clicking on my charts above and seeing how I set them up...or simply type ",inverted" after the $VIX, $RVX, etc. in the indicator window.
Helpful DecisionPoint Links:
DecisionPoint Shared ChartList and DecisionPoint Chart Gallery
Price Momentum Oscillator (PMO)
Swenlin Trading Oscillators (STO-B and STO-V)
Technical Analysis is a windsock, not a crystal ball.
Happy Charting!
- Erin
**Don't miss DecisionPoint Commentary! Add your email below to be notified of new updates"**
