
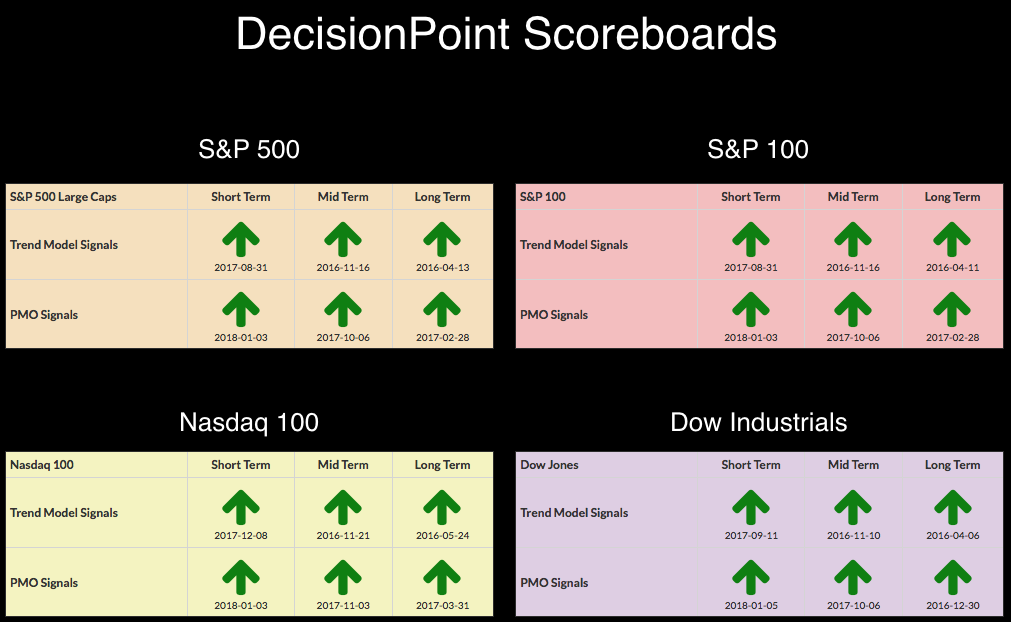
The DecisionPoint Scoreboards remain green as momentum is positive and price trends continue higher in this seemingly unending bull market rally. I'm seeing a few cracks in the pavement right now in the short-term indicators with a negative divergence between breadth and volume. USO began executing a bull flag yesterday and today it took off. I'll give you my thoughts on a potential upside target in the section on Oil below.
The purpose of the DecisionPoint Alert Daily Update is to quickly review the day's action, internal condition, and Trend Model status of the broad market (S&P 500), the nine SPDR Sectors, the U.S. Dollar, Gold, Crude Oil, and Bonds. To ensure that using this daily reference will be quick and painless, we are as brief as possible, and sometimes we let a chart speak for itself.
STOCKS
IT Trend Model: BUY as of 11/15/2016
LT Trend Model: BUY as of 4/1/2016
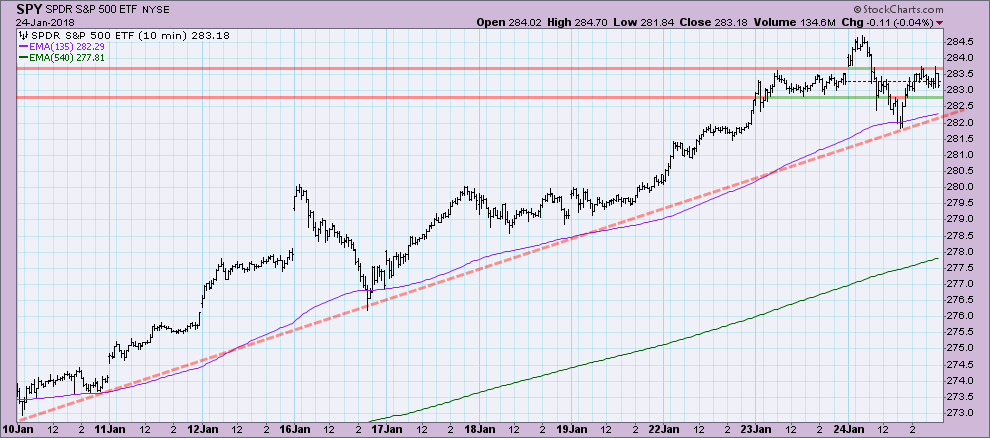
A look at the 10 minute bar chart shows that a rising bottoms trend line has remained intact over the last two weeks of trading. I've highlighted an inside trading range that will likely provide support as this rising trend continues. If we see a bit of a pullback, I suspect the rising bottoms trendline will hold.
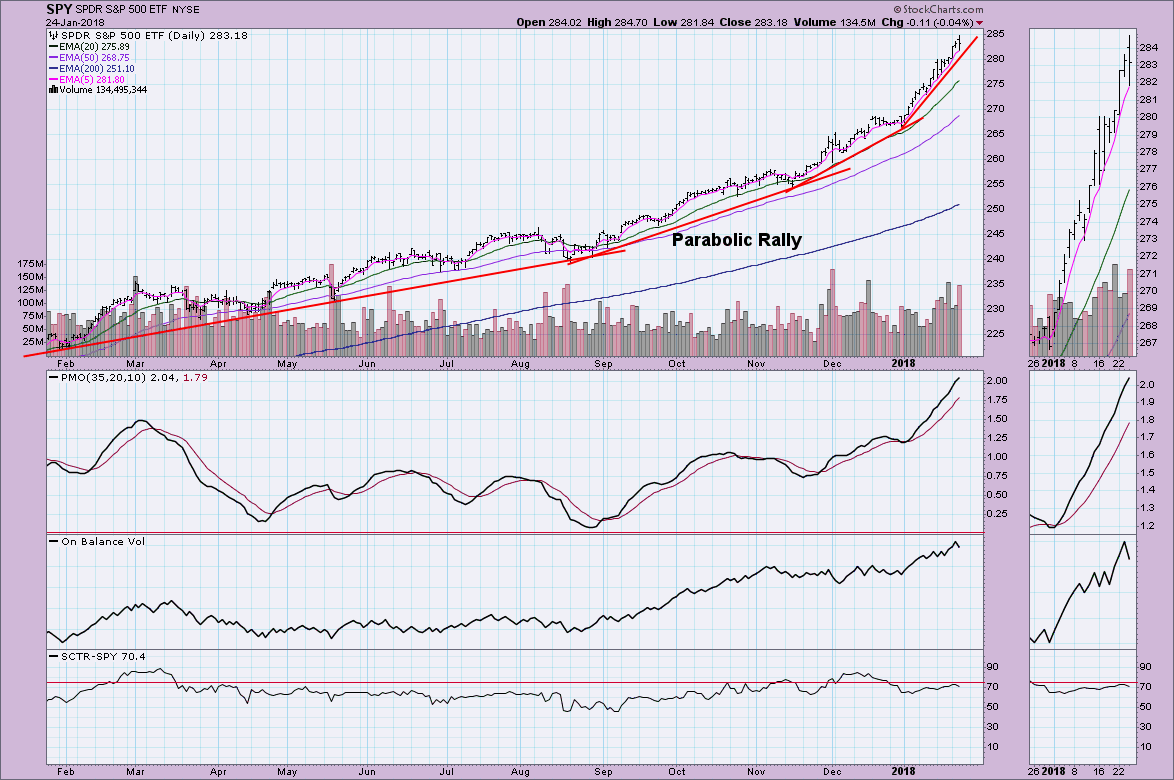
The parabolic rally continues, although we are seeing the current the rising bottoms trendline through January hasn't increased its angle of ascent. Normally I would say that maintaining this angle of ascent would be difficult, but its held up for almost a month now. The PMO is now officially "overbought" as the normal range is between +2 and -2. It has the ability to stretch in unusual market conditions and I would say this is one of those times.
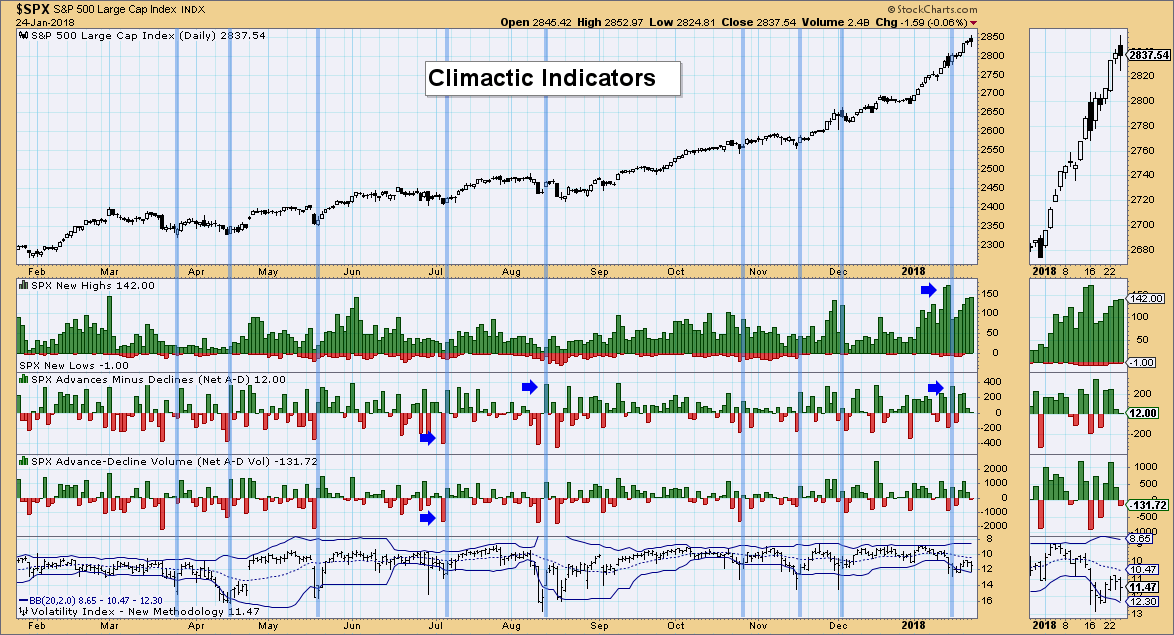
Climactic Indicators:
I noted at the end of the MarketWatchers LIVE broadcast that the VIX was reaching a high that would push it outside the Bollinger Band. The VIX stayed within the band and there are no accompanying spikes in breadth, so I would read this as somewhat bullish for the rest of the week.
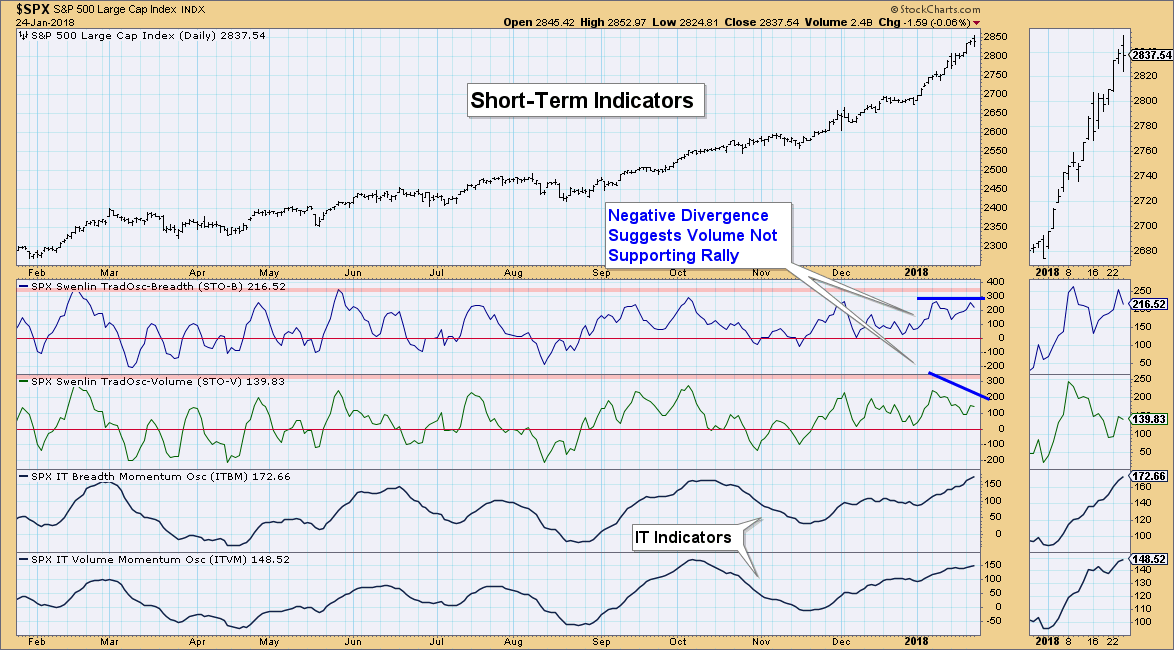
Short-Term Indicators:
I wrote about the near-term divergence I saw over the last week, but that has righted itself. However, with both of these indicators turning down today we have a negative divergence between the tops. The STO-B's latest top is about equal to its previous, but the STO-V is nowhere near its previous top. This tells us that volume may not be behind this current rally. Additionally, seeing them both turn down is bearish for the short term.
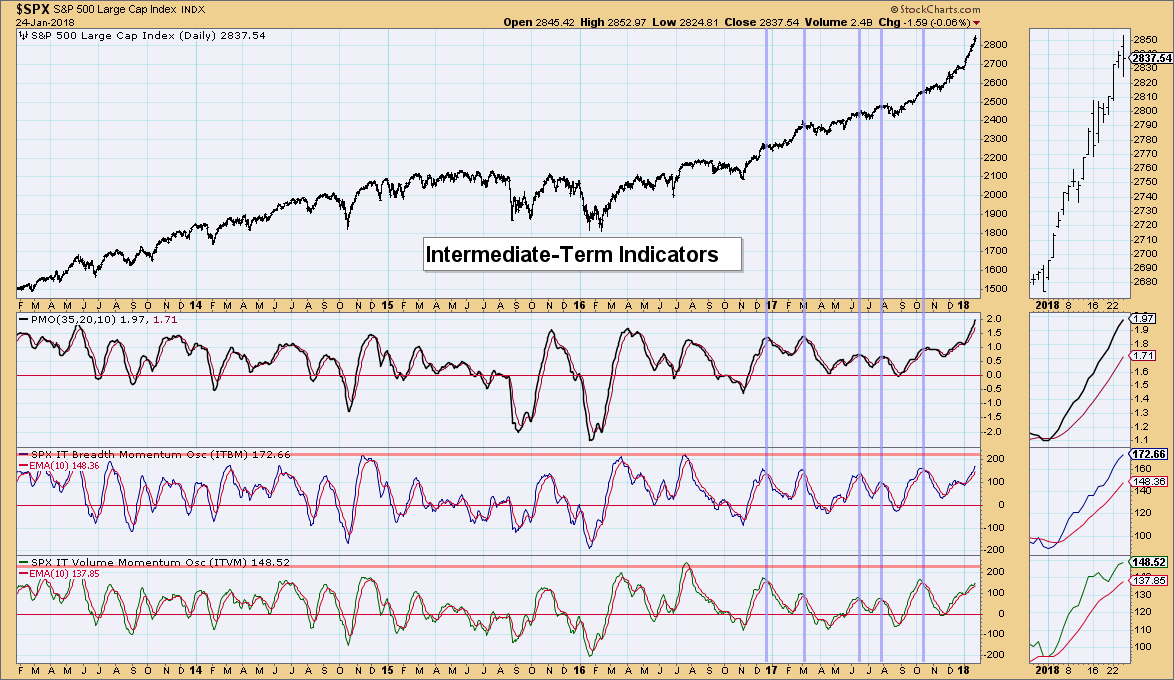
Intermediate-Term Indicators:
These indicators remain bullish albeit overbought. They haven't hit extremes for the year, but they're getting very close. For now I would say they are bullish in the intermediate term.
Conclusion:
Overall the market still looks healthy with all four Scoreboards filled with green and rising IT indicators. However, some caution is warranted given the negative divergence between the STOs and very overbought IT indicators.
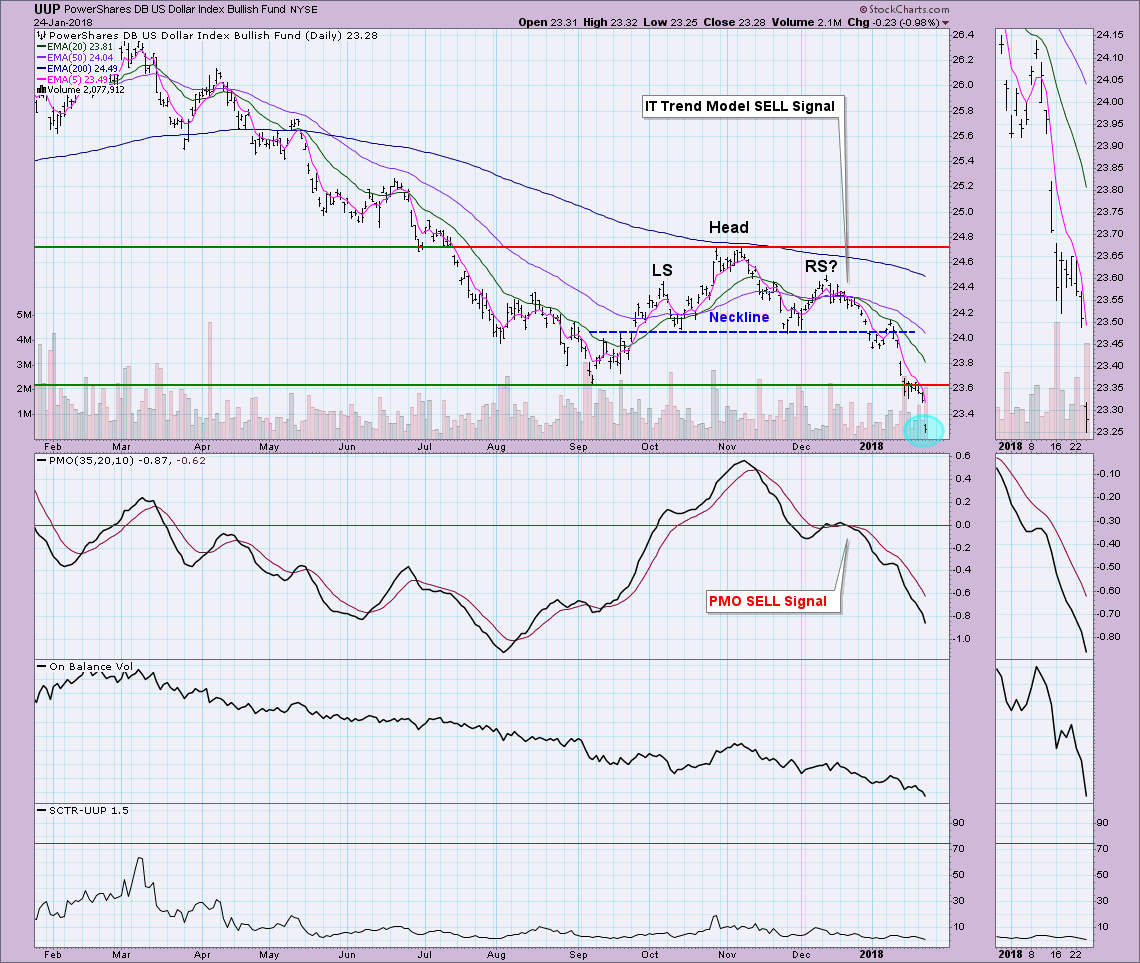
DOLLAR
IT Trend Model: SELL as of 12/21/2017
LT Trend Model: SELL as of 05/24/2017
It took me a minute to find today's OHLC bar so I decided to highlight for you. The minimum downside target of the head and shoulders formation has been captured and then some with today's gap lower. It's not a 'final' target though, it is a 'minimum' downside target and looking at this ugly chart, I'd say more downside is likely.
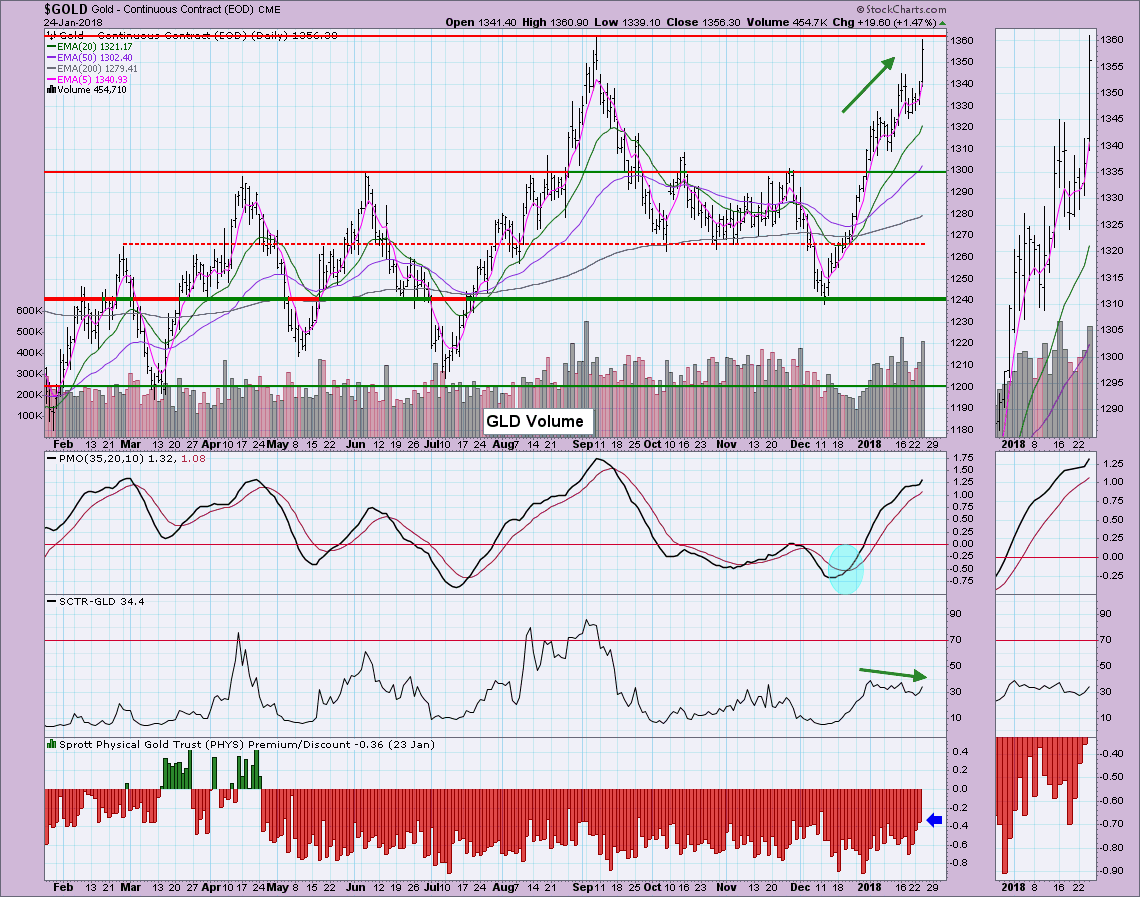
GOLD
IT Trend Model: BUY as of 1/2/2018
LT Trend Model: BUY as of 4/12/2017
Terrific breakout on Gold today! It nearly reached my target of $1360. Given the lower discount on PHYS, I would say Gold is prime for a pullback. After that, I expect price to move to the $1400 level.
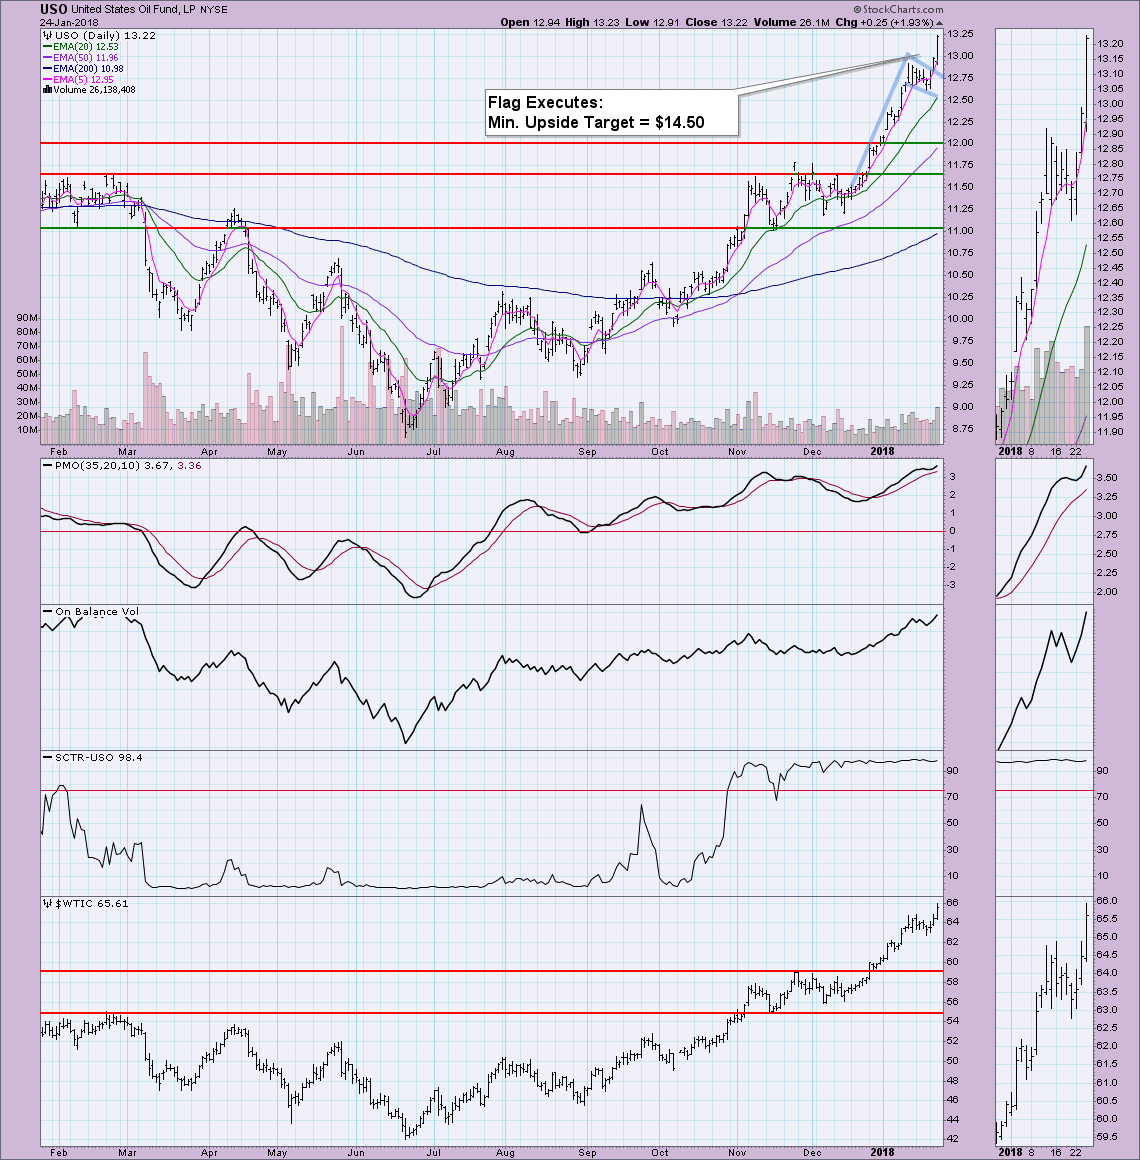
CRUDE OIL (USO)
IT Trend Model: BUY as of 11/2/2017
LT Trend Model: BUY as of 9/7/2017
During the "DecisionPoint Report" Monday on MarketWatchers LIVE, I pointed out the flag formation that was setting up on USO. Yesterday saw a small breakout from the flag and today price took off. To calculate the minimum upside target for a bull flag, take the length of the flagpole and add it to the breakout zone. Based on this calculation, I would look for an upside target around $14.50. The PMO is very overbought, but it aborted a negative crossover when it executed the flag, so it could stretch out further. If you jump on board, I'd set a stop around $12.85. We could see a pullback after this breakout so lining up a stop just below the top of the flag could work out. (Disclosure: I don't own USO nor plan to)
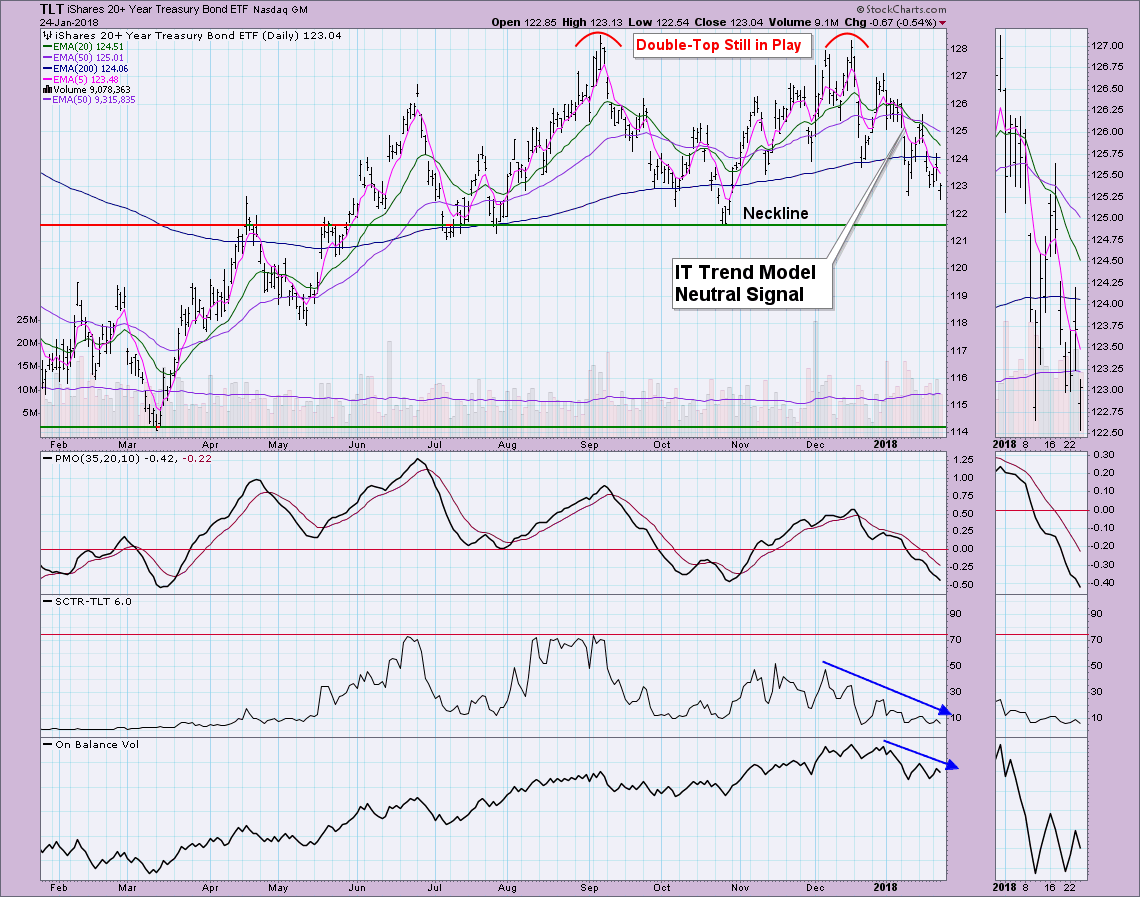
BONDS (TLT)
IT Trend Model: Neutral as of 1/11/2018
LT Trend Model: BUY as of 6/16/2017
The only hope for TLT right now is holding support at the neckline. The PMO is now oversold and could be signaling an end to the decline, but it hasn't decelerated so I doubt that support will hold. Using the pattern calculation, if the double-top executes, the minimum downside target is $114 and that lines up perfectly with the March low.
Technical Analysis is a windsock, not a crystal ball.
Happy Charting!
Erin
Helpful DecisionPoint Links:
DecisionPoint Shared ChartList and DecisionPoint Chart Gallery
Price Momentum Oscillator (PMO)
Swenlin Trading Oscillators (STO-B and STO-V)
**Don't miss DecisionPoint Commentary! Add your email below to be notified of new updates"**
