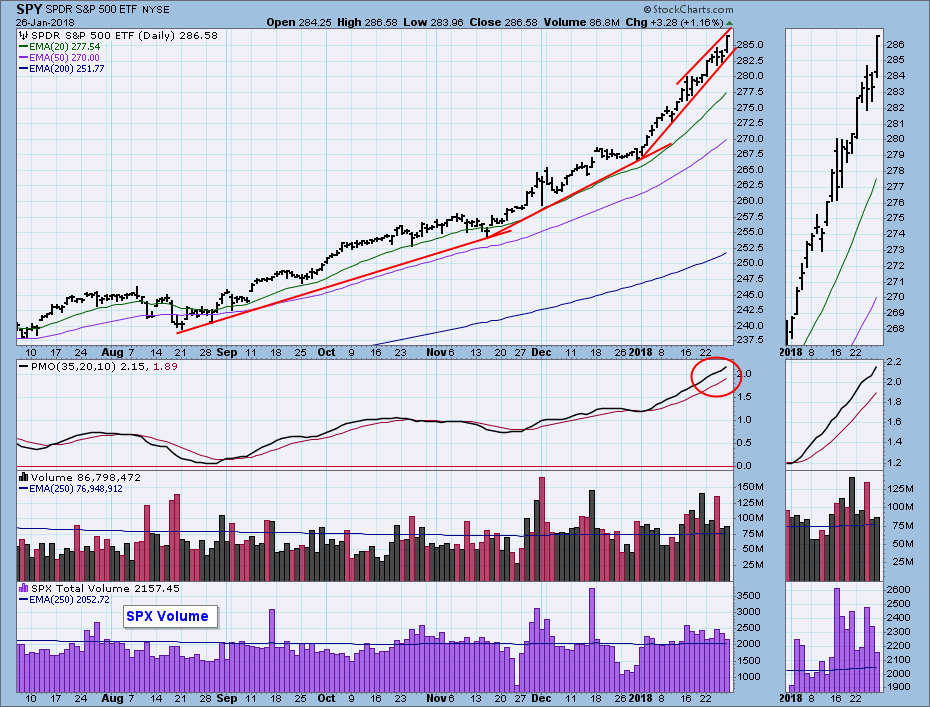
This week the market underwent a horrifying intraday reversal. Just kidding. There was a surprising reversal on Wednesday, but by the close SPY was virtually unchanged. We can see on the chart that at the intraday low the steep January rising trend line was barely tested. And in the context of January's advance it is as if nothing dramatic happened at all. Which, I guess, it didn't.
The DecisionPoint Weekly Wrap presents an end-of-week assessment of the trend and condition of the stock market (S&P 500), the U.S. Dollar, Gold, Crude Oil, and Bonds.
STOCKS
IT Trend Model: BUY as of 11/15/2016
LT Trend Model: BUY as of 4/1/2016
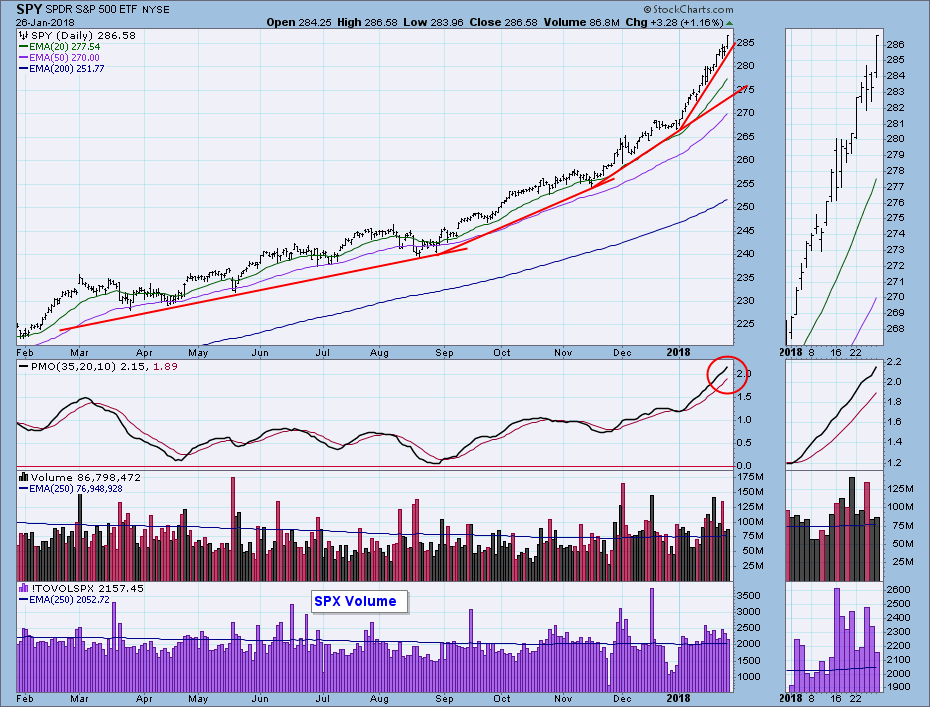
Daily Chart: The dominant feature on this chart is the series rising trend lines with ever-increasing angles of ascent. During Wednesday's reversal I never got the feeling that we were on the cusp of a substantial pullback, and that is because the market has conditioned me to respond in that way. I sit here wondering if an even steeper trend line will soon materialize. The daily PMO is very overbought, but it shows no sign of faltering. You'll notice that I extended the previous rising trend line, because that would be the first logical target for a pullback. It is the equivalent of about 2750 on the S&P 500.
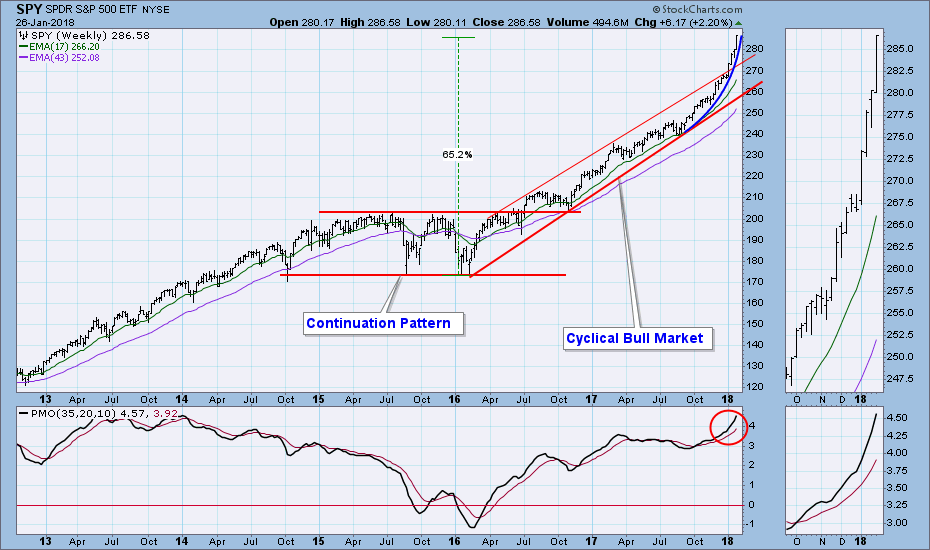
 Weekly Chart: Price has zoomed out of the cyclical bull market rising trend channel. There are no longer any visible technical restraints on the advance. Okay, there's gravity.
Short-Term Market Indicators: I'm still not getting much help from this chart.
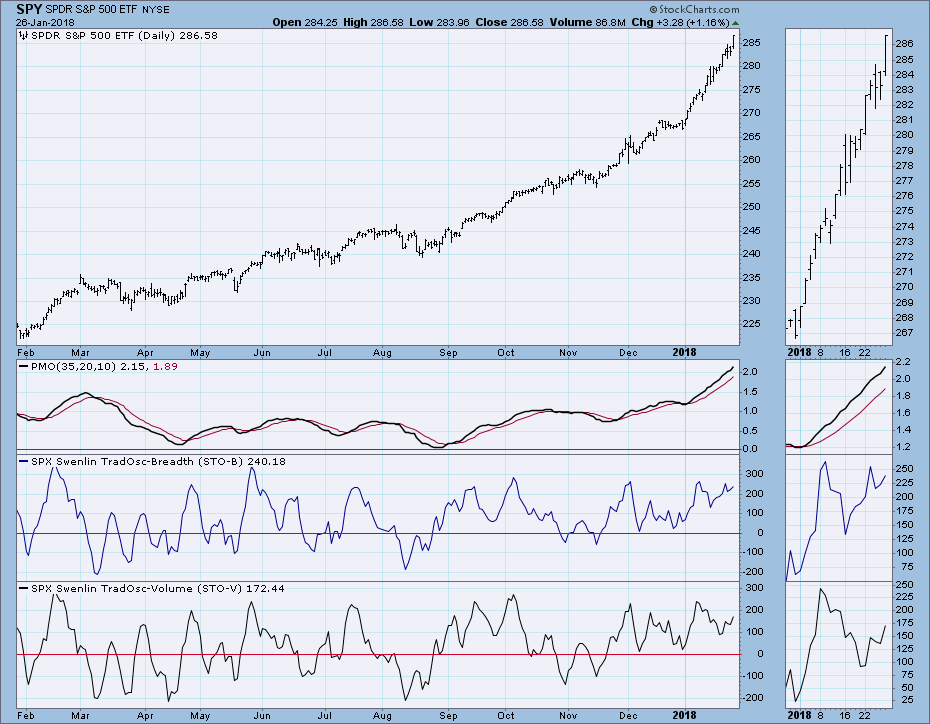
Intermediate-Term Market Indicators: We can see that the market is very overbought internally and externally (price).
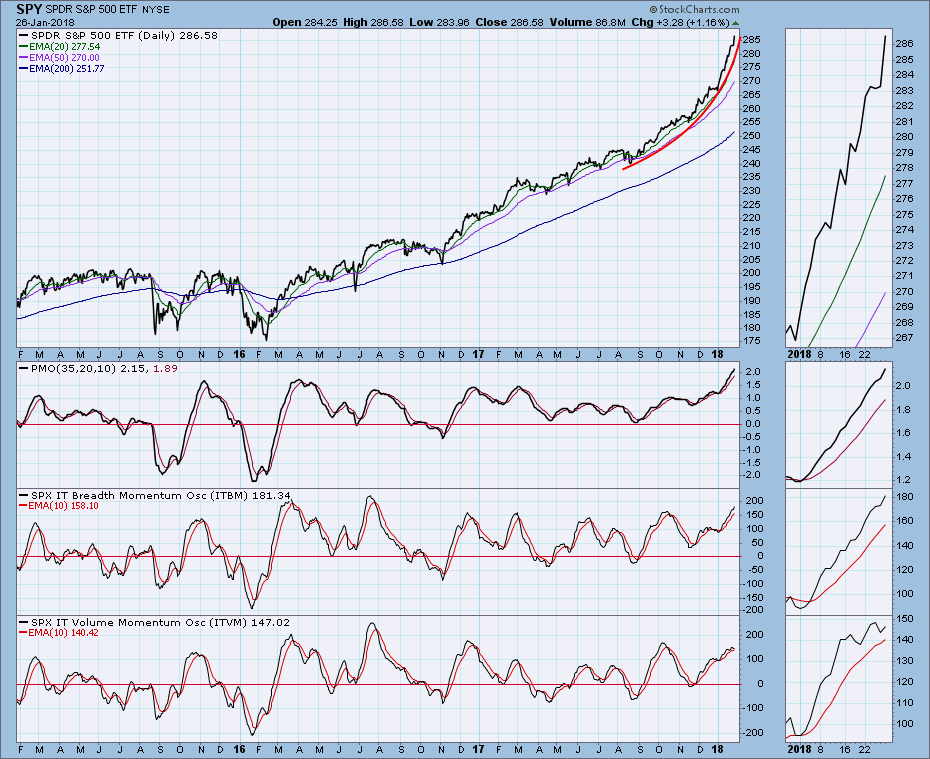
Conclusion: In my opinion, the most useful chart at this point is the one just above. Indicators are very overbought, and price is nearly vertical. If there was ever a setup for a market top, this certainly qualifies. I am not saying the top is going to happen tomorrow, but I think it is getting close. I'm not saying that the next top will mark the end of the bull market, but the decline could be more energetic than that to which we have become accustomed in the last year. A reasonable downside target would be back down to the top of the rising trend channel shown on the weekly chart. For the S&P 500 that would be a decline back to about 2700. To clarify, I am not calling a top here, and I don't know when the advance is going to turn in to a pullback. But I think it is appropriate to have in mind an exit strategy that fits your trading style.
DOLLAR (UUP)
IT Trend Model: SELL as of 12/21/2017
LT Trend Model: SELL as of 5/24/2017
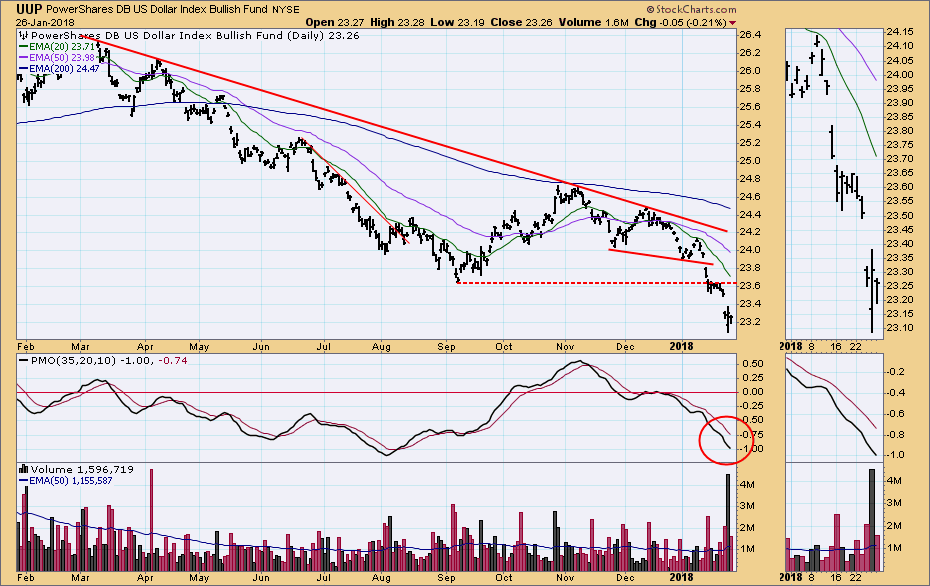
Daily Chart: Last week UUP dropped below the support line drawn from the September low. It consolidated there, forming a small flag. This week it gapped down again, fulfilling the reverse flag projection. As expected, the breakdown of the dollar has benefited commodities, gold and crude in particular, as you will see below.
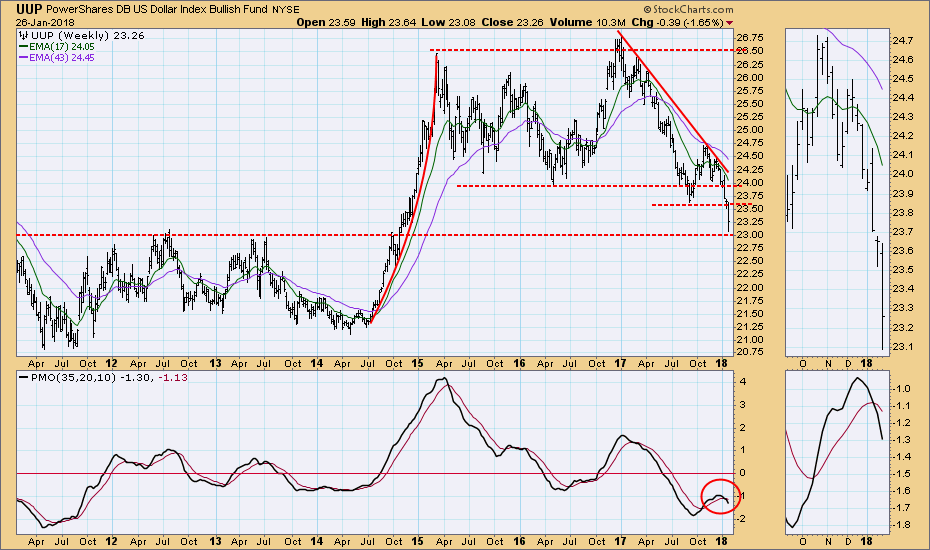
Weekly Chart: This week's breakdown is quite unambiguous, but UUP has nearly reached on another possible level of support.
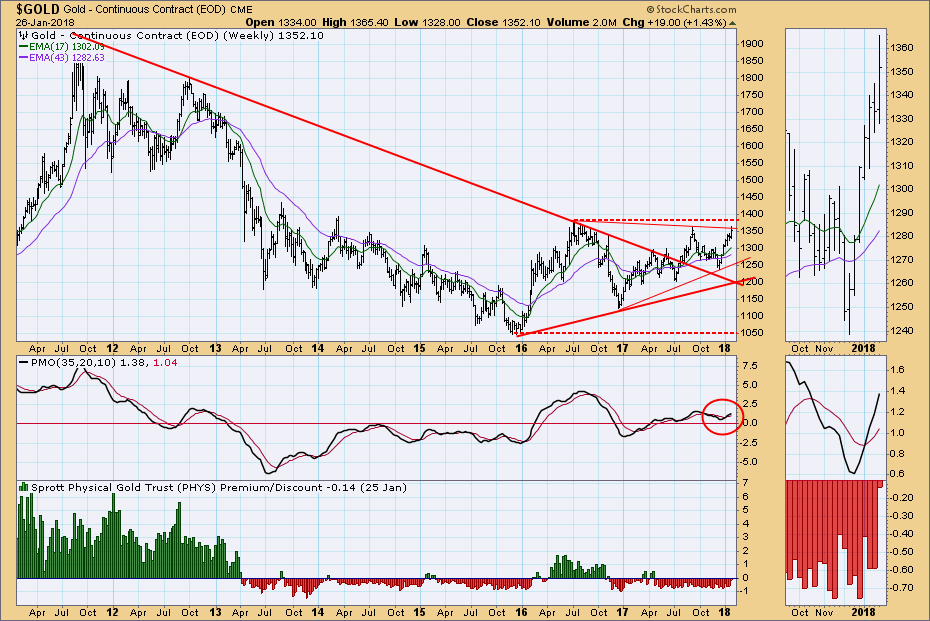
GOLD
IT Trend Model: BUY as of 1/2/2018
LT Trend Model: BUY as of 4/12/2017
Daily Chart: The rising trend line drawn from the December low is holding, but the daily PMO is overbought. Another PMO top will probably signal another pullback.
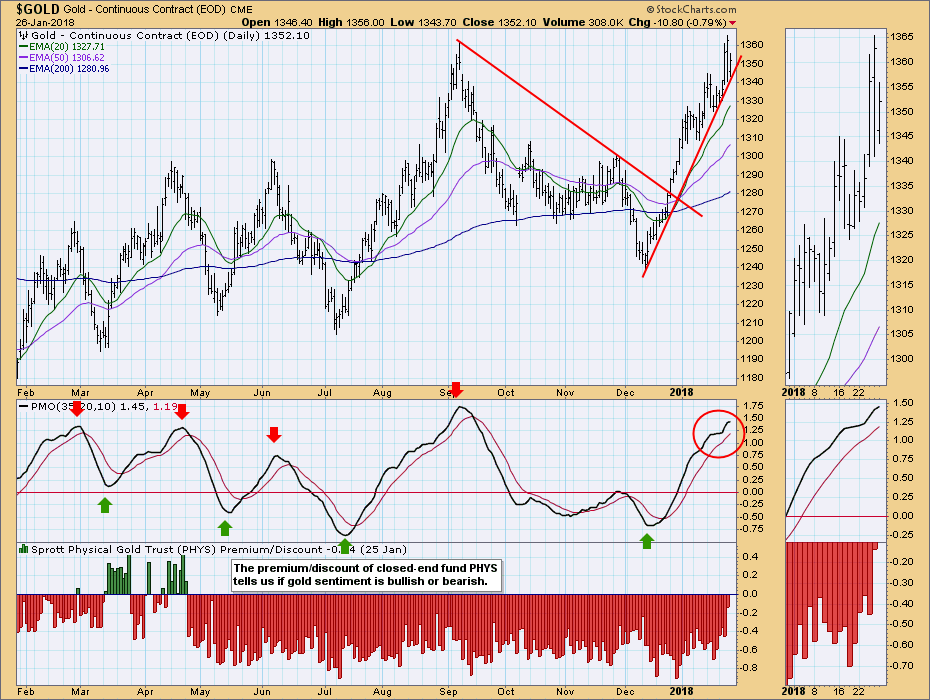
Weekly Chart: This chart is bullish, but still not wildly so. Gold is above the bear market declining trend line, but it needs to rise above the 2016 top officially be in a rising trend from the bear market low in 2015
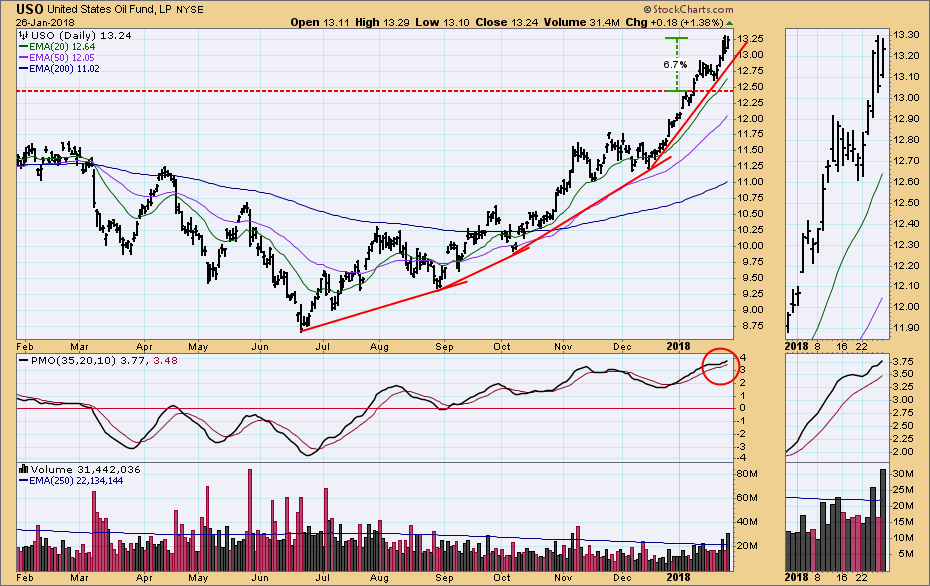
CRUDE OIL (USO)
IT Trend Model: BUY as of 9/6/2017
LT Trend Model: BUY as of 11/2/2017
Daily Chart: USO has decisively broken above the top of the long-term trading range. The daily PMO, which had topped last week, is now rising again. Definitely a bullish picture.
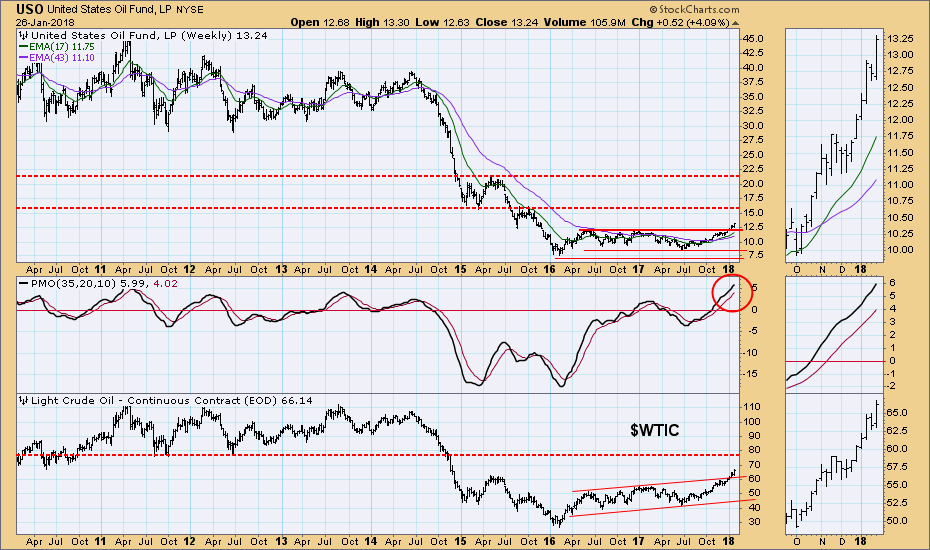
Weekly Chart: USO's weekly PMO is at its highest point in eight years, and the next resistance is well above current levels. For $WTIC I have heard projections to $80, and looking at the next resistance line, that seems reasonable.
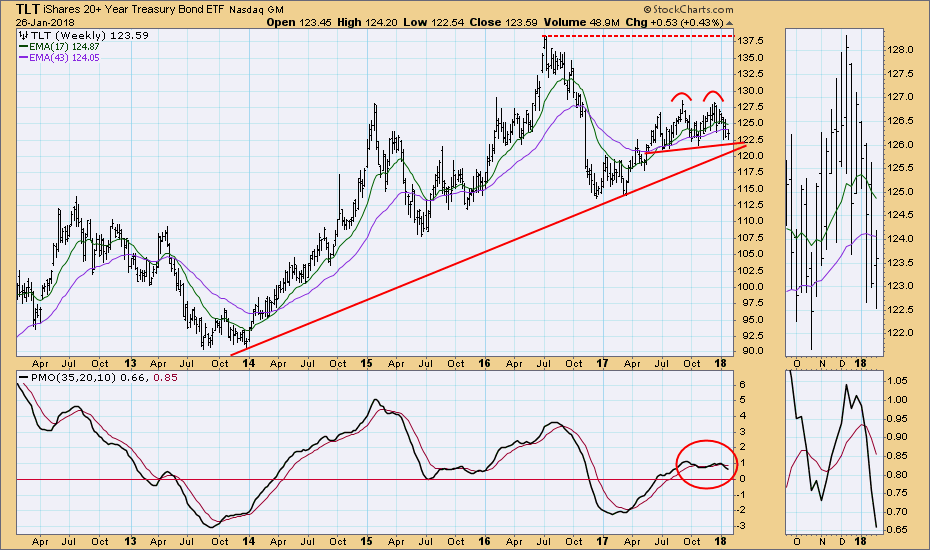
BONDS (TLT)
IT Trend Model: NEUTRAL as of 1/11/2018
LT Trend Model: BUY as of 6/16/2017
Daily Chart: The double top formation still progresses, but the daily PMO is oversold and trying to bottom. For the double top to execute, TLT must penetrate the confirmation line.
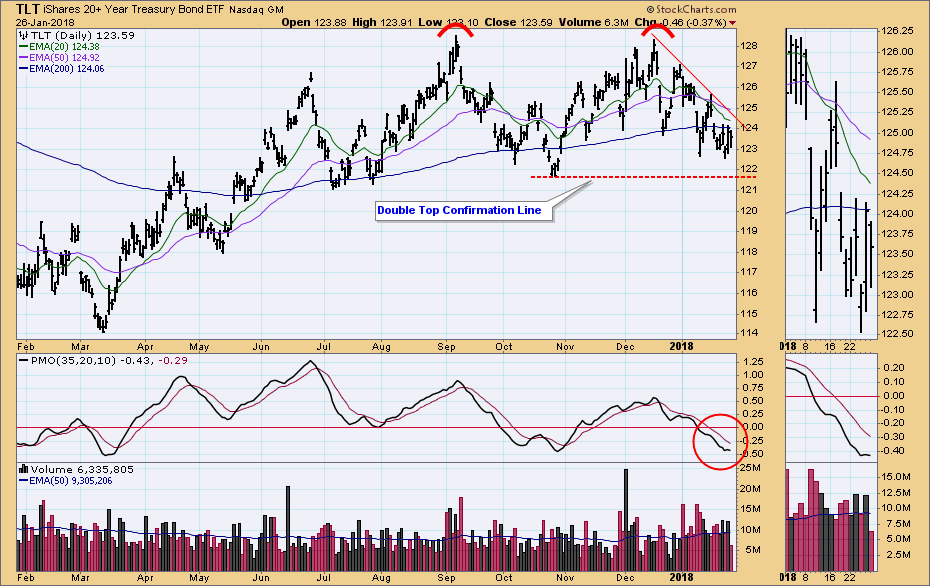
Weekly Chart: In the longer-term view we can see that TLT is approaching an area of pretty intense support, and the weekly PMO configuration has been sideways since last summer.
**Don't miss any of the DecisionPoint commentaries! Go to the "Notify Me" box toward the end of this blog page to be notified as soon as they are published.**
Technical Analysis is a windsock, not a crystal ball.
Happy Charting!
- Carl
NOTE: The signal status reported herein is based upon mechanical trading model signals, specifically, the DecisionPoint Trend Model. They define the implied bias of the price index based upon moving average relationships, but they do not necessarily call for a specific action. They are information flags that should prompt chart review. Further, they do not call for continuous buying or selling during the life of the signal. For example, a BUY signal will probably (but not necessarily) return the best results if action is taken soon after the signal is generated. Additional opportunities for buying may be found as price zigzags higher, but the trader must look for optimum entry points. Conversely, exit points to preserve gains (or minimize losses) may be evident before the model mechanically closes the signal.
Helpful DecisionPoint Links:
DecisionPoint Shared ChartList and DecisionPoint Chart Gallery
Price Momentum Oscillator (PMO)
Swenlin Trading Oscillators (STO-B and STO-V)
