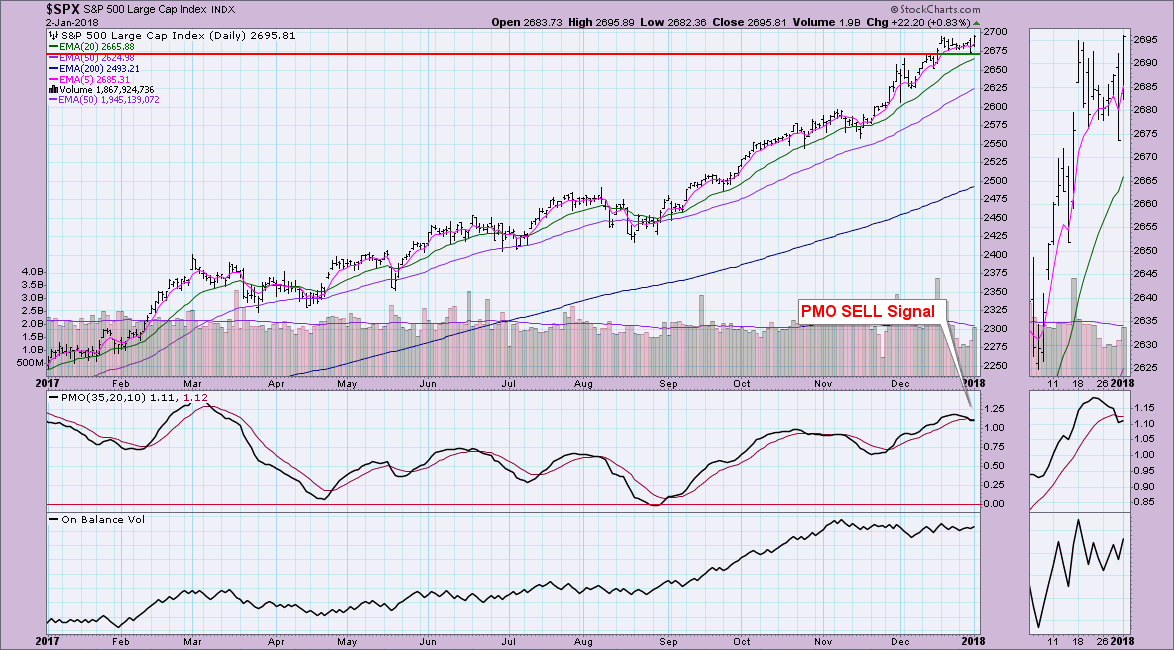
On Friday, the SPX, OEX and Dow logged new PMO SELL signals. This was a function of the market consolidating and holiday trading, but it is important to note that these signals are arriving in overbought territory for these PMOs. After today's trading, their PMOs are already decelerating in an attempt to turn around. This means we could see a reversal of these signals very soon.
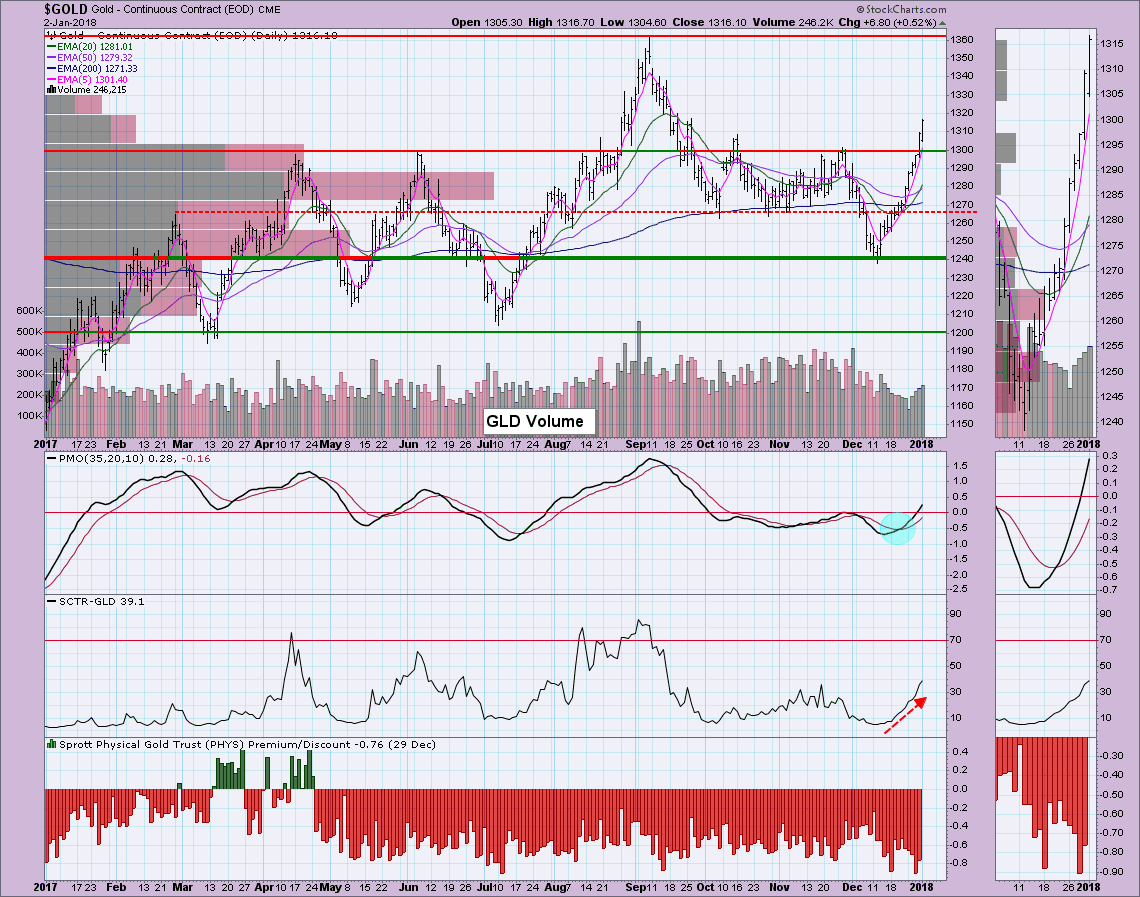
Gold has been enjoying a strong rally and today it was confirmed by the new IT Trend Model BUY signal.
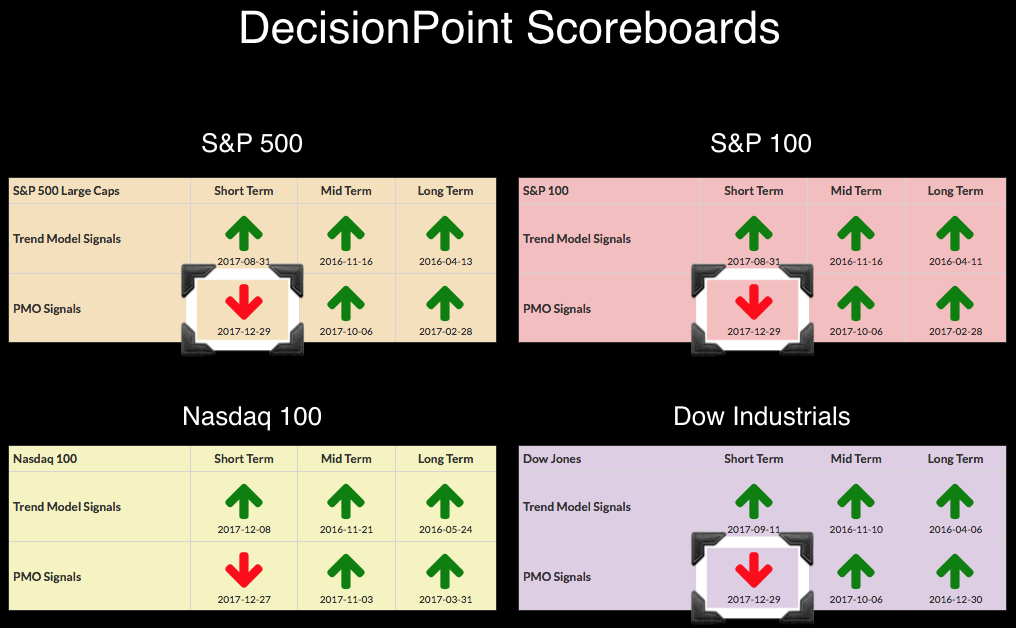
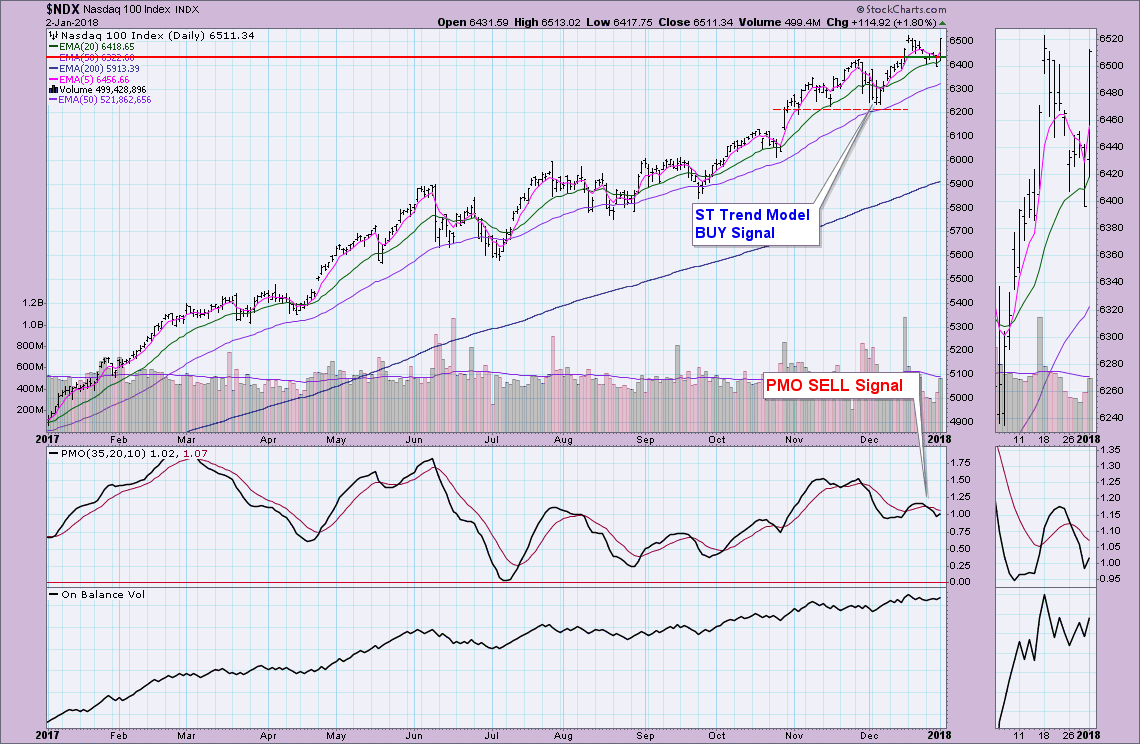
Let's first look at all four of the Scoreboard indexes. You'll note that the NDX pulled in the first PMO SELL signal, but the other three were not that far behind. The NDX PMO bottomed on today's market action and could lose its PMO SELL signal by the end of the week, if not sooner.
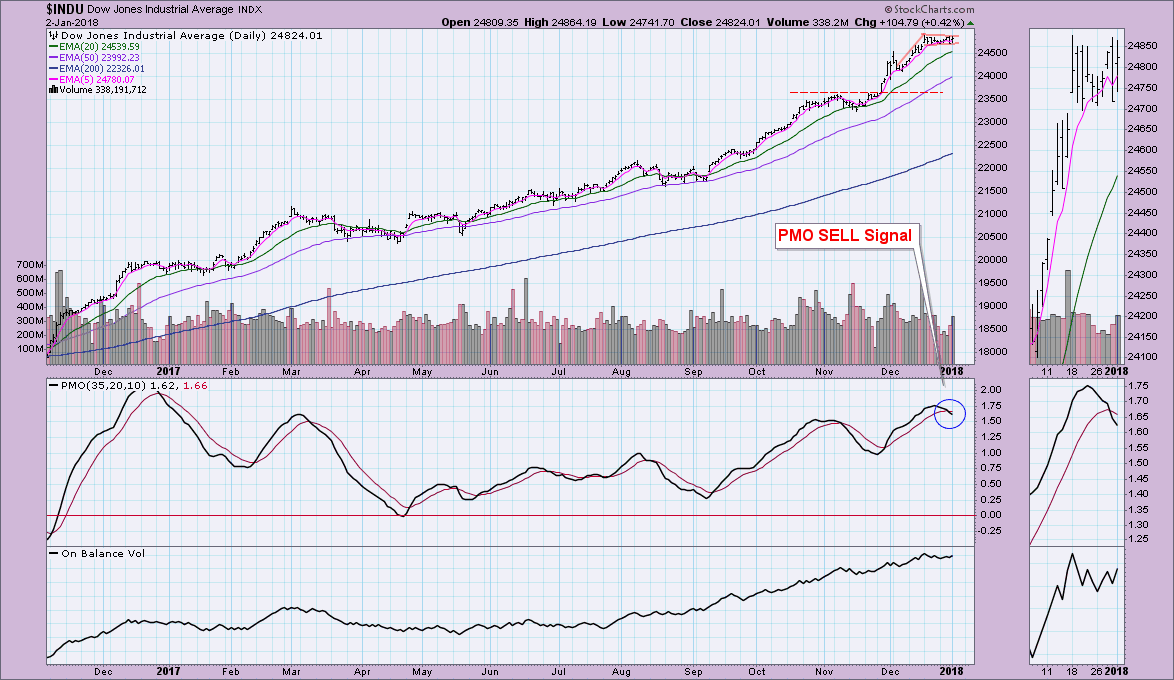
The Dow did not see the gains that the other three indexes enjoyed, but a gain of 0.42% is nothing to sneeze at. However, it wasn't enough to decelerate the PMO. You could make a case for a bull flag on the Dow right now, but looking at that overbought PMO SELL signal, I'm not counting on it executing.
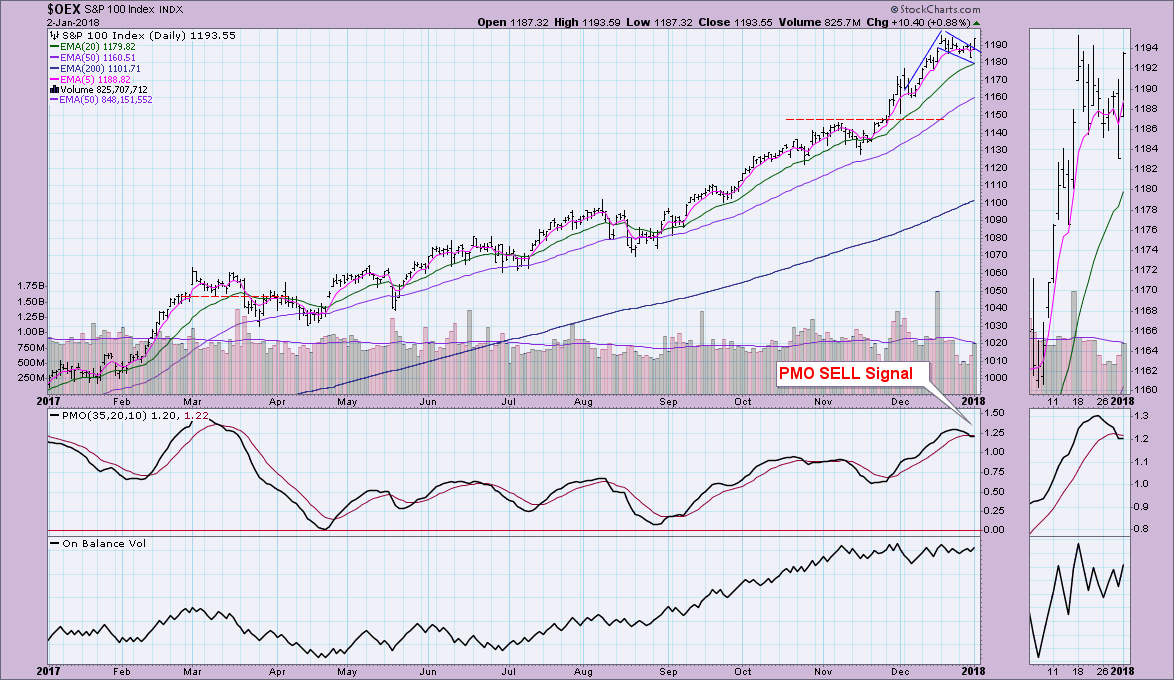
With double the gain of the Dow, the OEX is already seeing its PMO flatten. The margin between the PMO and its signal line suggests this is a whipsaw SELL signal.
The SPX is most certainly looking at a whipsaw PMO SELL signal. It logged a new all-time high today and its PMO has bottomed.
Gold has been on a tear and it doesn't appear ready to stop. With PMO SELL signals on the DP Scoreboards and the market pausing, this could turn out to be a great environment for gold bugs. The IT Trend Model BUY signal generated when the 20-EMA crossed above the 50-EMA. The chart couldn't look much more bullish. After bouncing off support at the volume by price level it has continued higher on increasing volume for GLD. I'm looking for Gold to push past the September high, but first I'd look for a pullback toward support at the April/June highs. If you want something to worry about, this rally looks rather parabolic which tells us to use some caution on entry.
Helpful DecisionPoint Links:
DecisionPoint Shared ChartList and DecisionPoint Chart Gallery
Price Momentum Oscillator (PMO)
Swenlin Trading Oscillators (STO-B and STO-V)
Technical Analysis is a windsock, not a crystal ball.
Happy Charting!
- Erin
**Don't miss DecisionPoint Commentary! Add your email below to be notified of new updates"**
