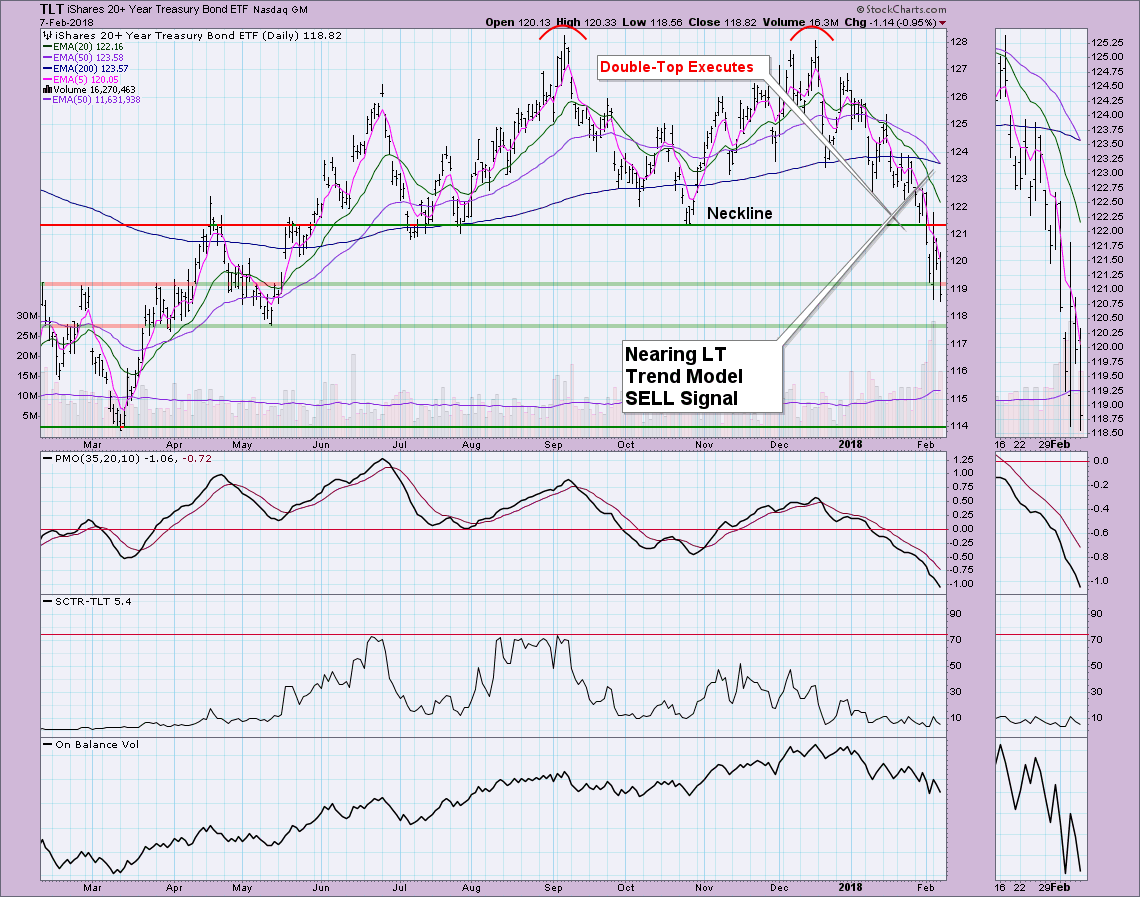
 No one can deny that this correction has been difficult and it has certainly left investors uneasy. However, the VIX is calming down somewhat and the Swenlin Trading Oscillators have bottomed. I don't think the market is completely out of the woods from an intermediate-term indicator perspective. UUP garnered a new BUY signal just as TLT nearly triggered a new LT Trend Model SELL signal. Look for that signal tomorrow.
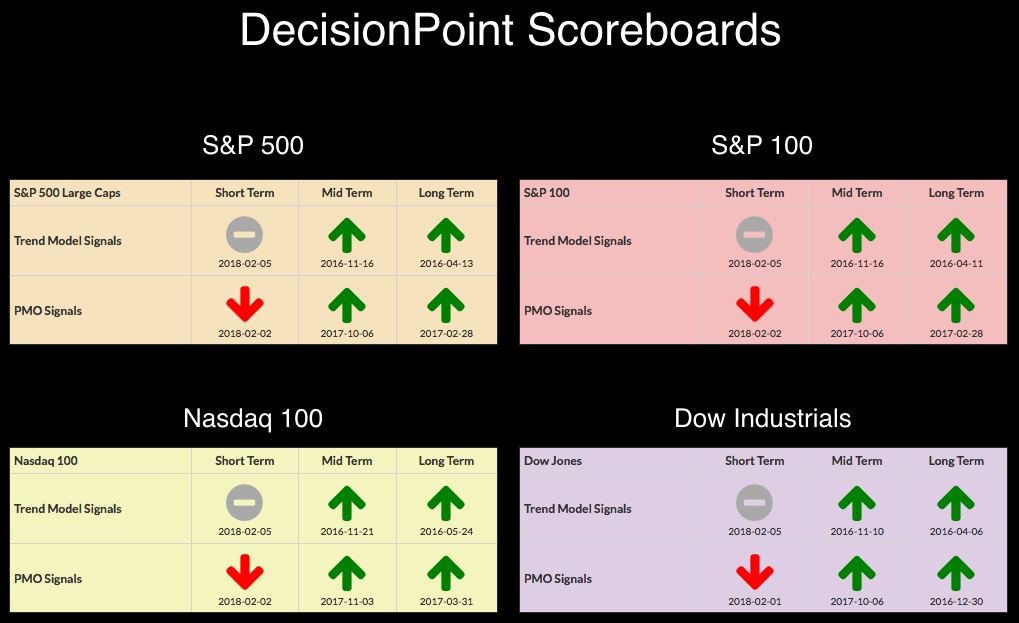
The purpose of the DecisionPoint Alert Daily Update is to quickly review the day's action, internal condition, and Trend Model status of the broad market (S&P 500), the nine SPDR Sectors, the U.S. Dollar, Gold, Crude Oil, and Bonds. To ensure that using this daily reference will be quick and painless, we are as brief as possible, and sometimes we let a chart speak for itself.
STOCKS
IT Trend Model: BUY as of 11/15/2016
LT Trend Model: BUY as of 4/1/2016
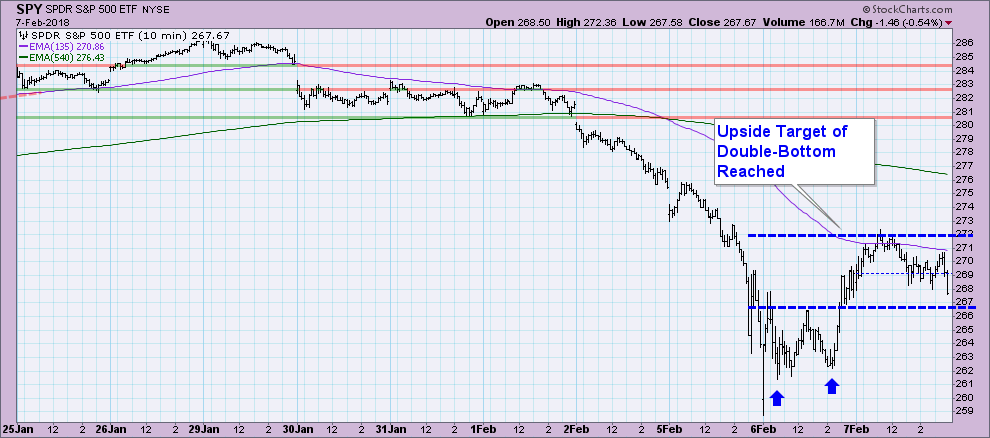
I'm somewhat concerned that we may be facing more short-term weakness given the look of the 10-minute bar chart for the SPY. Yesterday's double-bottom executed today and when price hit the minimum upside target for that pattern, it promptly was turned back. Let's see if support at the neckline can hold tomorrow.
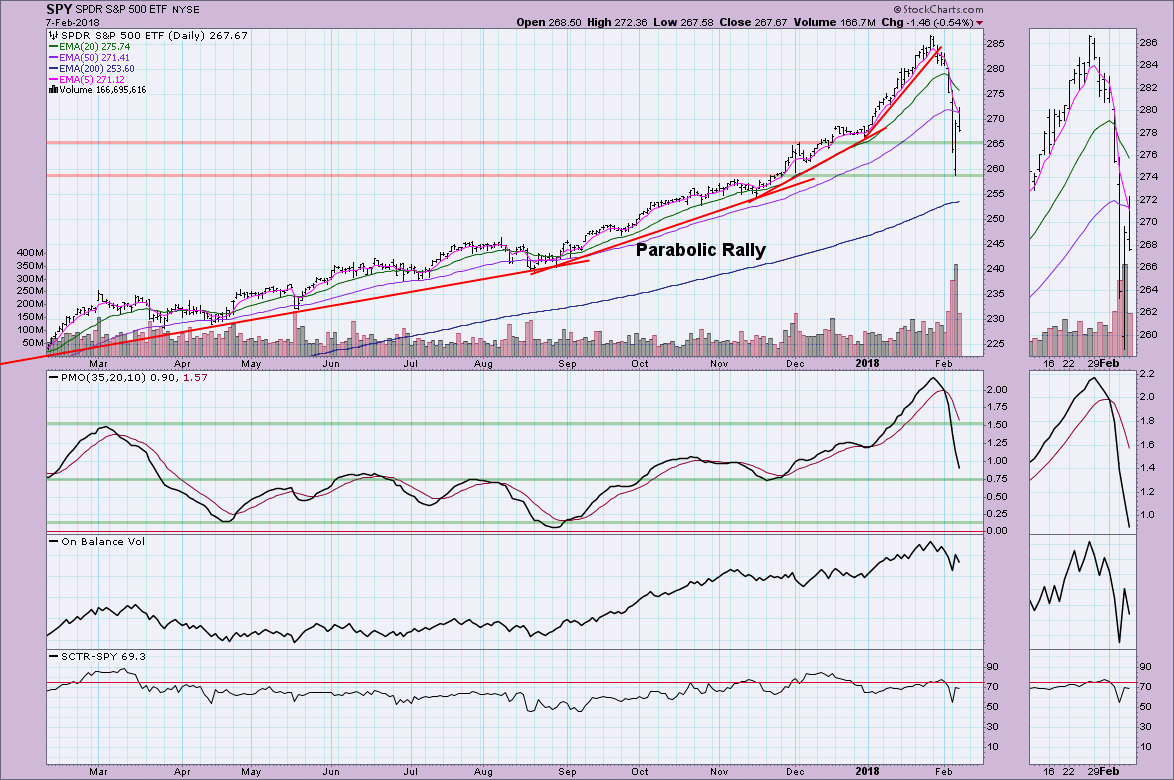
The bounce occurred right off support at the November highs. This is very encouraging. The PMO has managed to unwind almost back to the zero line. It hasn't really decelerated much so negative momentum is still present. I'll feel much better when the PMO finds a bottom, preferably above the zero line which would imply internal strength.
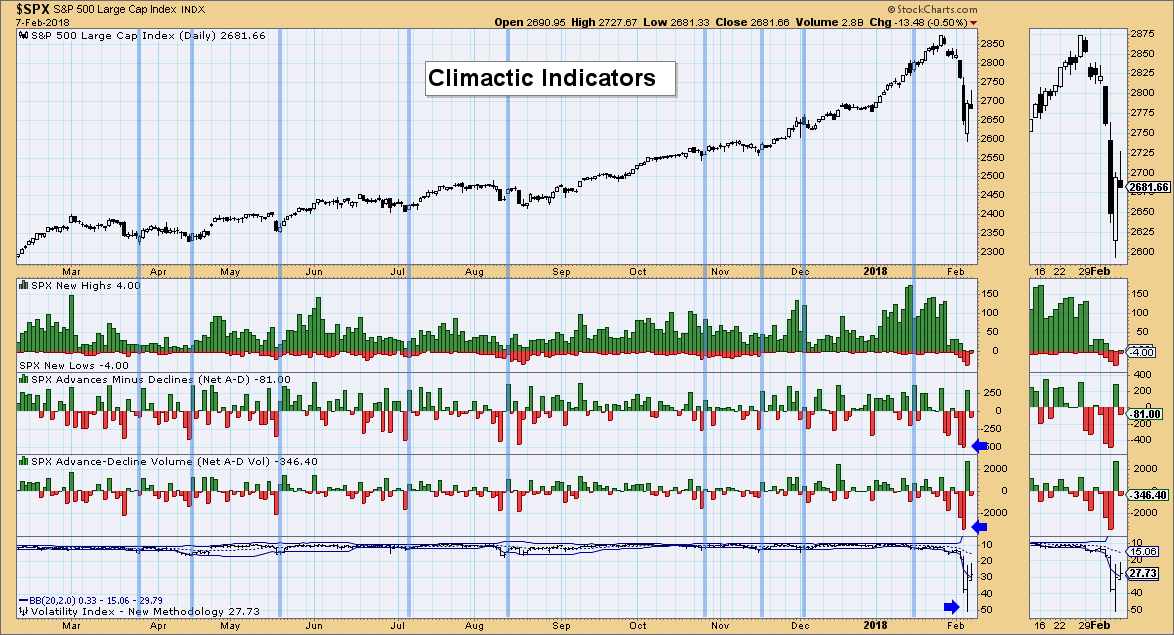
Climactic Indicators:
Yesterday's positive spikes on breadth looked very much like a buying initiation. While we saw buying today, the market couldn't hold onto the gains. Current readings are far from climactic and the VIX is now back within the Bollinger Bands. Notice how 'un-volatile' the volatility index has been most of the year. It has become especially apparent given the 30 and 40 readings from Monday and Tuesday which basically flattened and hid most of the VIX's movement and readings. The blue vertical annotations are lined up on VIX lower Bollinger Band penetrations.
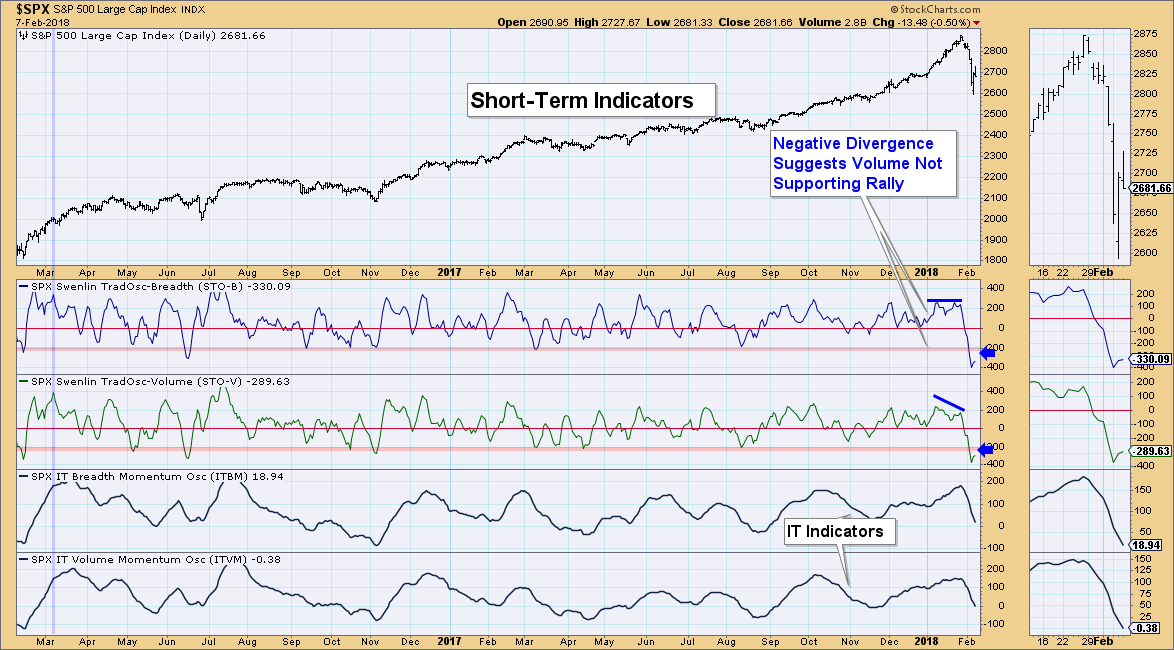
Short-Term Indicators:
It's very encouraging to see these indicators ticking up today in extremely oversold territory. I'll feel better when the 'tick up' turns into a move up. Note in the thumbnail that these indicators are already slowing their ascent. I don't like it.
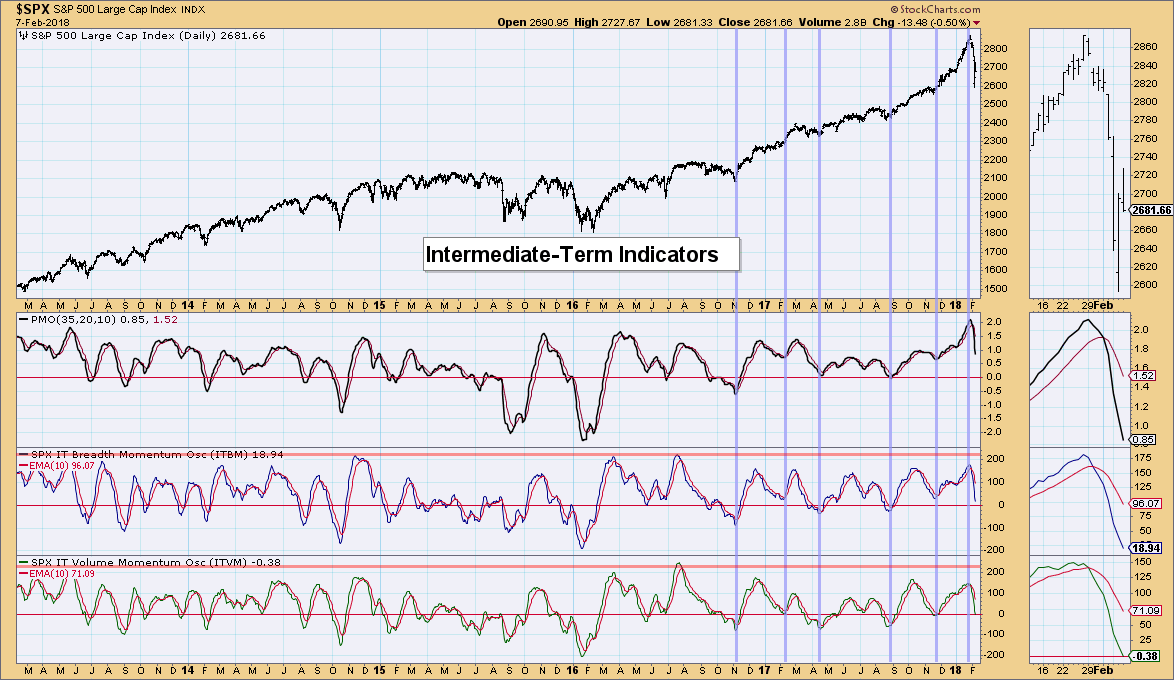
Intermediate-Term Indicators:
These indicators show no interest in slowing their descent. They are primed to drop below the zero line. Given they haven't bottomed yet, I would stay cautious in the intermediate term. I see many similarities of this drop with the previous corrections in mid-2015 and early 2016. I am looking for a short-term bounce that will likely fail and form a double-bottom.
Conclusion:
Indicators are suggesting more downside or sideways action. I thought the Swenlin Trading Oscillators were looking good until I saw in the thumbnail that the current bottoms may not hold. I'm not comfortable entering this market and moving out of cash. While the worst may be over, indicators are not impressing me.
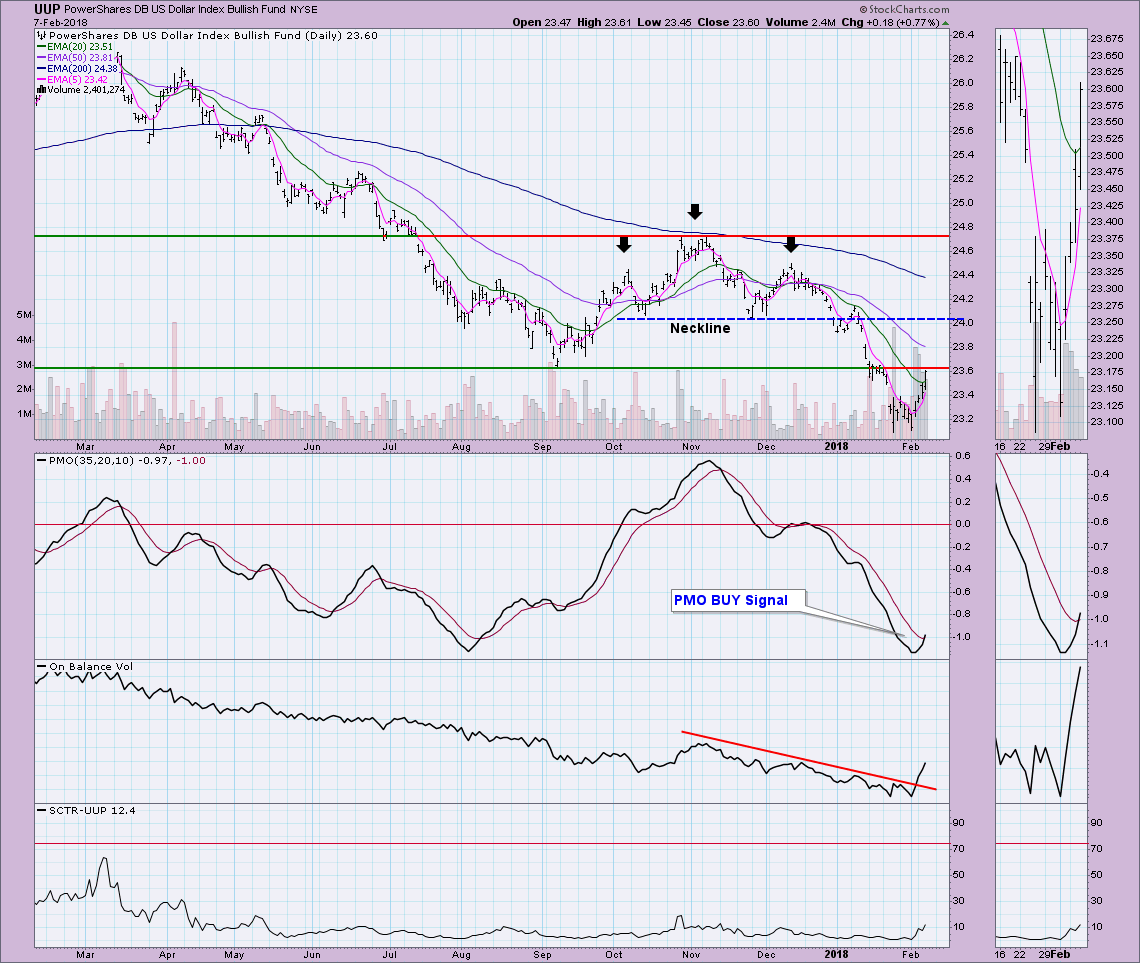
DOLLAR
IT Trend Model: SELL as of 12/21/2017
LT Trend Model: SELL as of 05/24/2017
The Dollar finally found some support and has now closed the exhaustion gap from January. The PMO has a newish BUY signal and volume looks great. Look at the declining trend that was finally broken on the OBV. I am expecting overhead resistance at $23.60 to be broken as UUP likely moves to test the neckline of the winter head and shoulders pattern. Notice that when the minimum downside target was reached, price turned back up like clockwork. Of course, if you look at the weekly chart, major support was readily available there.
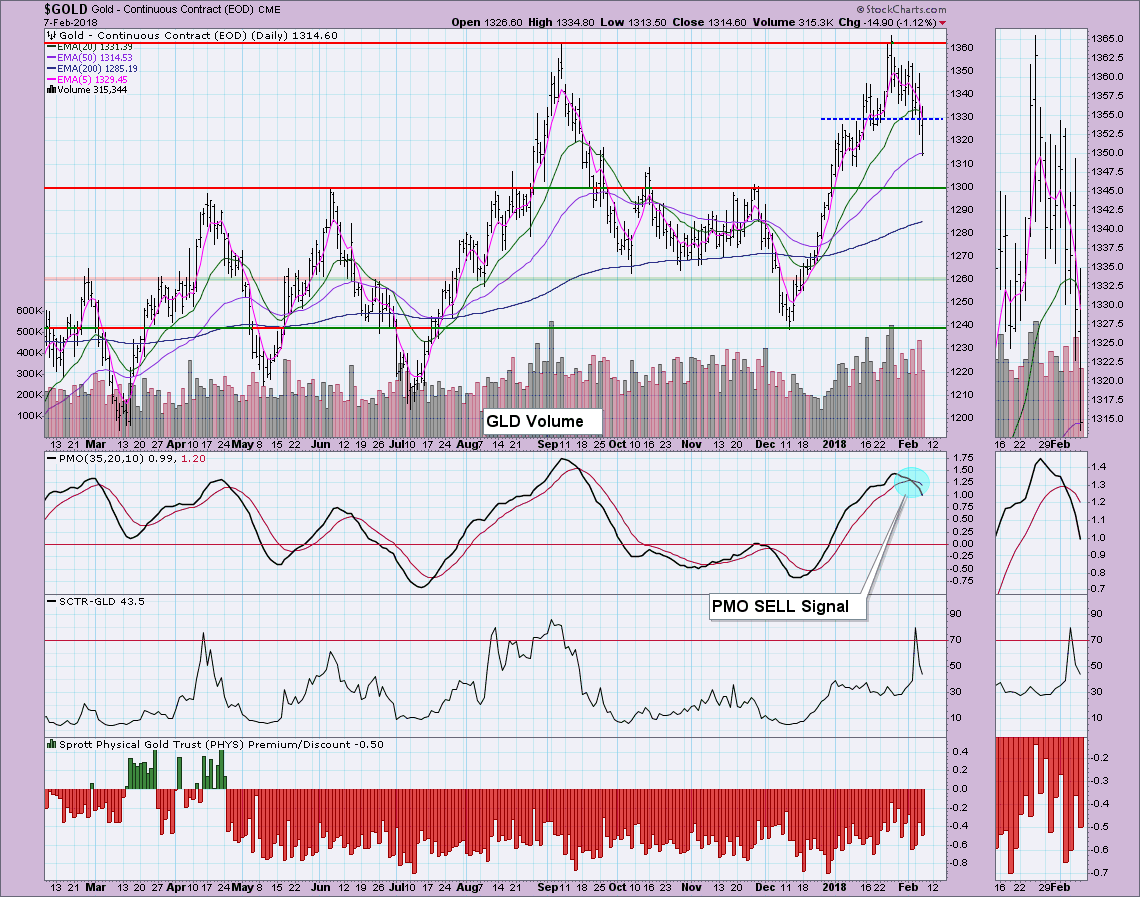
GOLD
IT Trend Model: BUY as of 1/2/2018
LT Trend Model: BUY as of 4/12/2017
The ST Trend Model generated a Neutral signal today as the 5-EMA crossed below the 20-EMA. The PMO gave us plenty of warning. It seems that 'memory' on Gold keeps support and resistance lines quite consistent. I'd be looking for a test at 1300. Since the PMO has not unwound much at all, I'm afraid it will fall further to the 1260 area. Good news is that the 50-EMA held today as support (albeit barely). Likely it won't hold--too much of a bearish chart.
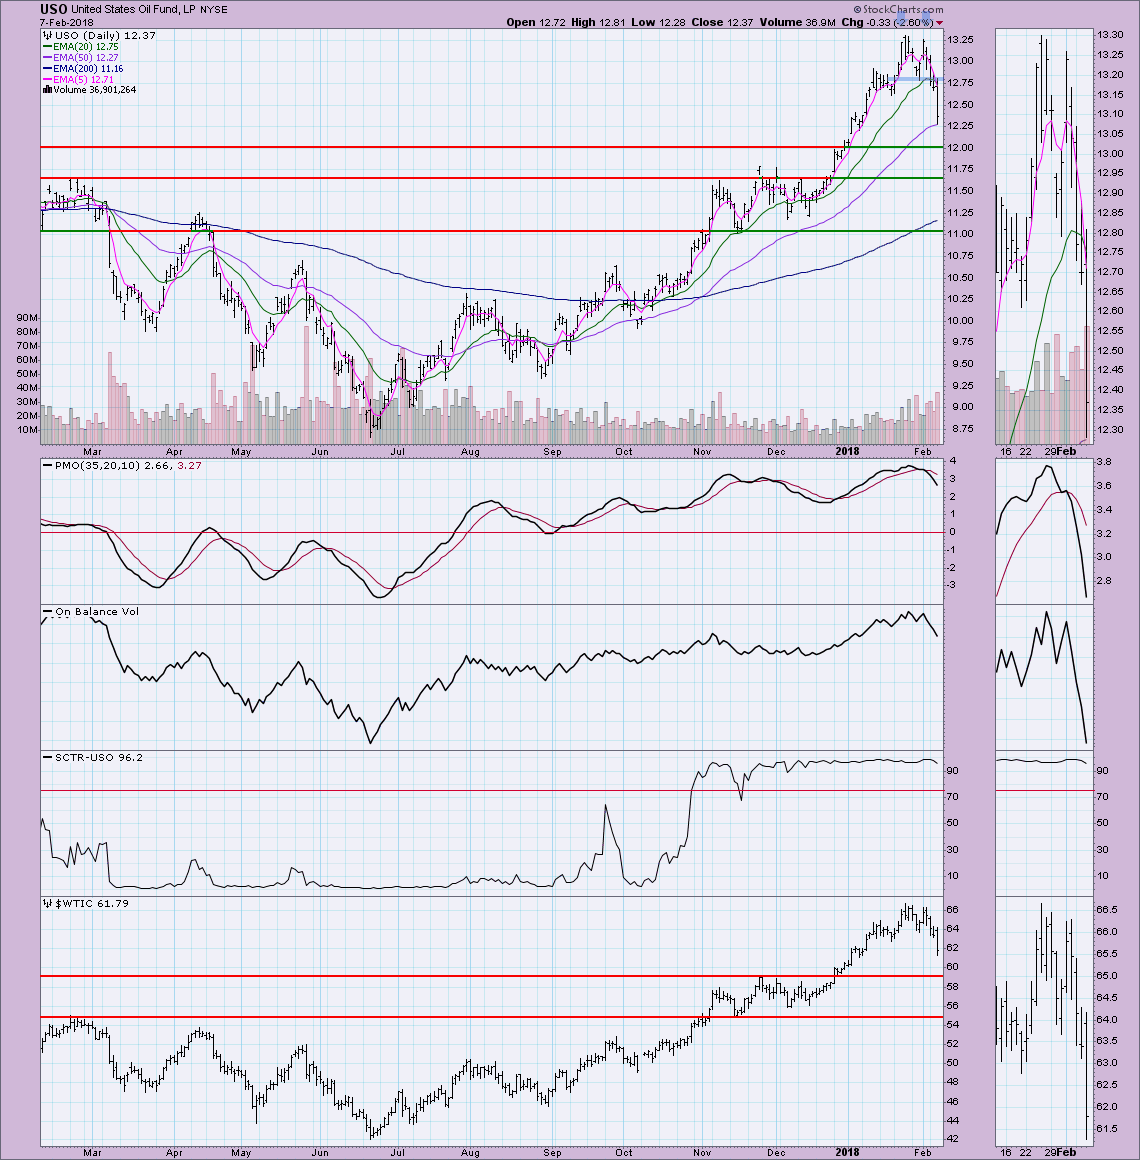
CRUDE OIL (USO)
IT Trend Model: BUY as of 11/2/2017
LT Trend Model: BUY as of 9/7/2017
The double-top on USO executed to perfection and has already reached the minimum downside target. Price held onto the 50-EMA for support. Should it not hold, I'll make a case that the $12.00 support level (based on the slight pause at the end of January) will likely hold and if it doesn't, $11.75 should. The big problem is the PMO hasn't pulled back enough on this decline and remains mostly overbought. If we see the decline continue as a waterfall, that will be fixed. $WTIC has strong support at the $59 level which is where I'm looking for a bottom.
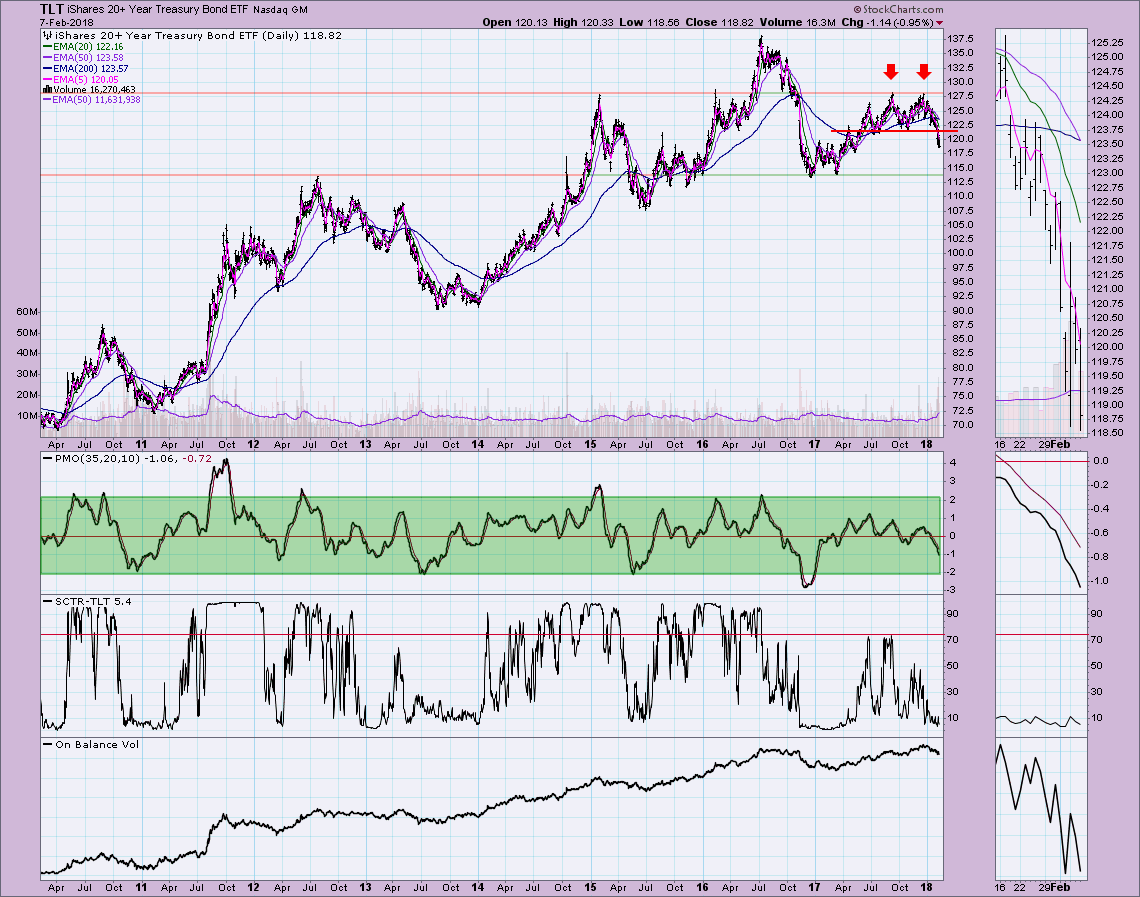
BONDS (TLT)
IT Trend Model: Neutral as of 1/11/2018
LT Trend Model: BUY as of 6/16/2017
The 50-EMA only missed a negative crossover the 200-EMA by a hundredth of a point. It'll happen tomorrow as there is no way that price would rally back above the 200-EMA at this point. The double-top executed and based on measurement, the minimum downside target is around $114 which happens to coincide with the March 2017 low. There are other areas of possible intermediary support which could hold, but the PMO isn't decelerating and while it may appear oversold, the second chart shows us the "normal range" for TLT and a reading of -1.06 is not oversold.
Technical Analysis is a windsock, not a crystal ball.
Happy Charting!
Erin
Helpful DecisionPoint Links:
DecisionPoint Shared ChartList and DecisionPoint Chart Gallery
Price Momentum Oscillator (PMO)
Swenlin Trading Oscillators (STO-B and STO-V)
**Don't miss DecisionPoint Commentary! Add your email below to be notified of new updates"**
