Two more BUY signals were lost on the DecisionPoint Scoreboards. We haven't seen the Intermediate-Term Trend Model Neutral signals on the Scoreboards in over a year. This consistent deterioration is worrisome and combined with bearish chart patterns and indicators, I'd have to say the correction is still 'on'. Our climactic indicators give us a sense of what to expect in the next few days and they pointing to a dead cat bounce.
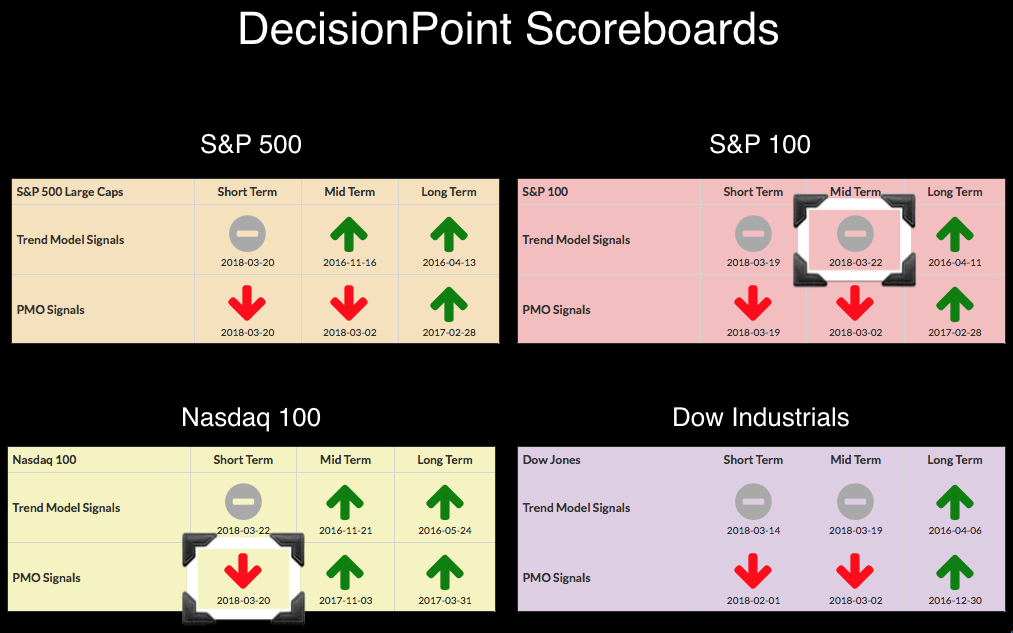
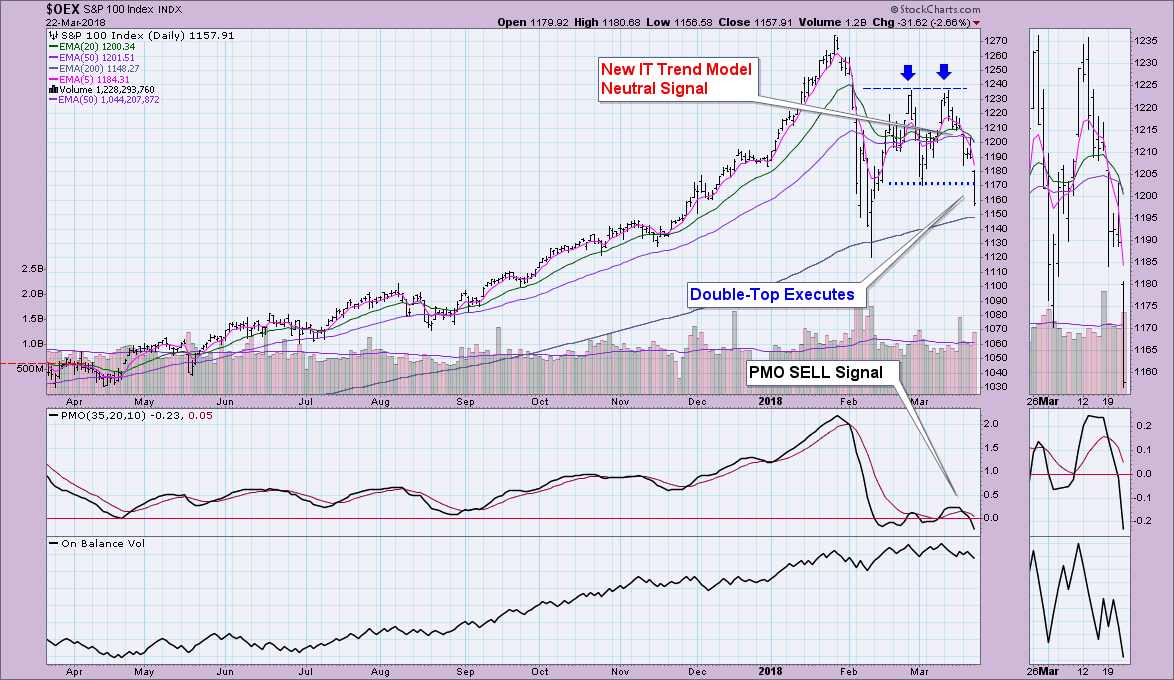
Let's review the signal changes first. The OEX is in serious trouble right now after executing the double-top formation. As I noted with the Dow yesterday, we haven't seen an ITTM Neutral signal in over a year. The weakness emanating from this chart is palpable. Not only a double-top execution, the PMO has now dropped past two of the previous lows. Just seeing a negative reading on the index PMOs is bearish. Note that in a strong bull market, the PMO will usually oscillate above the zero line. Volume is also confirming this drop. If the pattern executes to expectation, the minimum downside target would be around 1100. If we break below the February low, a bear market is back in play.
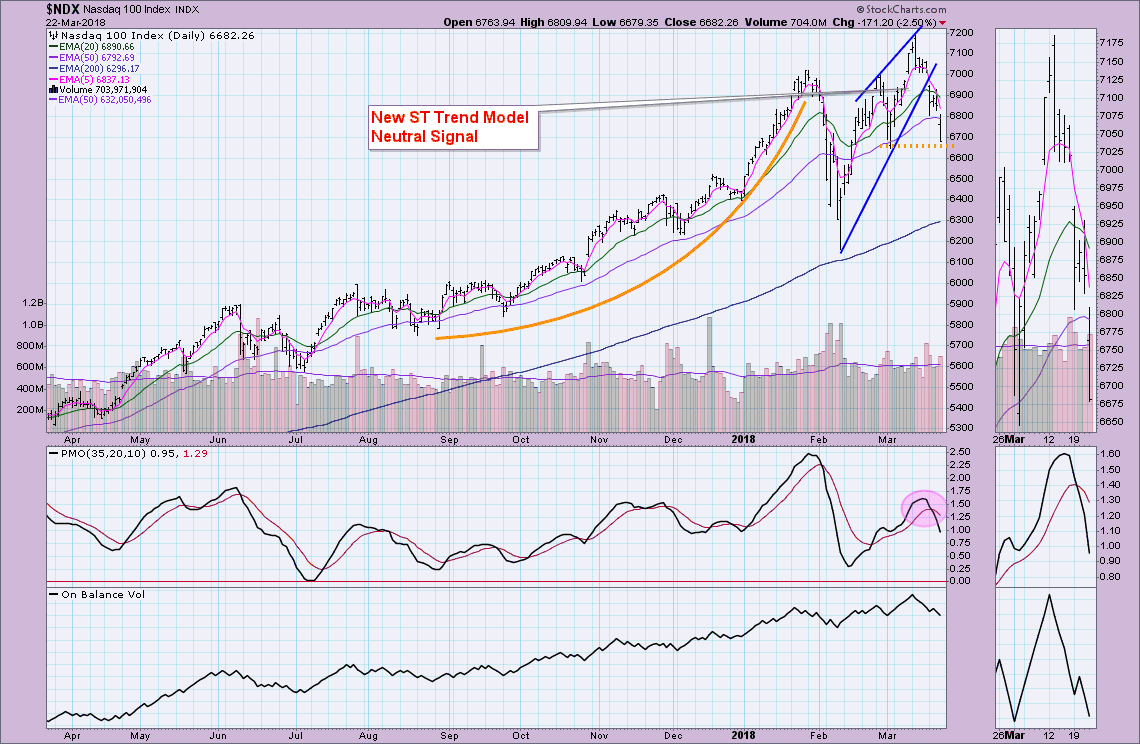
The NDX has held its own showing its relative strength in the DP Scoreboards for some time. Technology is losing favor in this decline and that doesn't bode well for the market as technology is an aggressive sector that generally spurs on the bull market. The rising wedge executed as expected with a breakdown. Price is now sitting on support and ready to test previous March low.
I mentioned "bounce" in the title and suspect short-term bulls are reading this section intently. Climactic indicators are a combination of breadth and the VIX Bollinger Band. I use them as sentiment indicators and sentiment being contrarian, a high VIX reading and penetration of the lower Bollinger Band shows that investors are particularly bearish. This is actually bullish in the very short-term for the market. I note that our last climax on Monday was likely a selling exhaustion and I'd look for a move higher or sideways. We saw even more climactic readings today in breadth accompanied by a VIX finish below the lower Bollinger Band. Looking at price landing on support at the previous March low, it would make sense to see a pop off support or a meandering sideways.
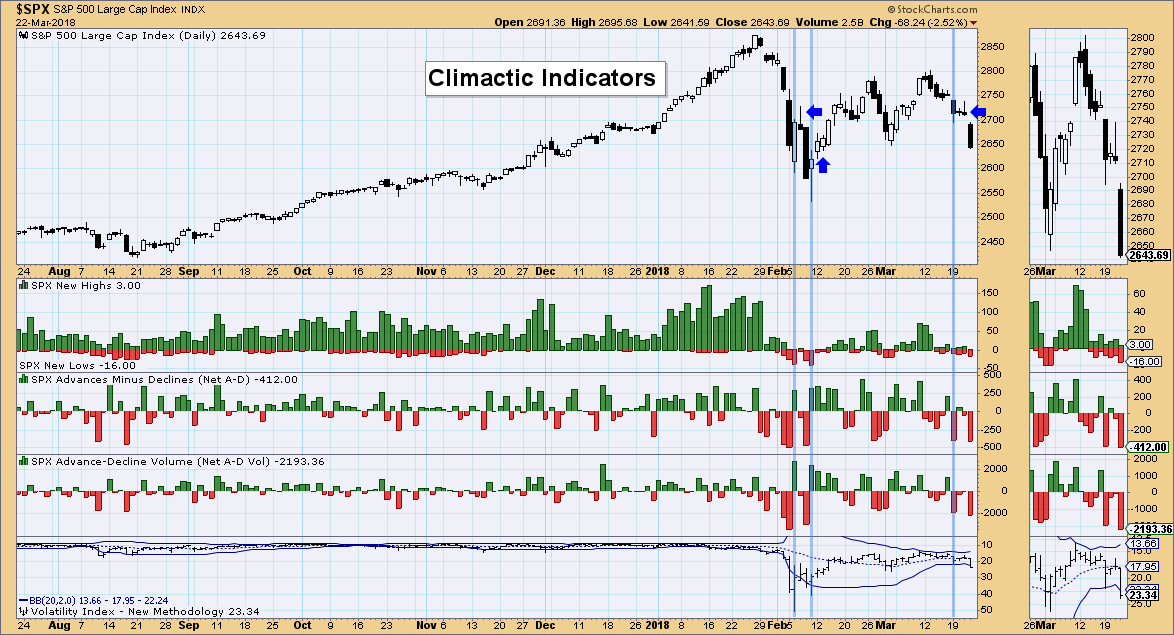
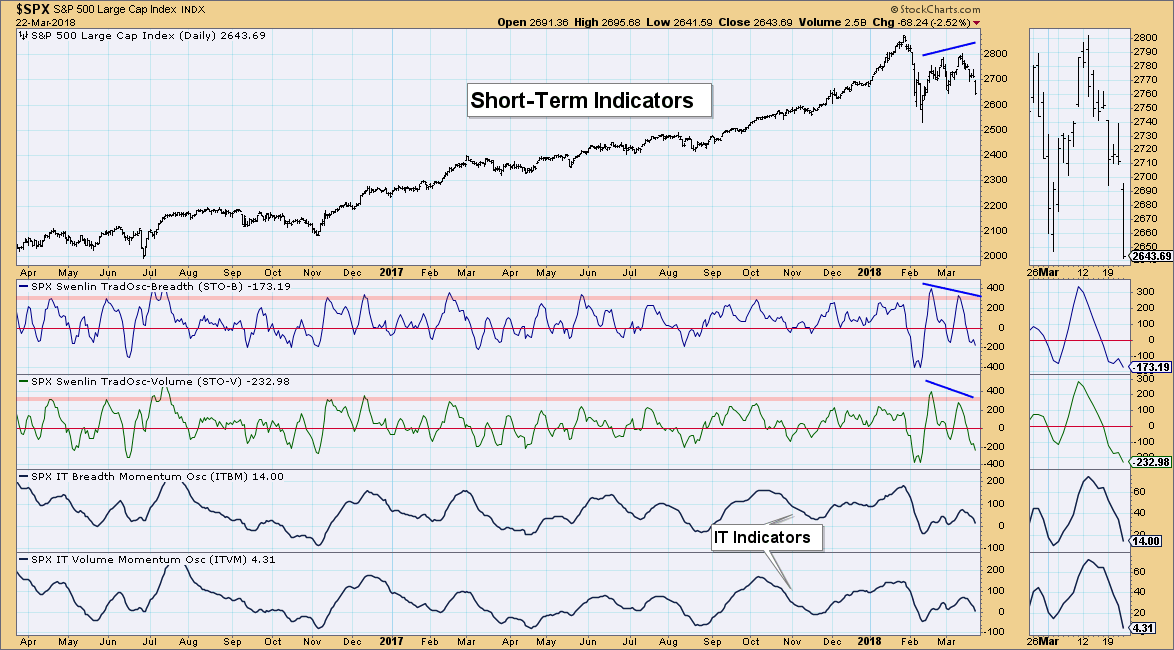
After that, I am fairly sold on the idea that the February low will be tested. The short-term indicators were considering a move higher, but today turned back down. They are in a negative divergence with price tops and the double-top is a dominant pattern. So while we should see a pause or slight bounce tomorrow or Monday, I think we can safely label it a "dead cat" bounce.
Helpful DecisionPoint Links:
DecisionPoint Shared ChartList and DecisionPoint Chart Gallery
Price Momentum Oscillator (PMO)
Swenlin Trading Oscillators (STO-B and STO-V)
Technical Analysis is a windsock, not a crystal ball.
Happy Charting!
- Erin
**Don't miss DecisionPoint Commentary! Add your email below to be notified of new updates"**
