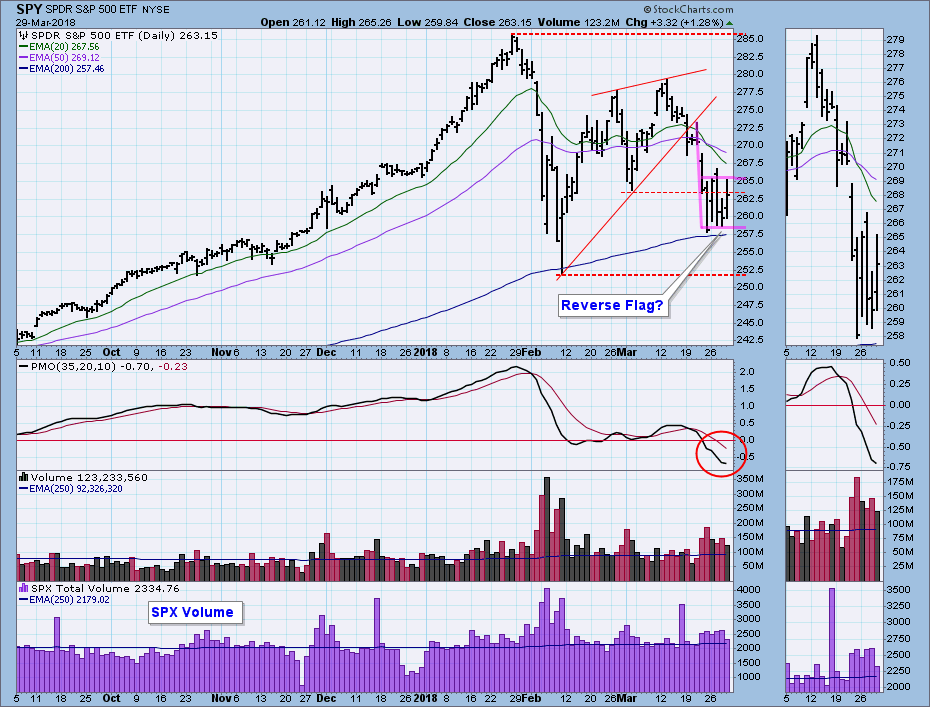
Last week the market broke down from a rising wedge pattern and dove into a scary decline. This week was choppy and wild, but price stayed within a somewhat ragged range that looks to me like a bearish reverse flag formation. Price remained above the 200EMA, and every day volume was a bit above the one-year average of volume. Has there been a successful retest, or is there more trouble ahead?
The DecisionPoint Weekly Wrap presents an end-of-week assessment of the trend and condition of the stock market (S&P 500), the U.S. Dollar, Gold, Crude Oil, and Bonds.
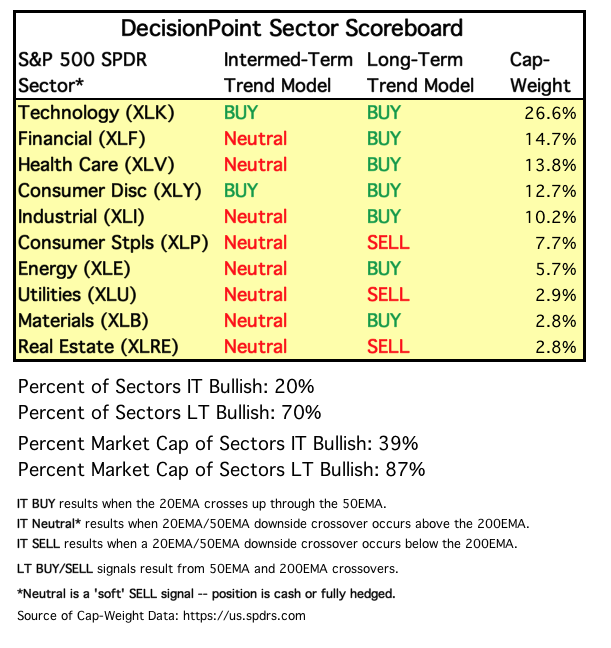
SECTORS
Each S&P 500 Index component stock is assigned to one, and only one, of 10 major sectors. This is a snapshot of the Intermediate-Term and Long-Term Trend Model signal status for those sectors.
This week Consumer Discretionary (XLY) came very close to going IT NEUTRAL. This will certainly happen Monday, unless there is a furious rally. That will leave Technology (XLK) as the lone IT BUY, but without a decent rally, that light will go out, possibly next week.
STOCKS
IT Trend Model: NEUTRAL as of 3/23/2018
LT Trend Model: BUY as of 4/1/2016
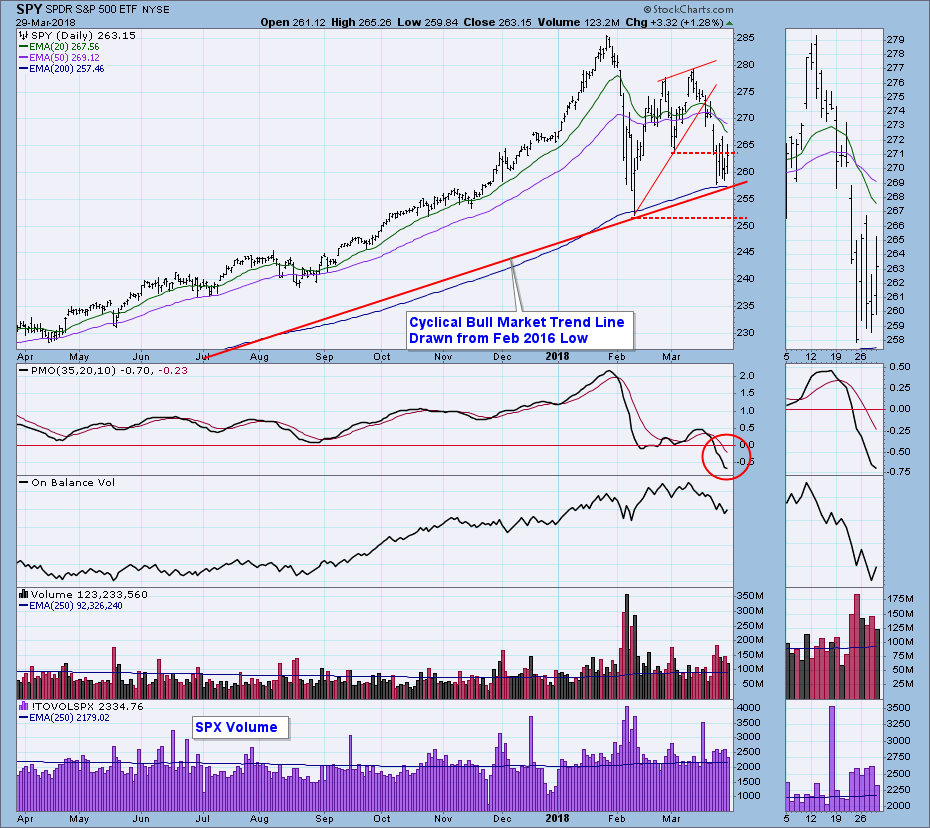
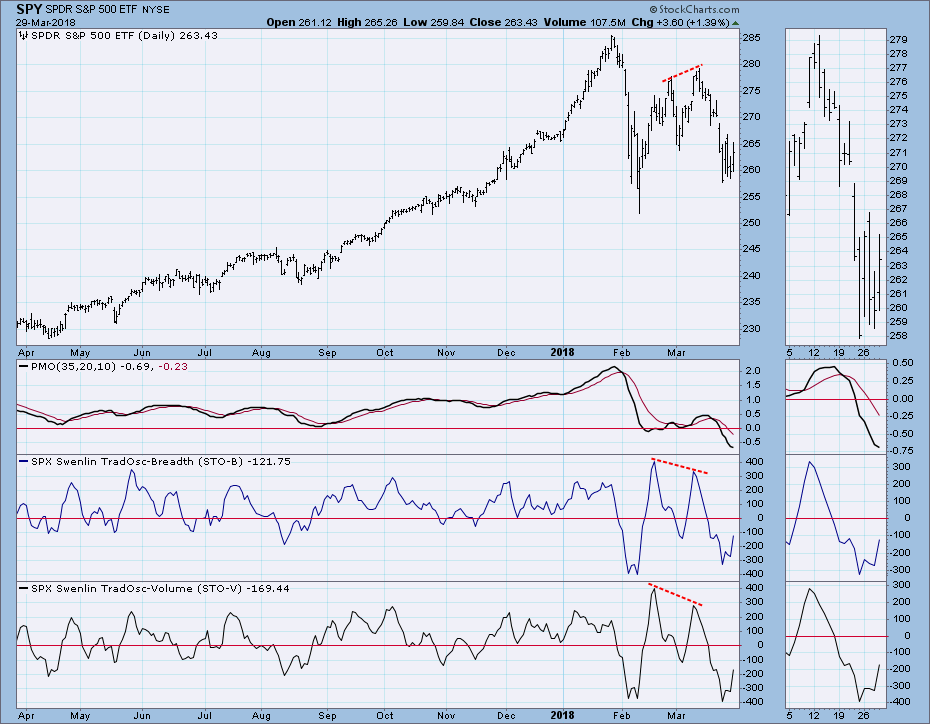
SPY Daily Chart: The 200EMA and bull market rising trend line seem to have stopped the decline, but the reverse flag is a continuation pattern, and the expected resolution is down.
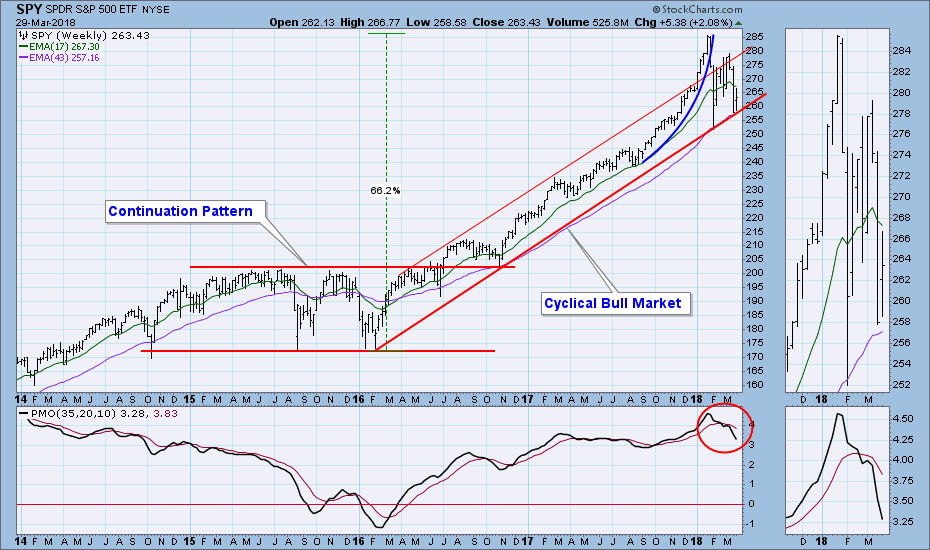
SPY Weekly Chart: In spite of this week's hopeful chop, the weekly PMO is still falling below the signal line at a fairly steep angle.
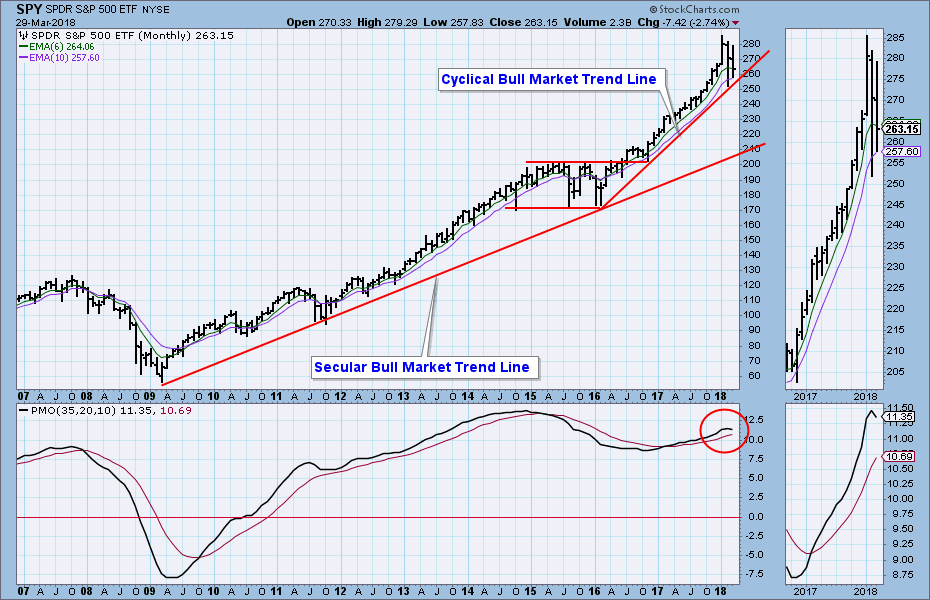
SPY Monthly Chart: The big news in this time frame is that the overbought PMO has topped. It is a rather shallow top, but it should be viewed as a precursor of lower prices to come over the long term.
Short-Term Market Indicators: The STO-B and STO-V are somewhat oversold, but they do not preclude price moving decisively in either direction.
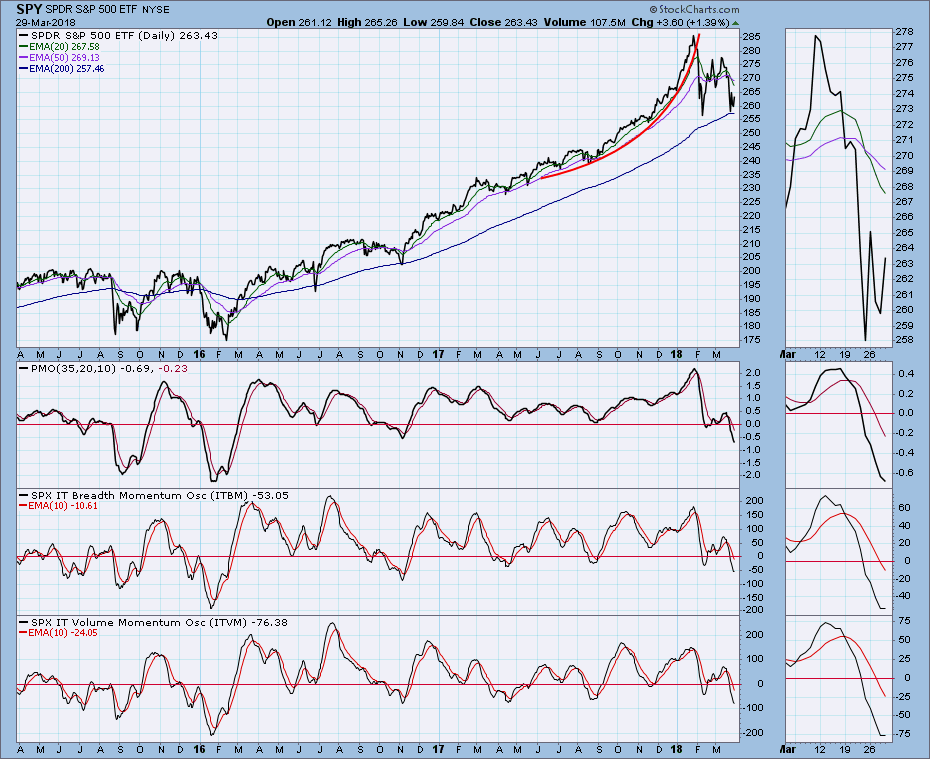
Intermediate-Term Market Indicators: All three indicators are modestly oversold and trying to bottom, but there is plenty of room for them to go lower within their ranges. Note that the price chart shows that price came very close to the February low on a closing basis. I would find encouragement from this chart, if I were a bull.
Conclusion: While I see a reverse flag formation, I could certainly make a case for a double bottom. Nevertheless, I still think we are in a bear market. There are eight (soon to be nine) of the ten S&P 500 sectors on NEUTRAL (cash or fully hedged). And the Technology, the last sector standing, will go NEUTRAL soon if the market fails to rally. If the market takes out the February low, that will establish an intermediate-term falling trend, and will add more convincing evidence to my bear case. Even so, it will be a long time, certainly weeks and maybe months before the 50EMA crosses down through the 200EMA, which is my objective definition of a bear market. In the meantime, is the possible upside opportunity worth the downside risk? At this point, I don't think so.
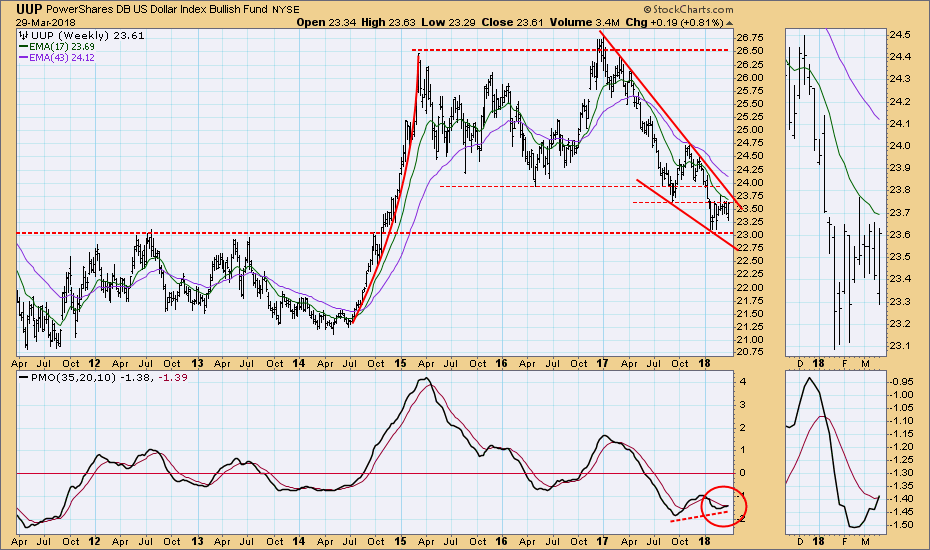
DOLLAR (UUP)
IT Trend Model: SELL as of 12/21/2017
LT Trend Model: SELL as of 5/24/2017
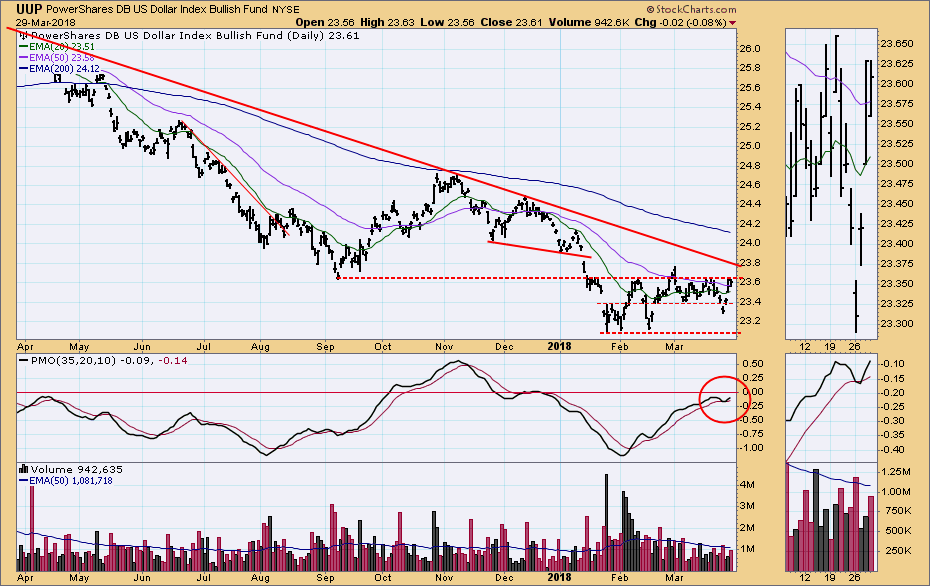
UUP Daily Chart: We had a fake break on Monday, and UUP recovered immediately. Now it is back at resistance.
UUP Weekly Chart: The weekly PMO has formed a positive divergence, and it is rising above the signal line. The large falling wedge is bullish.
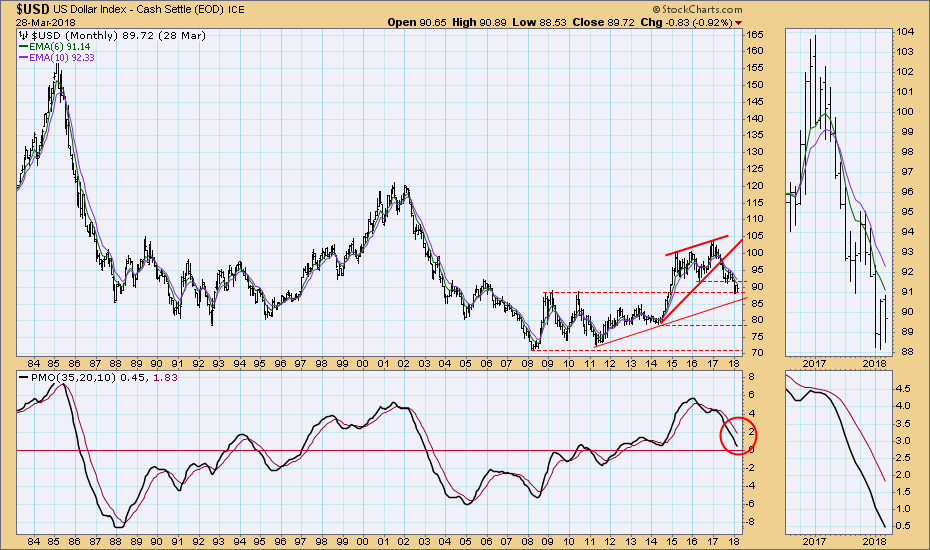
$USD Monthly Chart: For this time frame I will switch from UUP to $USD for the deeper data set. The monthly PMO is falling steadily, and price is in a down trend. Bearish.
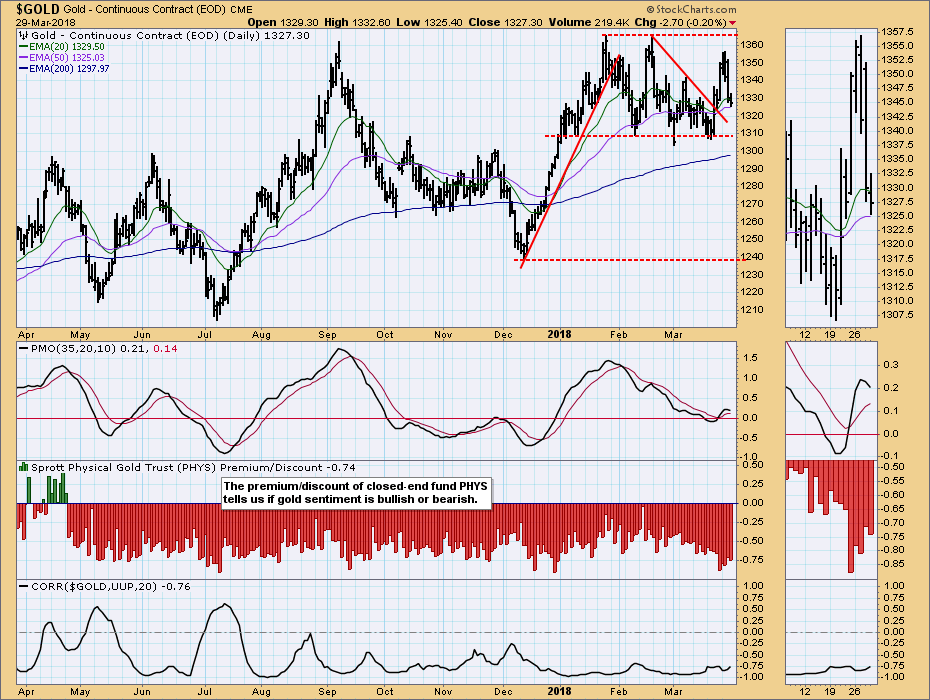
GOLD
IT Trend Model: BUY as of 1/2/2018
LT Trend Model: BUY as of 4/12/2017
GOLD Daily Chart: Last week there were two big up days, but this week half of those gains were lost. The failure to reach the top of the trading range, and the PMO top point to a possible breakdown through 1310 support.
GOLD Weekly Chart: Modestly bullish, but the weekly PMO has topped again.
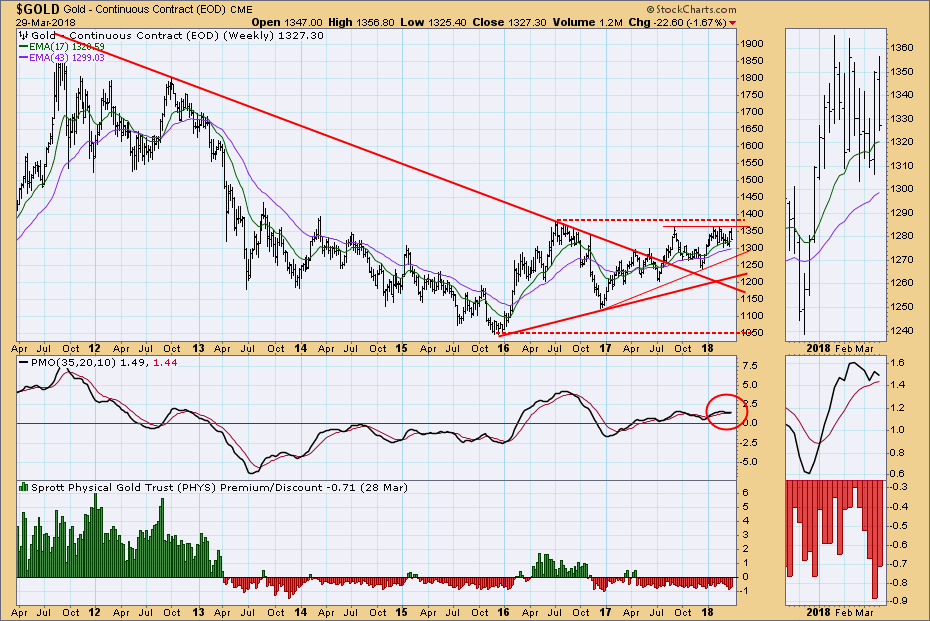
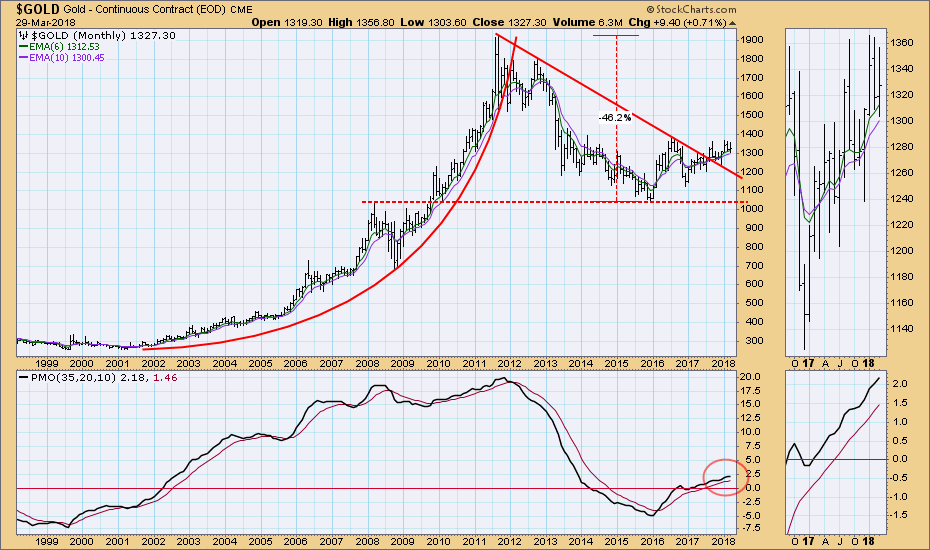
Gold Monthly Chart: Another great example of a parabolic advance. There was not a complete price collapse on this one, but there was a decline of almost -50%. The monthly PMO is rising, albeit not at a blistering pace. Still modestly bullish.
CRUDE OIL (USO)
IT Trend Model: BUY as of 9/6/2017
LT Trend Model: BUY as of 11/2/2017
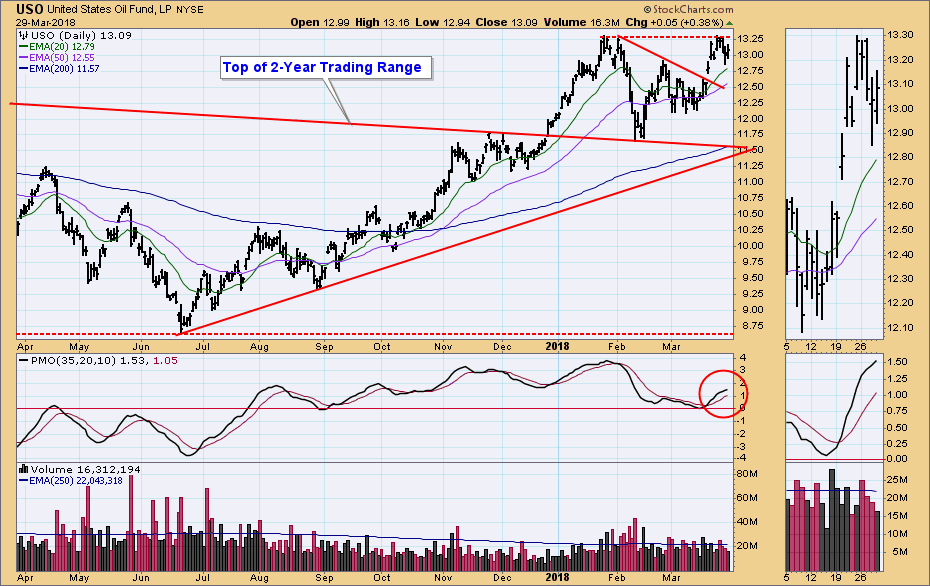
USO Daily Chart: USO fell back from resistance this week.
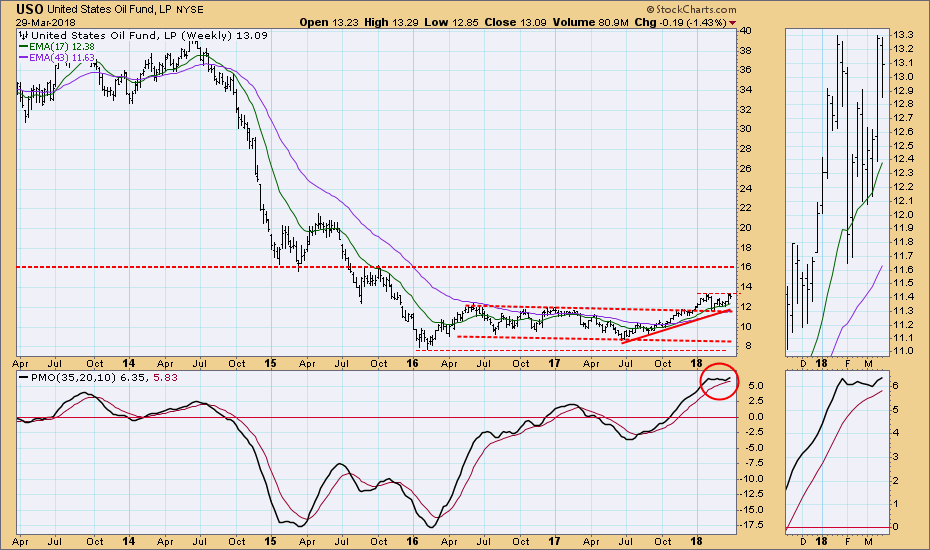
USO Weekly Chart: The weekly PMO has been flat for about two months, and direction changes have been frequent. Waiting for a decisive move.
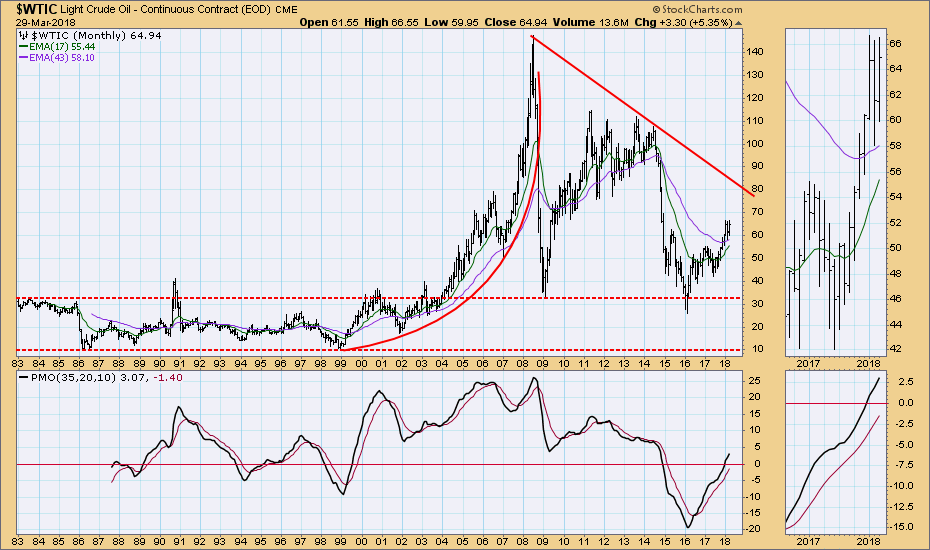
$WTIC Monthly Chart: Switching from USO to $WTIC for the deeper data set. I like to show the parabolic advance from 1999 to 2008, because it is an excellent example of how price can collapse after the parabolic breaks down. After dropping to about $34/bbl, crude had a strong rally, but it crashed again, dropping to about $26/bbl. Crude is rallying again, and the declining tops line puts overhead resistance at around $80/bbl.
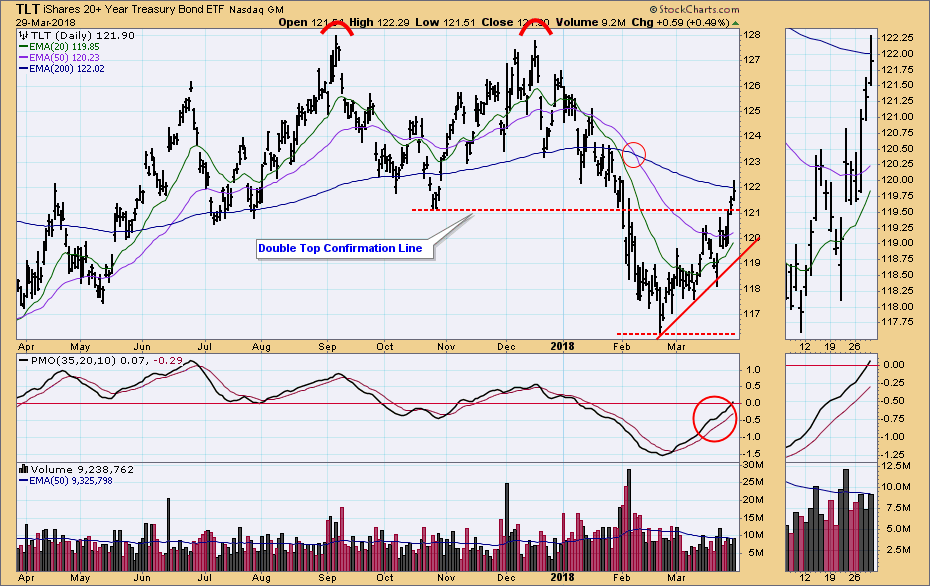
BONDS (TLT)
IT Trend Model: NEUTRAL as of 1/11/2018
LT Trend Model: SELL as of 2/8/2018
TLT Daily Chart: The break above resistance that I didn't think would happen, happened.
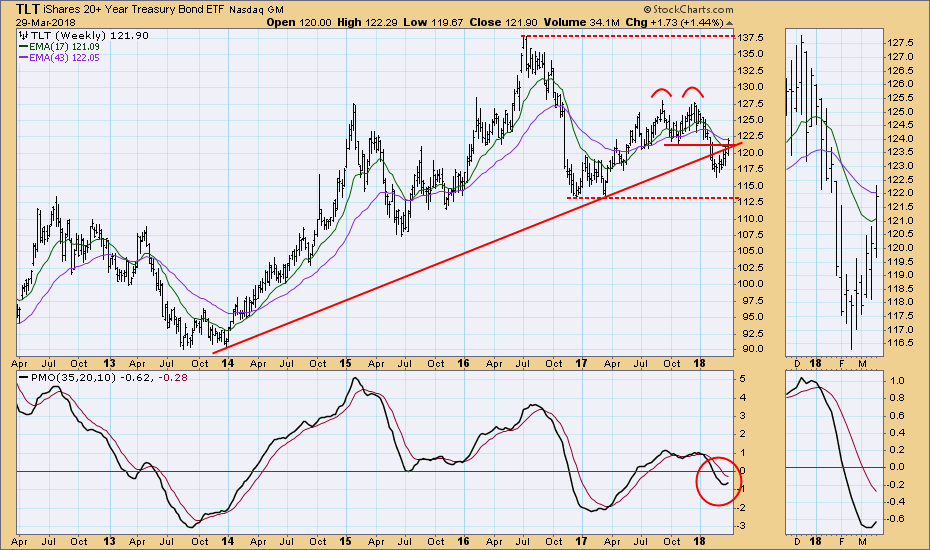
TLT Weekly Chart: The weekly PMO has bottomed, so the rally may persist.
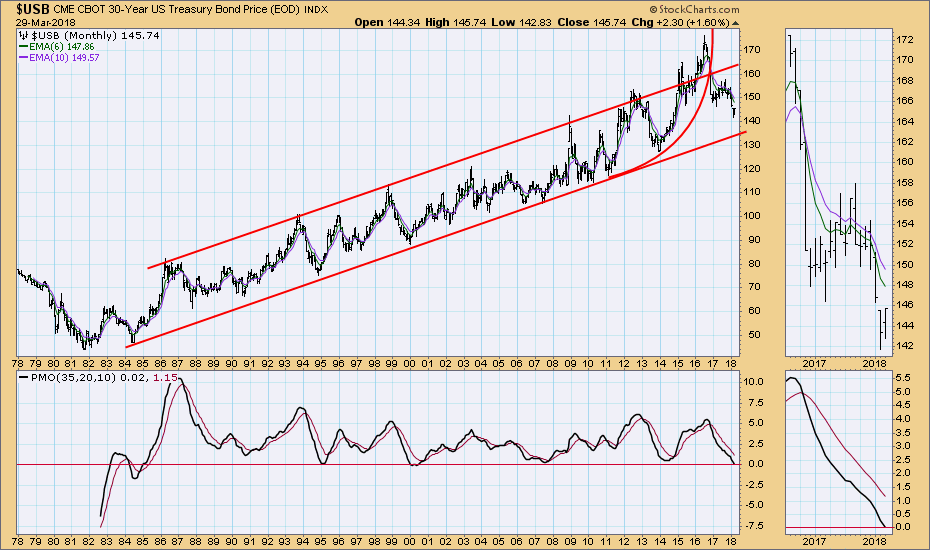
$USB Monthly Chart: As with crude oil, for the monthly chart I will switch from TLT to $USB for the deeper data set. Here we can see the parabolic advance that punched through the top of a 30-year rising trend channel. The parabolic broke in 2016, and negative forces have since prevailed. My best guess is that bonds have entered a long-term bear market that may persist for decades.
**Don't miss any of the DecisionPoint commentaries! Go to the "Notify Me" box toward the end of this blog page to be notified as soon as they are published.**
Technical Analysis is a windsock, not a crystal ball.
Happy Charting!
- Carl
NOTE: The signal status reported herein is based upon mechanical trading model signals, specifically, the DecisionPoint Trend Model. They define the implied bias of the price index based upon moving average relationships, but they do not necessarily call for a specific action. They are information flags that should prompt chart review. Further, they do not call for continuous buying or selling during the life of the signal. For example, a BUY signal will probably (but not necessarily) return the best results if action is taken soon after the signal is generated. Additional opportunities for buying may be found as price zigzags higher, but the trader must look for optimum entry points. Conversely, exit points to preserve gains (or minimize losses) may be evident before the model mechanically closes the signal.
Helpful DecisionPoint Links:
DecisionPoint Shared ChartList and DecisionPoint Chart Gallery
Price Momentum Oscillator (PMO)
Swenlin Trading Oscillators (STO-B and STO-V)
