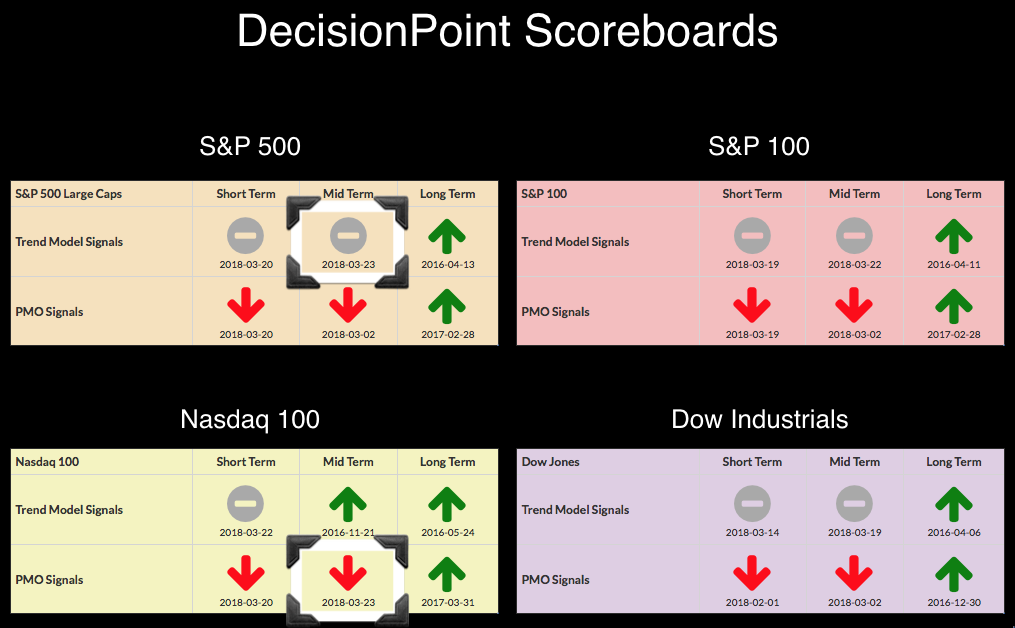
After day with the SPX up 2.72% and the NDX up 3.78%, it may seem strange to be talking about the loss of BUY signals on the DecisionPoint Scoreboards. My answer is that one day does not a bull market make. However, I'm not on board with this being a new bear market, although there is certainly evidence to support this position as found in Carl's DecisionPoint Weekly Wrap. We are in the midst of a strong correction and have nearly reached the support levels of the February lows. This retest will be very important as rising bottoms trendline support in the longer term is being tested already.
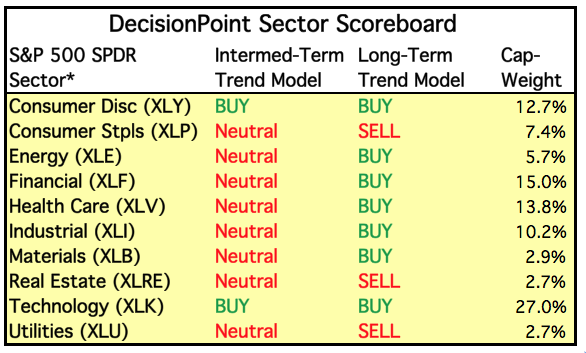
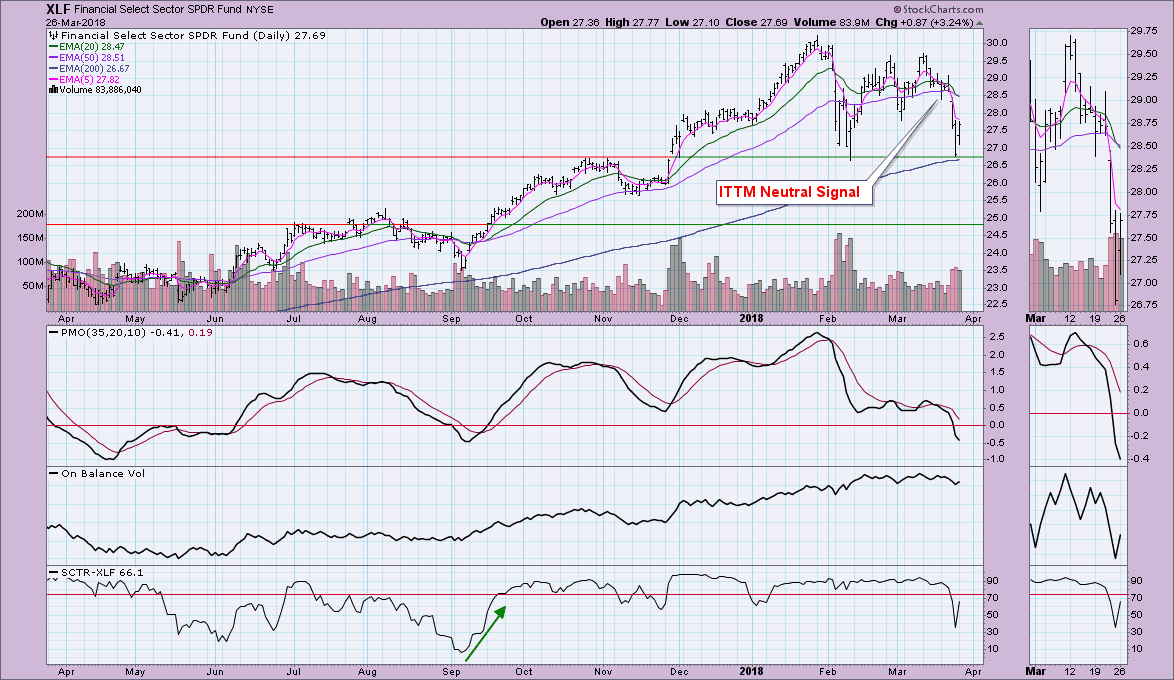
XLF is considered an "aggressive" sector and we expect and want to see it lead along with technology and consumer discretionary sectors. Seeing a new IT Trend Model Neutral on the DP Sector Scoreboard below is concerning. I'm not seeing any strength appearing in the "defensive" sectors yet, so this does temper my bearish outlook.
The ITTM Neutral signal is annotated on XLF below. Today's bounce off strong support is comforting and the PMO does want to decelerate somewhat.
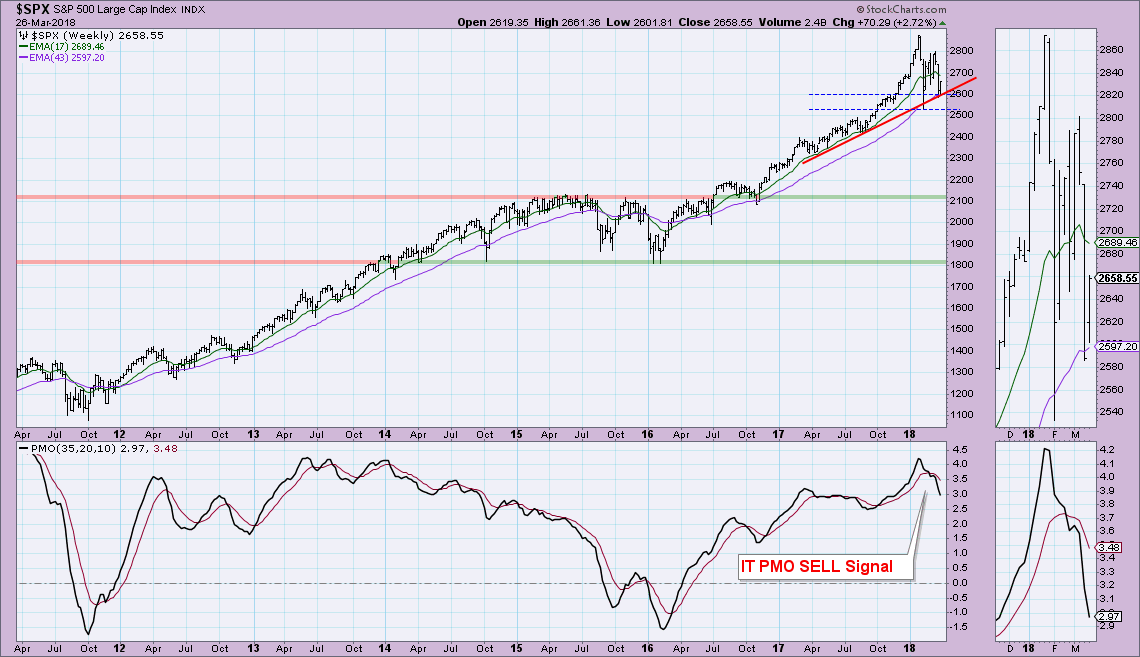
The double-top on the SPX executed, but hasn't yet fulfilled its minimum downside target around 2500. I expected to see the test of the February low given the negative configuration of the indicators, but we did see a bounce today along the longer-term rising bottoms trendline.
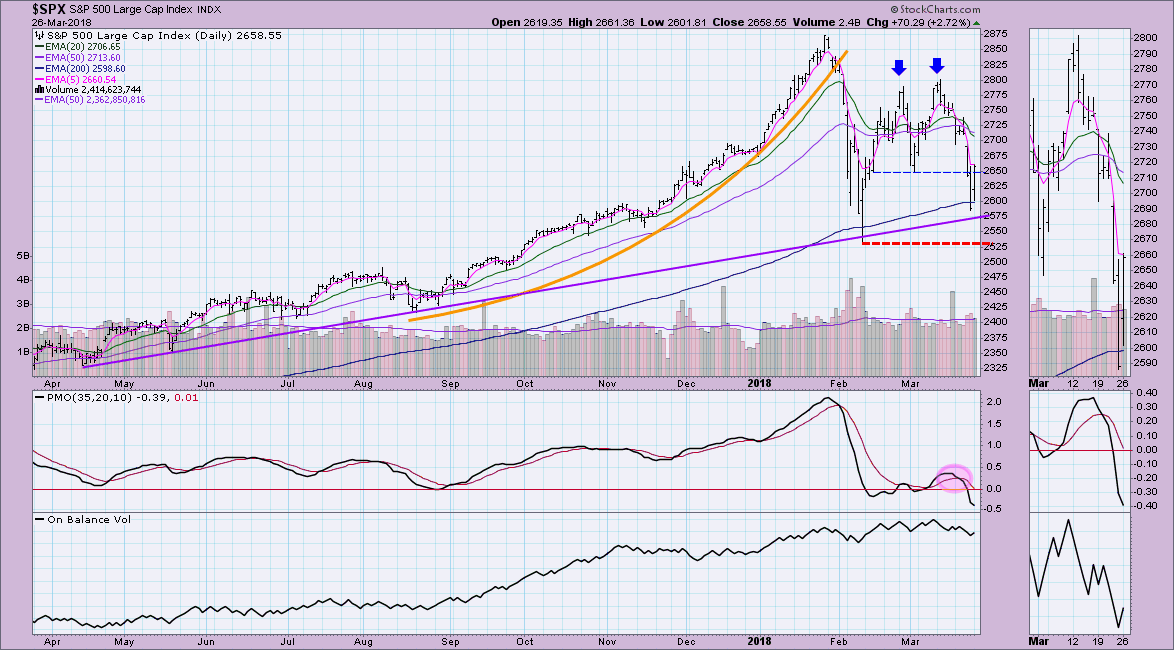
The weekly chart shows how important the longer-term rising bottoms trendline is as support. It also shows how negatively the PMO is configured right now on the weekly chart.
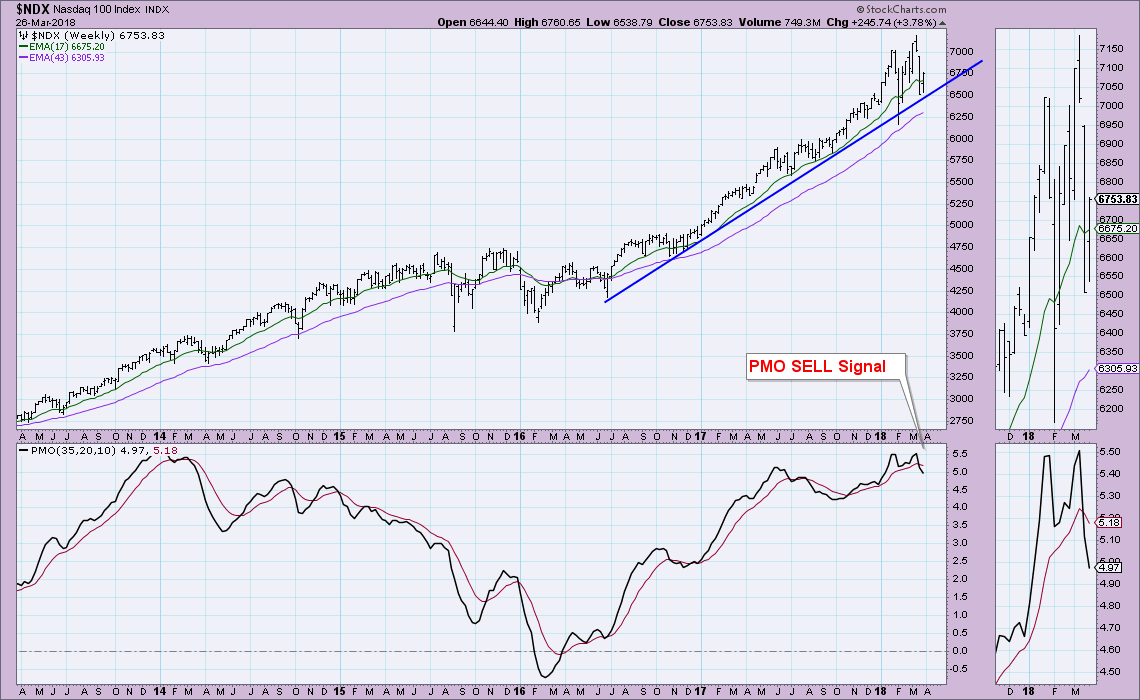
The NDX has managed to avoid the loss of intermediate term signals on the Scoreboard, but Friday it did succumb to a negative crossover on the weekly PMO. Again we can see the importance of rising bottoms line support.
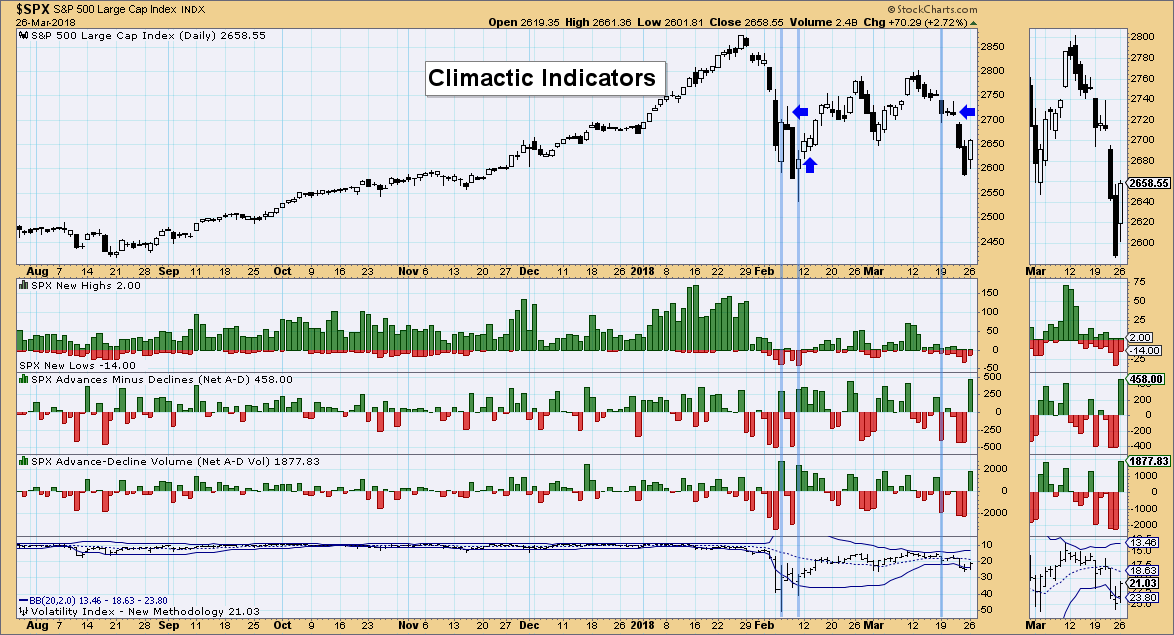
The effect of today's powerful rally on breadth and the VIX suggest to me a possible buying initiation in the short term. It may well be a buying exhaustion, but in the very short term, it is more likely an initiation that would suggest another day or two of upside movement. When the VIX penetrates the upper Bollinger Band (very low readings), then I'd look at this as a buying exhaustion.
Conclusion:
While the DP Scoreboards have shown serious deterioration, I've seen IT Trend Model Neutral signals arrive to the party a bit late and I'm concerned this is the case right now given the very strong rebound today off 200-EMA support and longer-term rising bottoms line support. It is hard to look at today's rally and call it a "dead cat bounce" given the voracity. Climactic indicators suggest we could see more rally, but with internals so weak, shown on the DP Scoreboards, I'm not convinced the correction or retests are over.
Helpful DecisionPoint Links:
DecisionPoint Shared ChartList and DecisionPoint Chart Gallery
Price Momentum Oscillator (PMO)
Swenlin Trading Oscillators (STO-B and STO-V)
Technical Analysis is a windsock, not a crystal ball.
Happy Charting!
- Erin
**Don't miss DecisionPoint Commentary! Add your email below to be notified of new updates"**
