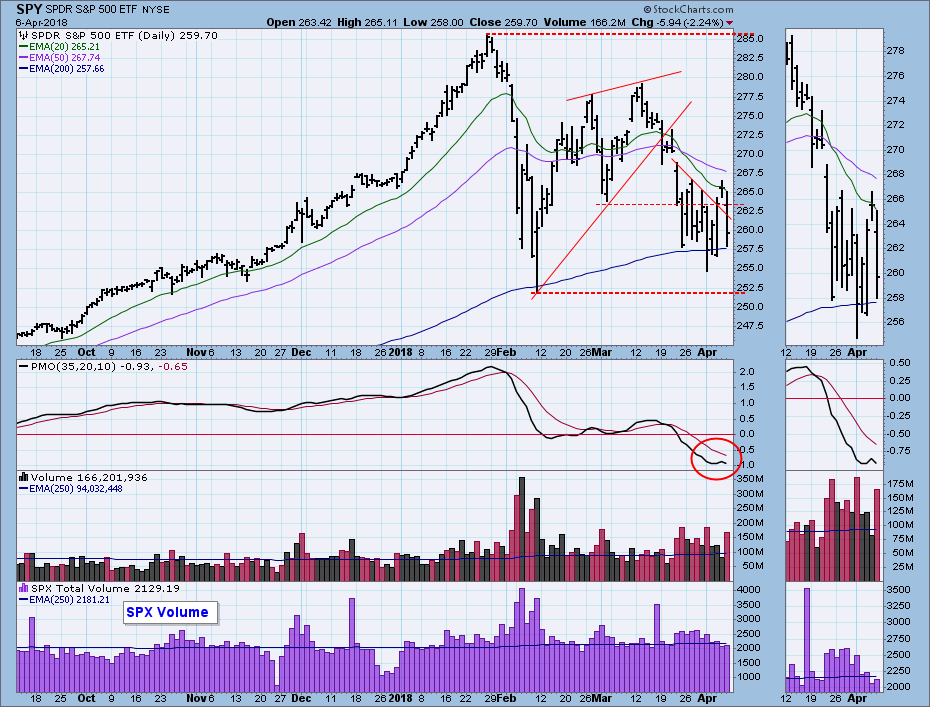
On the SPY chart last week I thought I saw a reverse flag formation, although it was not as tightly defined as I would like. This week the market thrashed around pretty badly, and although the flag didn't become more visible, there is still a ragged cluster of price bars that, in my opinion, serves the same purpose. A case can still be made for a double bottom, but I think the ragged cluster is a continuation pattern calling for lower prices.
The DecisionPoint Weekly Wrap presents an end-of-week assessment of the trend and condition of the stock market (S&P 500), the U.S. Dollar, Gold, Crude Oil, and Bonds.
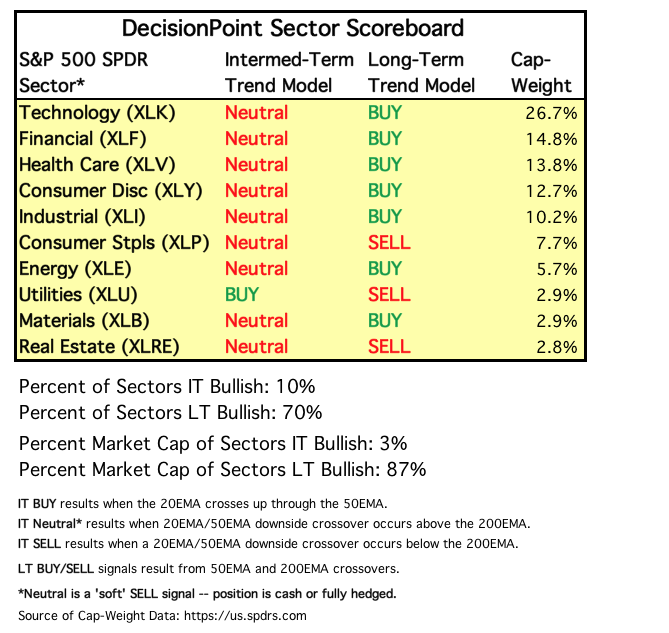
SECTORS
Each S&P 500 Index component stock is assigned to one, and only one, of 10 major sectors. This is a snapshot of the Intermediate-Term and Long-Term Trend Model signal status for those sectors.
There were three signal changes this week. Technology (XLK) and Consumer Discretionary (XLY) changed from BUY to Neutral, and Utilities (XLU) changed from Neutral to BUY.
STOCKS
IT Trend Model: NEUTRAL as of 3/23/2018
LT Trend Model: BUY as of 4/1/2016
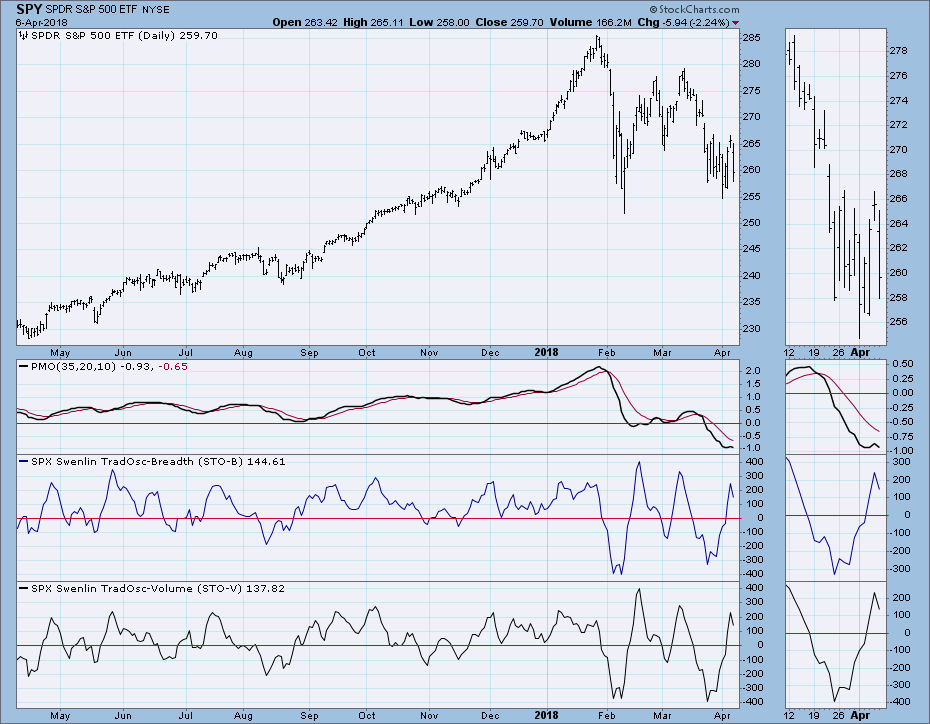
SPY Daily Chart: There was a chance that Monday's selloff represented a successful retest of the February low, but Thursday's low-volume upside breakout made me think that the bear was still in the house. The 200EMA and rising trend line are running parallel and define support pretty well, and it will be significant if it is decisively violated. The daily PMO bottomed early in the week, but on Friday it topped below the signal line. Very bearish.
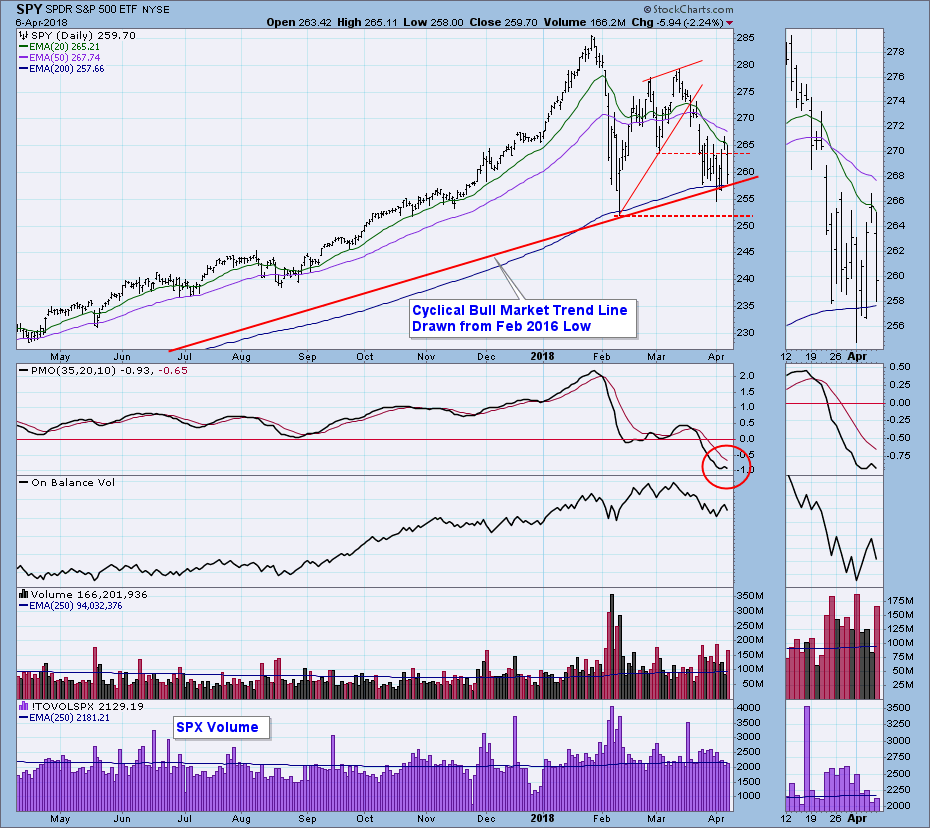
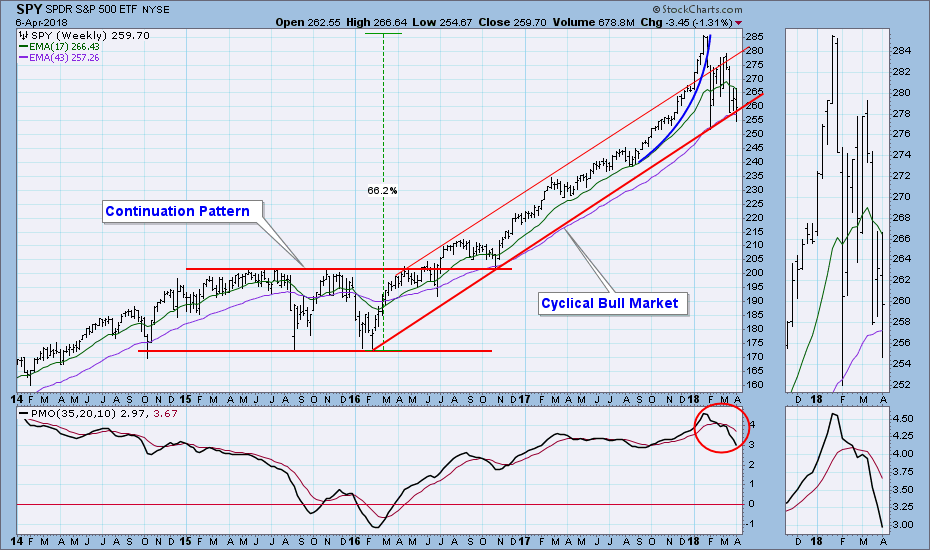
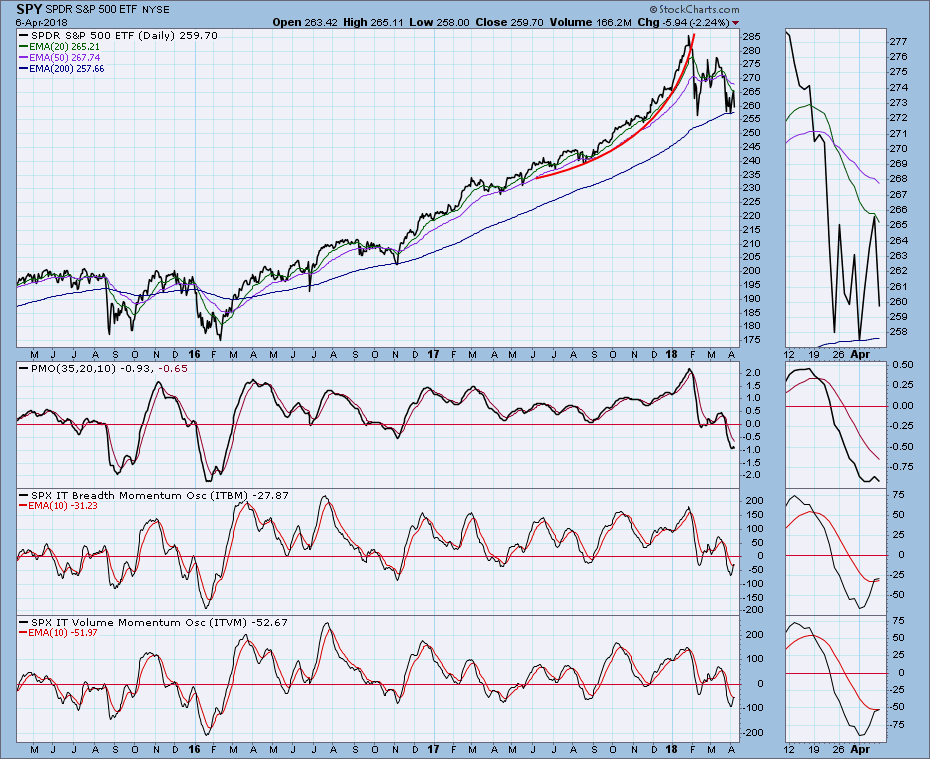
SPY Weekly Chart: Here we can see the cyclical bull market in its entirety -- from the beginning in February 2016 to the presumed end in January of this year. A decisive break below the rising trend line would be further proof that the bull is dead.
Short-Term Market Indicators: Assuming we're in a bear market, overbought indicators should be considered dangerous. In a bull market prices can advance even when internals peak, but that is less likely in a bear market.
Intermediate-Term Market Indicators: The ITBM and ITVM are oversold by bull market standards, but I think we'll probably see much lower readings soon.
Conclusion: The question of the double bottom has not been resolved yet, but the IT Trend Model has us in NEUTRAL, so now is not the time to try to pick a bottom. If the market rallies to new highs, somewhere along the way the Trend Model will kick back over to BUY. In the meantime, I will hold to my assumption that we are in a bear market.
DOLLAR (UUP)
IT Trend Model: SELL as of 12/21/2017
LT Trend Model: SELL as of 5/24/2017
UUP Daily Chart: UUP is once again testing the top of a large falling wedge formation.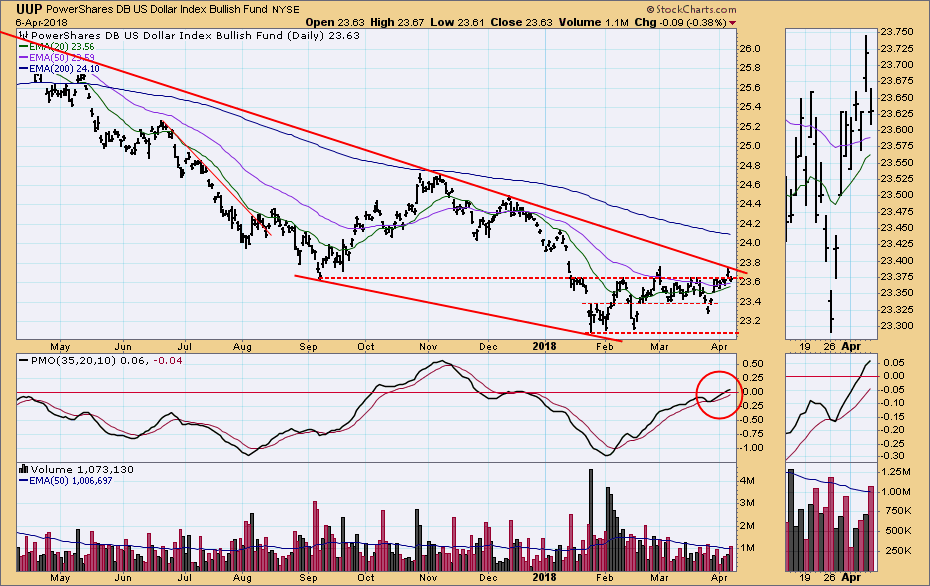
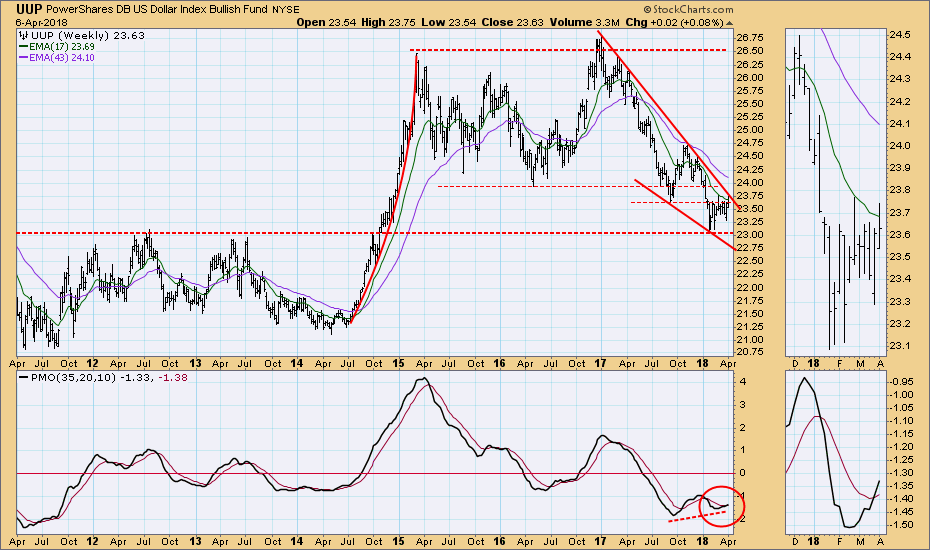
UUP Weekly Chart: The falling wedge is more obvious in this time frame. The weekly PMO is above the signal line and rising, so I think there is a good chance that UUP will break out of the wedge. That will not be a good thing for gold.
GOLD
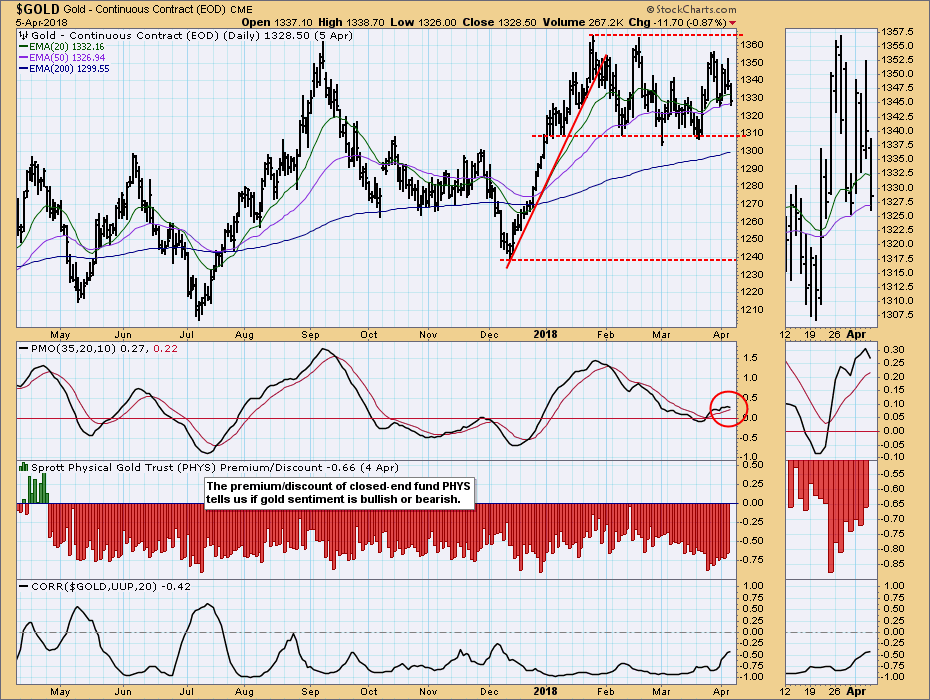
IT Trend Model: BUY as of 1/2/2018
LT Trend Model: BUY as of 4/12/2017
GOLD Daily Chart: Gold has been in a trading range for about three months, and, as a result it is barely hanging on to an IT Trend Model BUY signal.
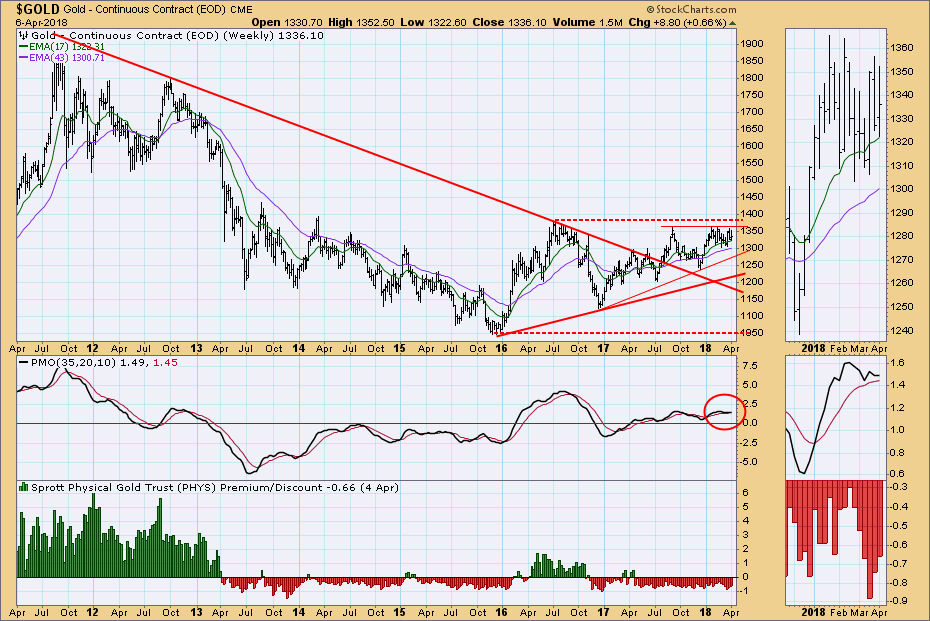
GOLD Weekly Chart: The 17EMA is well above the 43EMA, and the weekly PMO has been flat for several months, so gold remains slightly positive in this time frame.
CRUDE OIL (USO)
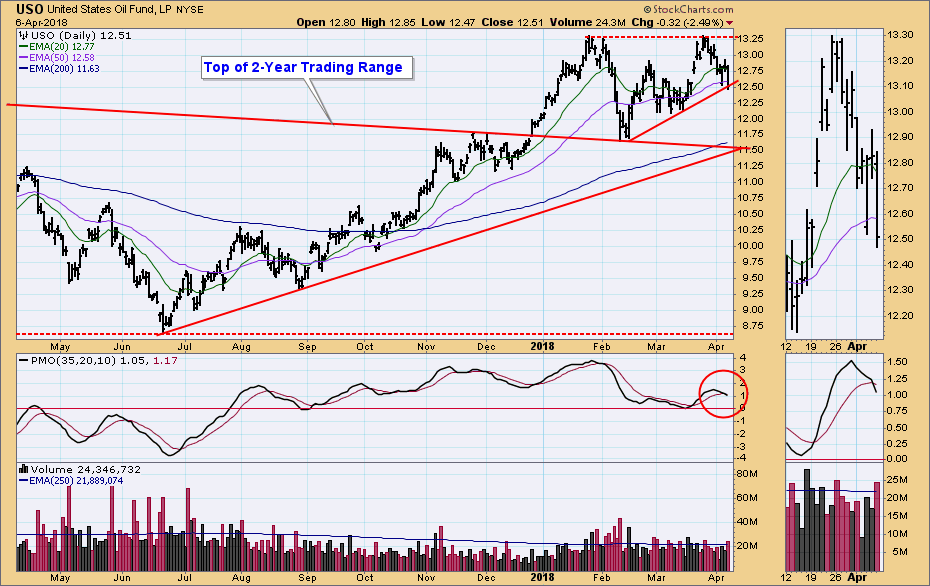
IT Trend Model: BUY as of 9/6/2017
LT Trend Model: BUY as of 11/2/2017
USO Daily Chart: USO has been turned back from 13.30 twice, and the PMO is falling below the signal line. I have to assume that the February low may be retested.
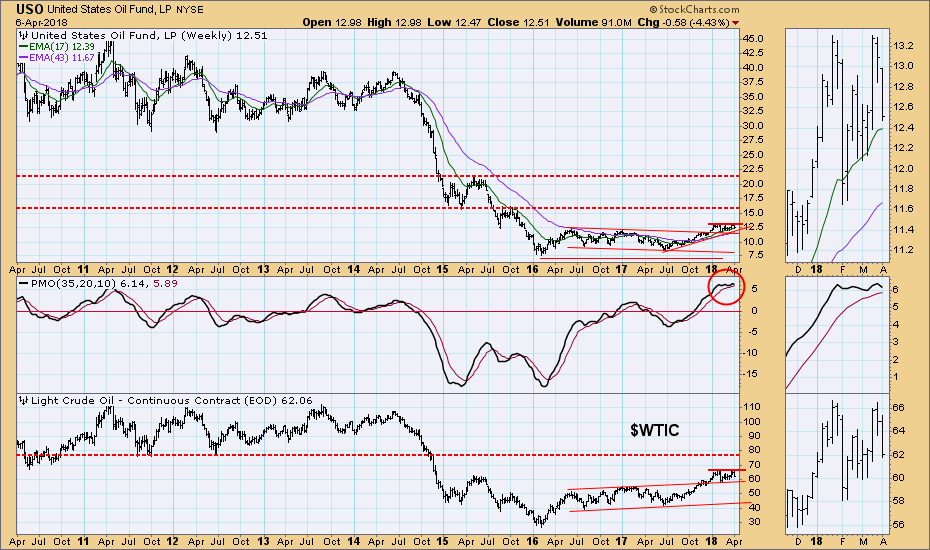
USO Weekly Chart: I like to compare USO and $WTIC because support and resistance on the $WTIC chart help to clarify where USO might go. If the short-term resistance can be overcome, the next significant resistance for $WTIC is at about $78/bbl. This translates to potential upside of about 15.50 for USO. The weekly PMO is overbought and has turned down, which implies lower prices.
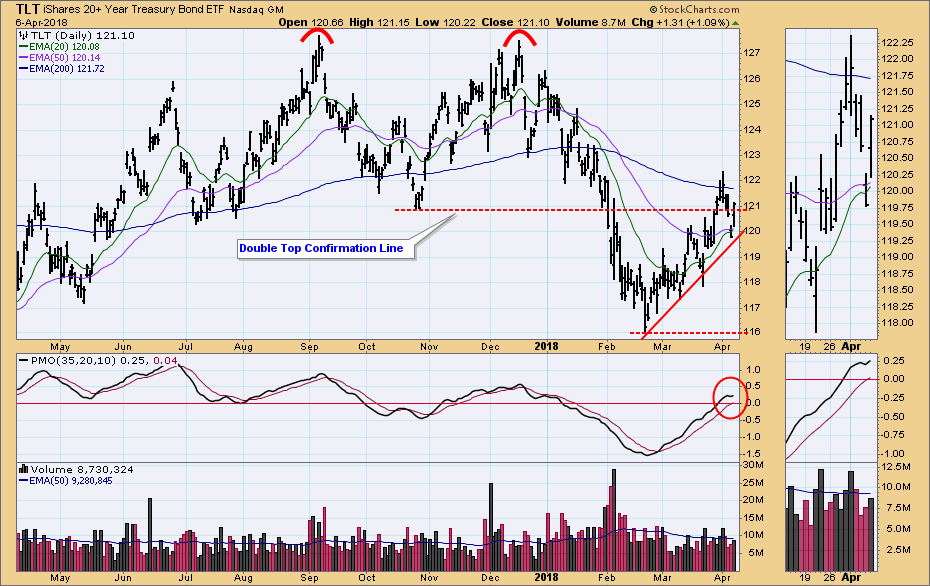
BONDS (TLT)
IT Trend Model: NEUTRAL as of 1/11/2018
LT Trend Model: SELL as of 2/8/2018
TLT Daily Chart: TLT has been making steady upward progress since the February low. The most important issue on the chart is that the 20EMA is close to crossing up through the 50EMA, and an IT Trend Model BUY signal will be generated if that happens.
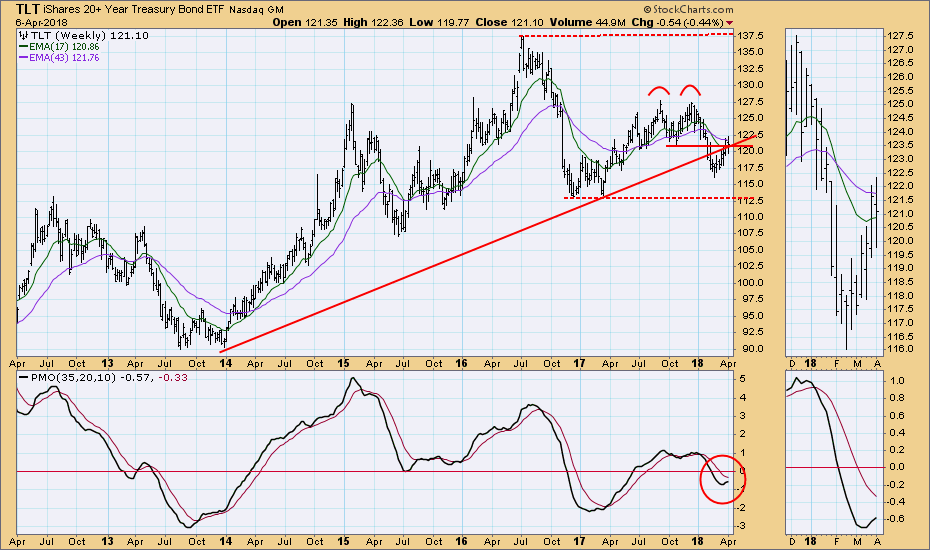
TLT Weekly Chart: In this time frame we can see that TLT has run into significant resistance. The rising weekly PMO is decelerating and may top soon.
**Don't miss any of the DecisionPoint commentaries! Go to the "Notify Me" box toward the end of this blog page to be notified as soon as they are published.**
Technical Analysis is a windsock, not a crystal ball.
Happy Charting!
- Carl
NOTE: The signal status reported herein is based upon mechanical trading model signals, specifically, the DecisionPoint Trend Model. They define the implied bias of the price index based upon moving average relationships, but they do not necessarily call for a specific action. They are information flags that should prompt chart review. Further, they do not call for continuous buying or selling during the life of the signal. For example, a BUY signal will probably (but not necessarily) return the best results if action is taken soon after the signal is generated. Additional opportunities for buying may be found as price zigzags higher, but the trader must look for optimum entry points. Conversely, exit points to preserve gains (or minimize losses) may be evident before the model mechanically closes the signal.
Helpful DecisionPoint Links:
DecisionPoint Shared ChartList and DecisionPoint Chart Gallery
Price Momentum Oscillator (PMO)
Swenlin Trading Oscillators (STO-B and STO-V)
