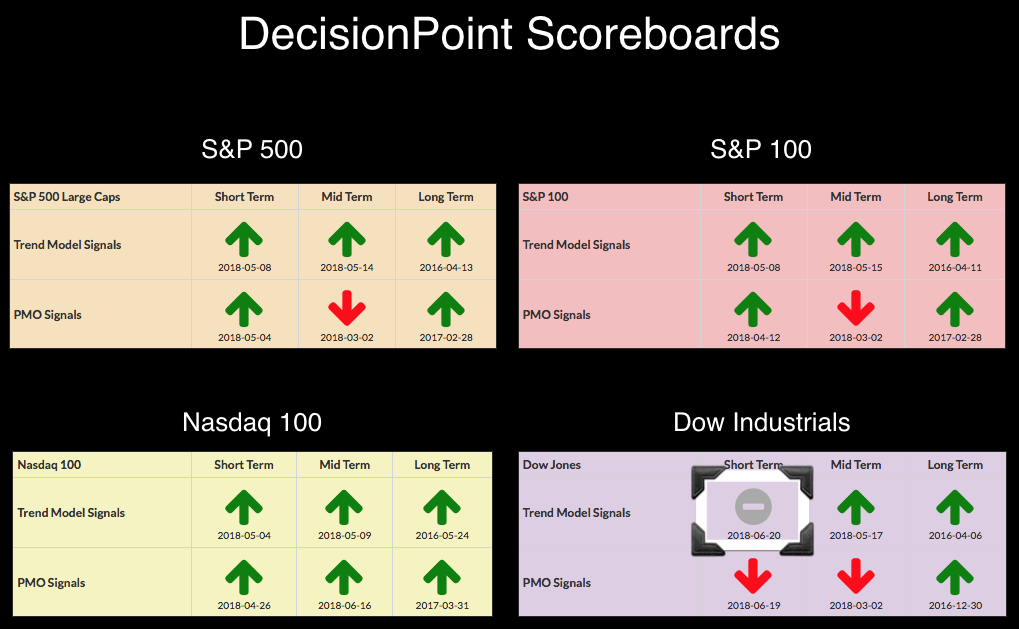
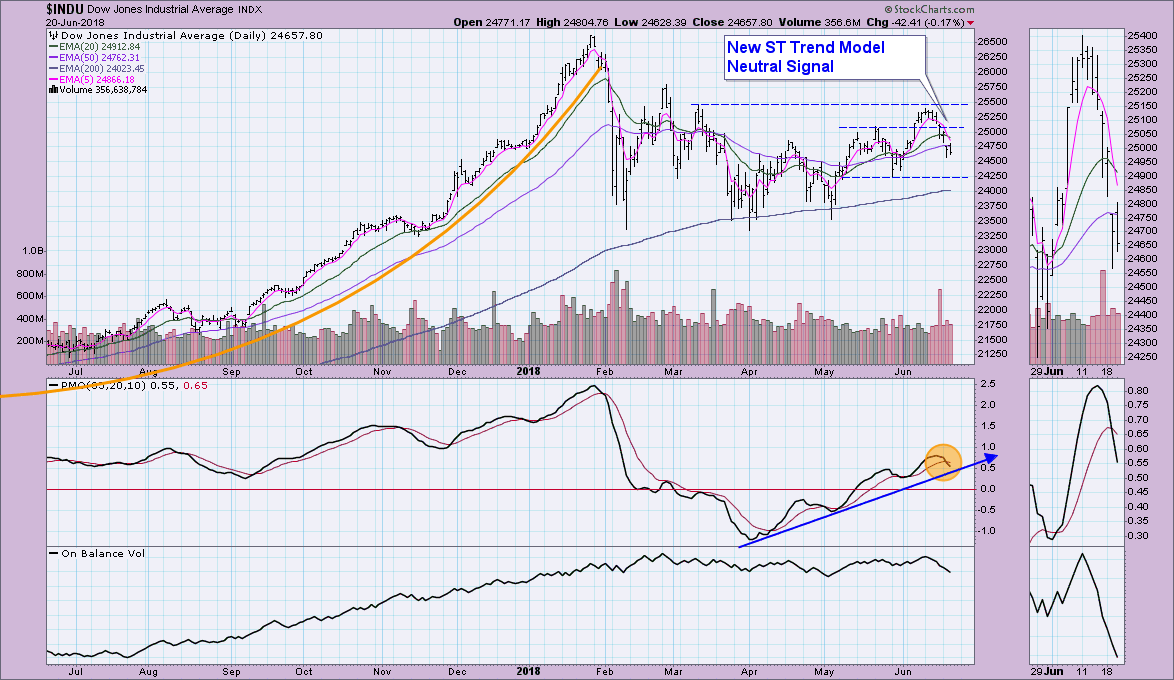
 Yesterday the Dow lost its PMO BUY signal and today it's lost its Short-Term Trend Model BUY signal. Looking at the NDX Scoreboard sitting next to the Dow Scoreboard, a bifurcated market between NDX and Dow. Both the NDX and Russell 2000 continue to set new all-time highs and yet the Dow is failing.
The DecisionPoint Weekly Wrap presents an end-of-week assessment of the trend and condition of the stock market (S&P 500), the U.S. Dollar, Gold, Crude Oil, and Bonds.
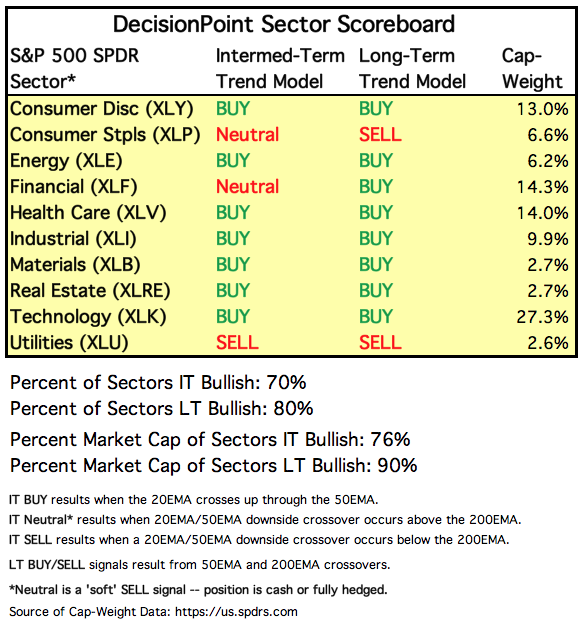
SECTORS
Each S&P 500 Index component stock is assigned to one, and only one, of 10 major sectors. This is a snapshot of the Intermediate-Term and Long-Term Trend Model signal status for those sectors.
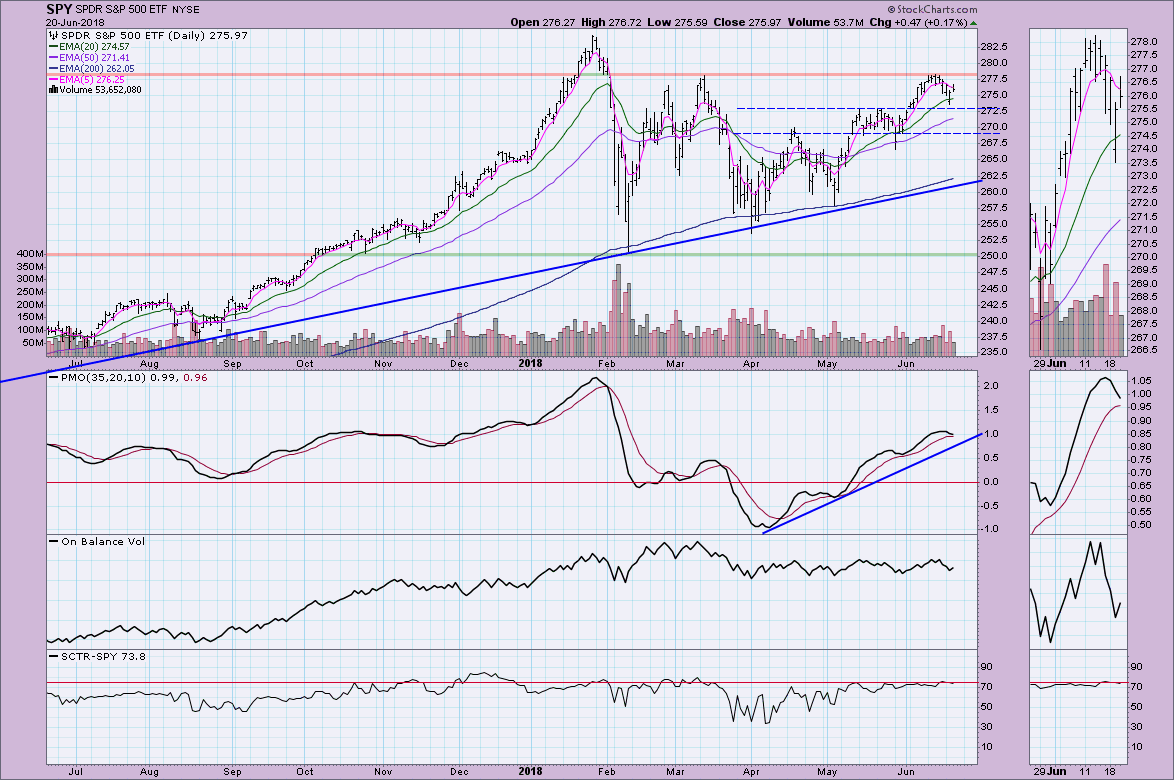
STOCKS
IT Trend Model: BUY as of 5/11/2018
LT Trend Model: BUY as of 4/1/2016
SPY Daily Chart: After unsuccessfully challenging the March high, the SPY turned back down. However, when it hit very short-term support along May tops, it bounced back. The PMO is about ready for a negative crossover, but overall, it is still trending higher. If this bounce cannot be sustained or there is another failed test of overhead resistance, we could see a pullback toward the April top. If the PMO breaks its rising trend line, I'll expect a drop to test support at $270.
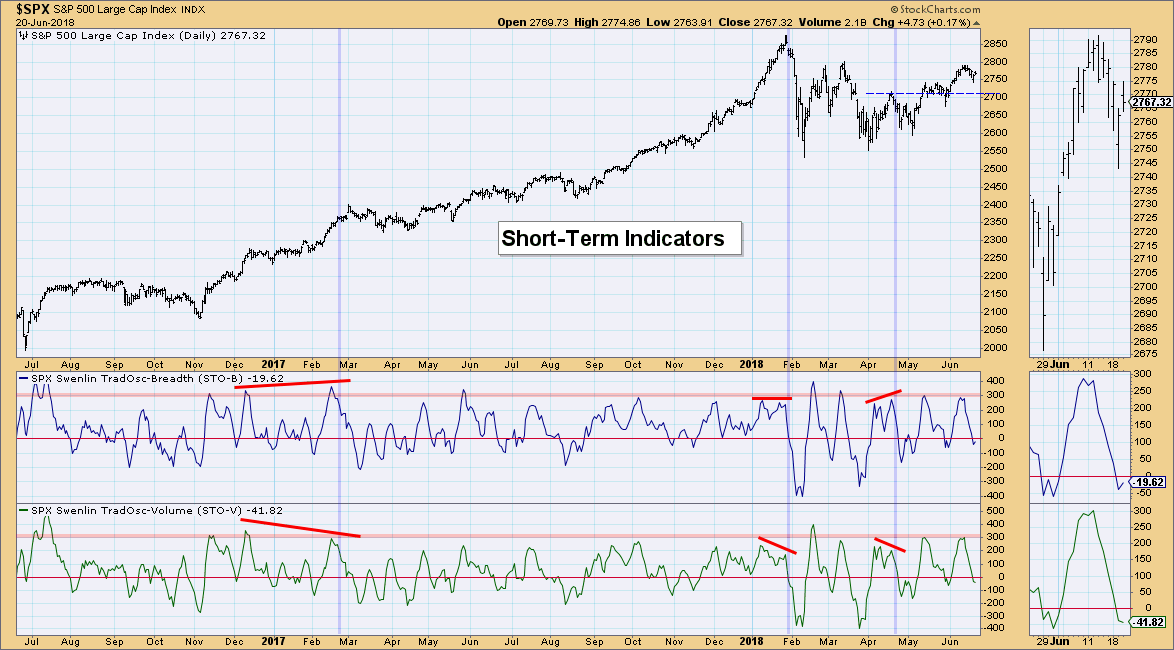
Short-Term Market Indicators: These indicators are in prime territory for an upside reversal. I just wonder if the market has enough internal strength to get it rolling back up. We do see the STO-B has ticked up and the STO-V decelerated today.
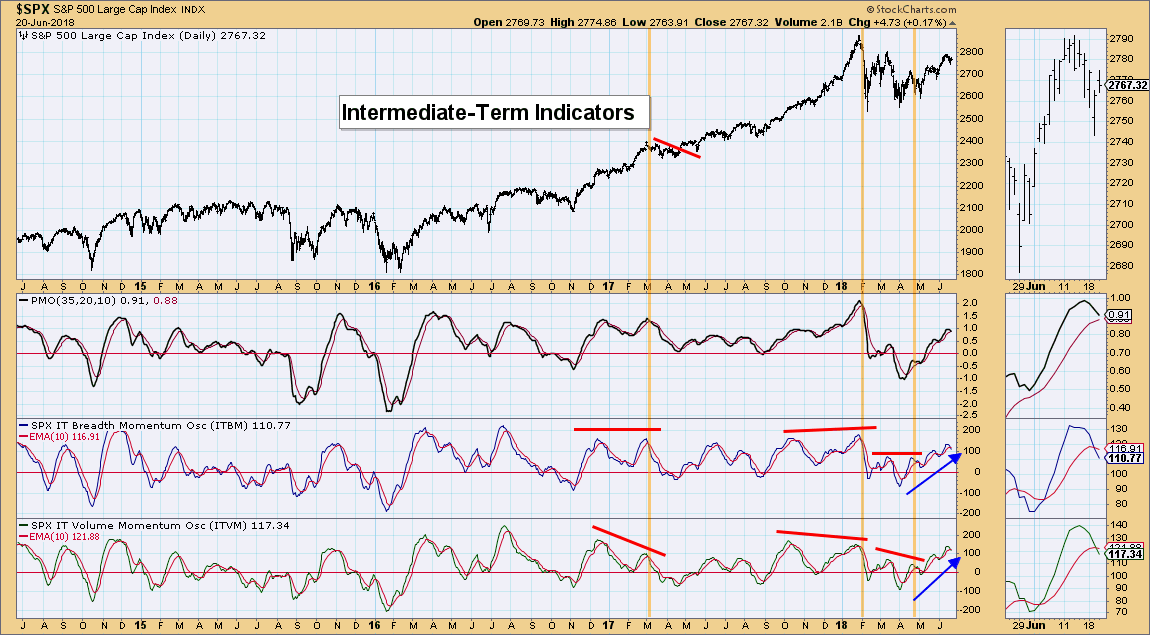
Intermediate-Term Market Indicators: We got the negative crossovers on the ITBM and ITVM but like the PMO on the SPY daily chart, a rising trend is still being preserved. If that trend begins breaking down, a pullback is likely.
Conclusion: Momentum is failing on the SPY and has already failed on the Dow. The NDX and small-caps are making new all-time highs this week, so it's hard to imagine that the SPX won't hop on for the ride. ST indicators are angling up so a short-term rally is a possibility. Unfortunately the intermediate-term indicators are showing weakness. The PMO and ITBM/ITVM need to maintain their rising trend.
DOLLAR (UUP)
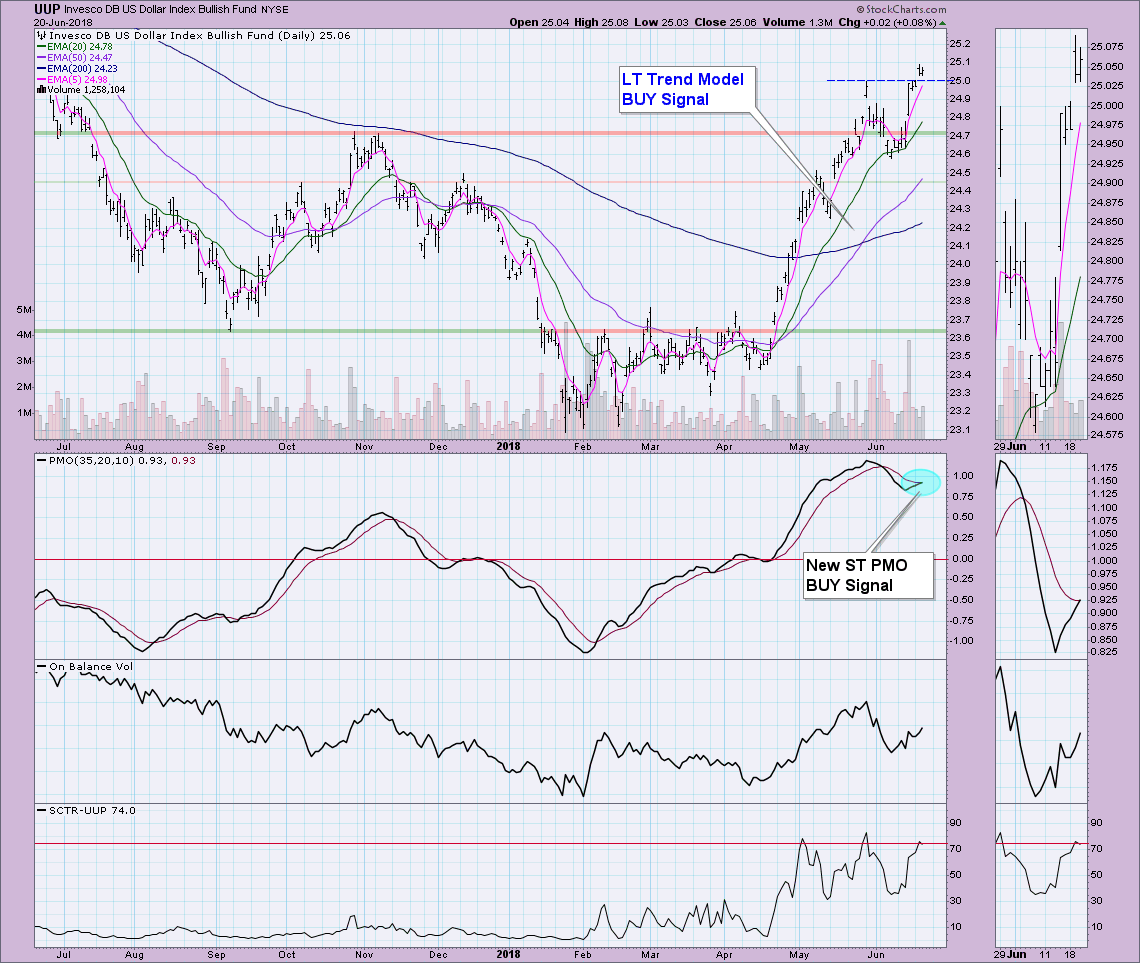
IT Trend Model: BUY as of 4/24/2018
LT Trend Model: BUY as of 5/25/2018
UUP Daily Chart: UUP actually came up on my scan when I was finding my "Monday Set-Ups" for the MarketWatchers LIVE show. Timing was great as UUP gapped up promptly after. The PMO BUY signal confirms the rise. My concerns are the PMO getting somewhat overbought and the possibility of a reverse island formation. However, the OBV and SCTR are very healthy so I don't think this rally is over.
GOLD
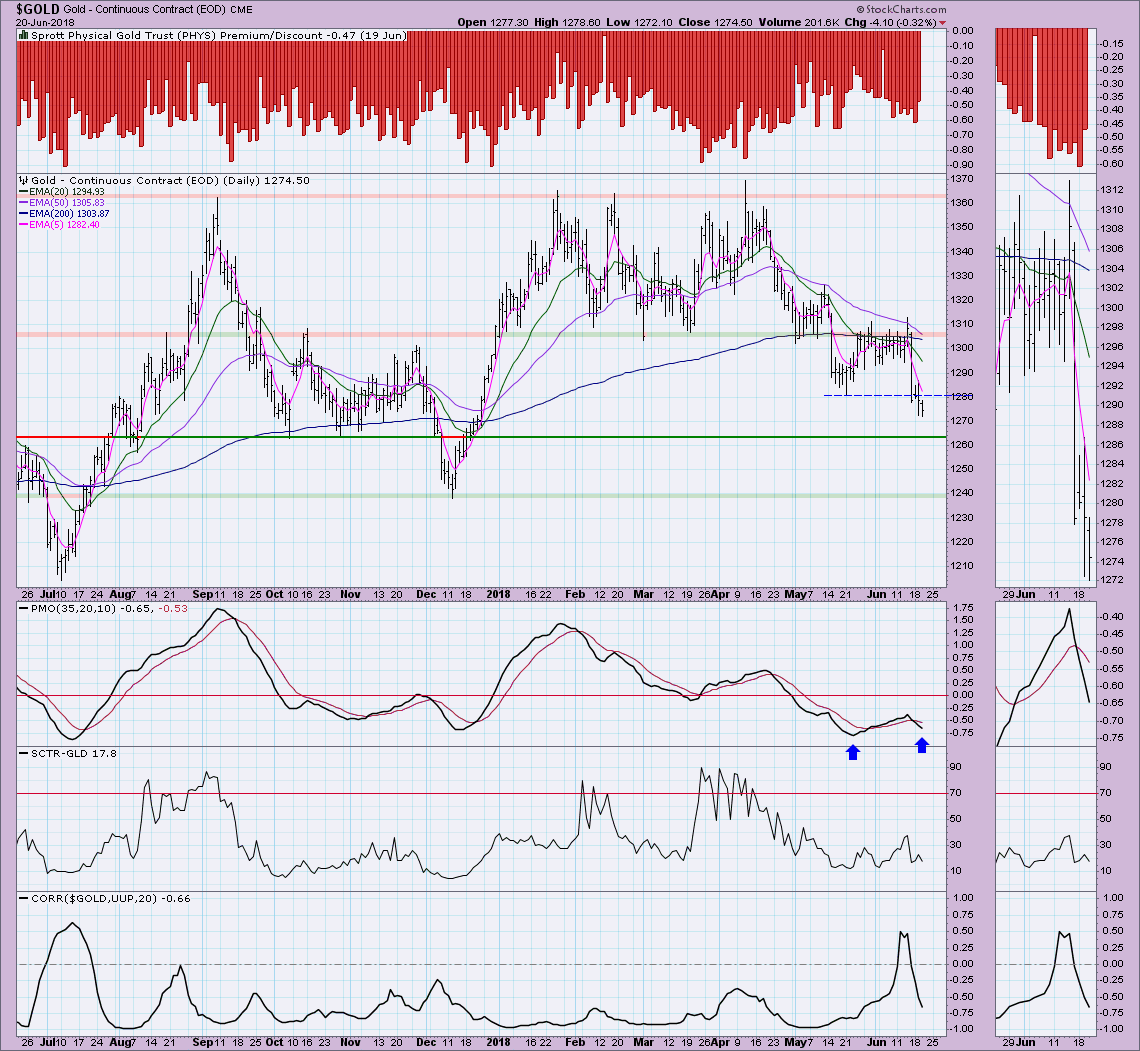
IT Trend Model: Neutral as of 5/2/2018
LT Trend Model: BUY as of 4/12/2017
GOLD Daily Chart: Gold continues to struggle and today traded below what was short-term support. The PMO SELL signal suggests the decline will continue. If the PMO can somehow bottom before it reaches the previous low, it would set up a positive divergence. Note that in the very short term, the correlation between Gold and the Dollar has reverted back to a strong negative correlation. The Dollar is primed to move higher, so the expectation should be that Gold will decline further.
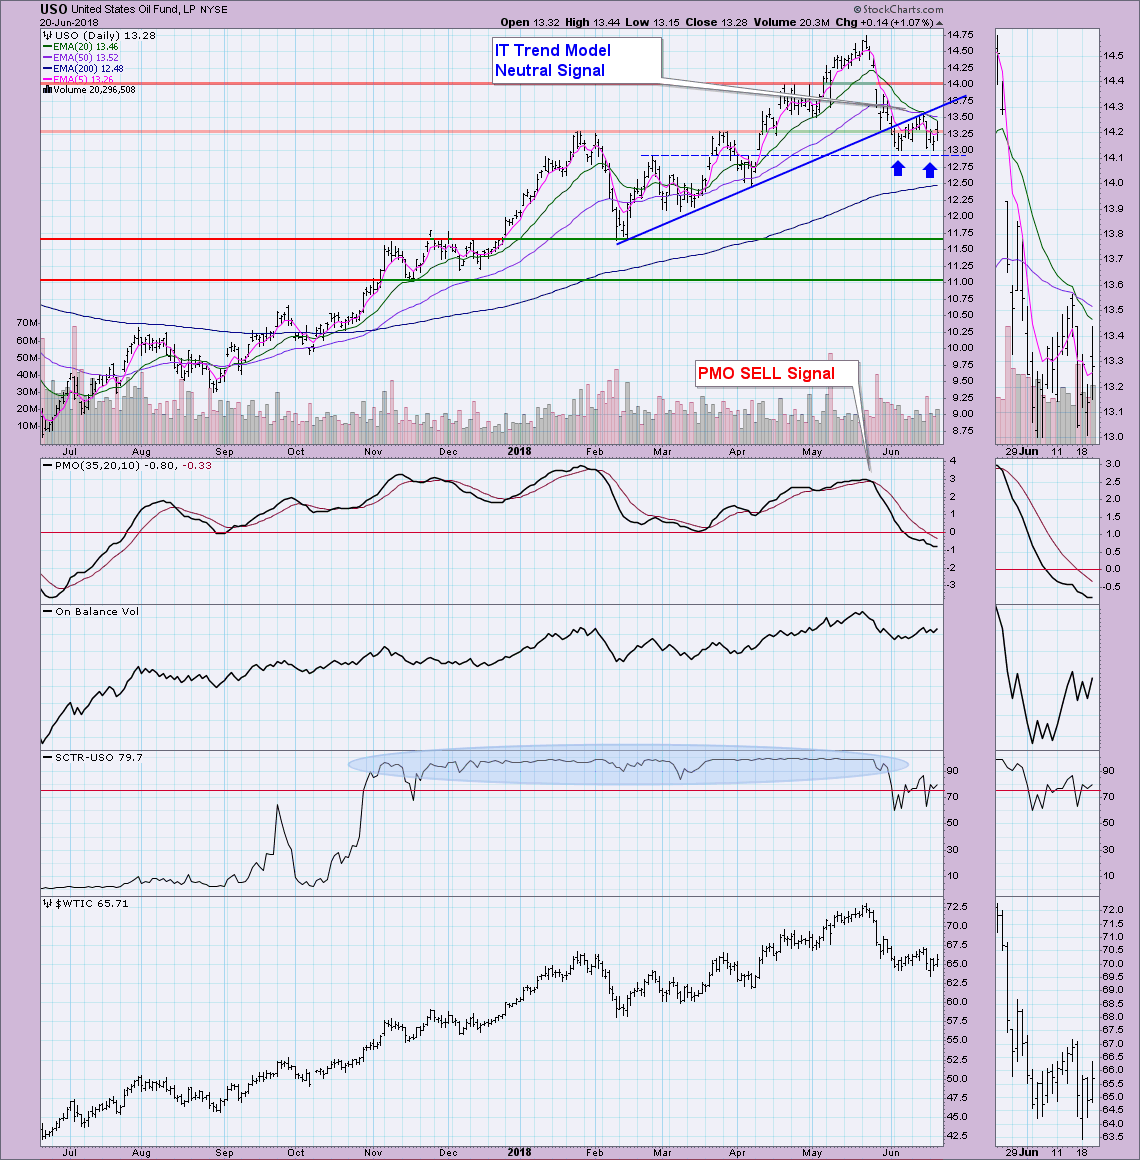
CRUDE OIL (USO)
IT Trend Model: Neutral as of 6/17/2018
LT Trend Model: BUY as of 11/2/2017
USO Daily Chart: A short-term double bottom is setting up. Execution will require a move back above the rising trendline and it will have the winds of the new Intermediate-Term Trend Model Neutral signal. Momentum appears to be shifting bullish and the SCTR is back in the "hot zone" so I am leaning bullish despite the IT Neutral signal.
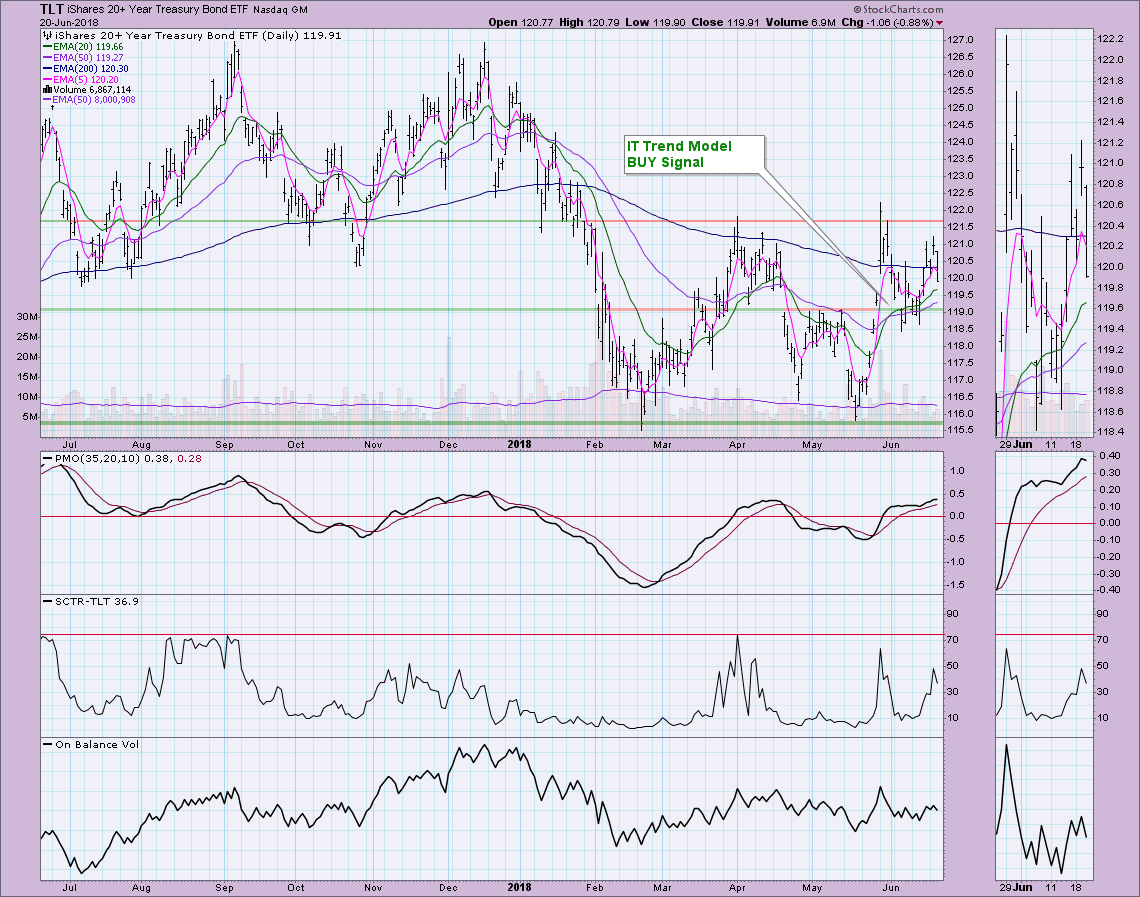
BONDS (TLT)
IT Trend Model: BUY as of 6/1/2018
LT Trend Model: SELL as of 2/8/2018
TLT Daily Chart: Choppy and volatile trading continues for TLT. The IT Trend Model BUY signal is holding up, but the PMO is again trying to move lower. With rising interest rates, we should see TLT weaken. At this point, the technicals aren't as worrisome as they could be, but I would still expect to see TLT fall below $119.
Technical Analysis is a windsock, not a crystal ball.
Happy Charting!
- Erin
**Don't miss any of the DecisionPoint commentaries! Go to the "Notify Me" box toward the end of this blog page to be notified as soon as they are published.**
NOTE: The signal status reported herein is based upon mechanical trading model signals, specifically, the DecisionPoint Trend Model. They define the implied bias of the price index based upon moving average relationships, but they do not necessarily call for a specific action. They are information flags that should prompt chart review. Further, they do not call for continuous buying or selling during the life of the signal. For example, a BUY signal will probably (but not necessarily) return the best results if action is taken soon after the signal is generated. Additional opportunities for buying may be found as price zigzags higher, but the trader must look for optimum entry points. Conversely, exit points to preserve gains (or minimize losses) may be evident before the model mechanically closes the signal.
Helpful DecisionPoint Links:
DecisionPoint Shared ChartList and DecisionPoint Chart Gallery
Price Momentum Oscillator (PMO)
Swenlin Trading Oscillators (STO-B and STO-V)
