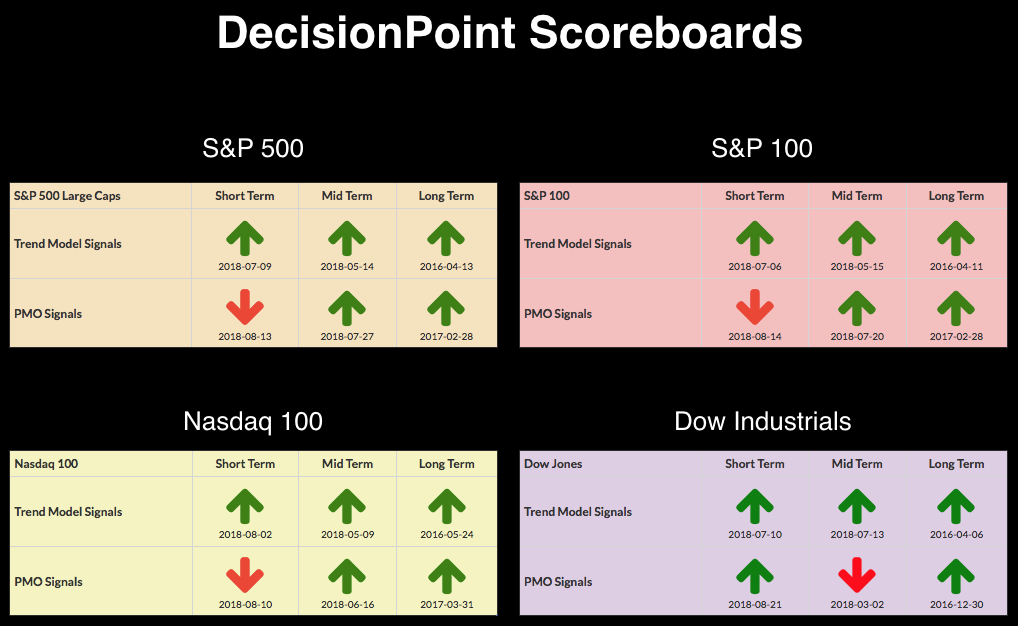
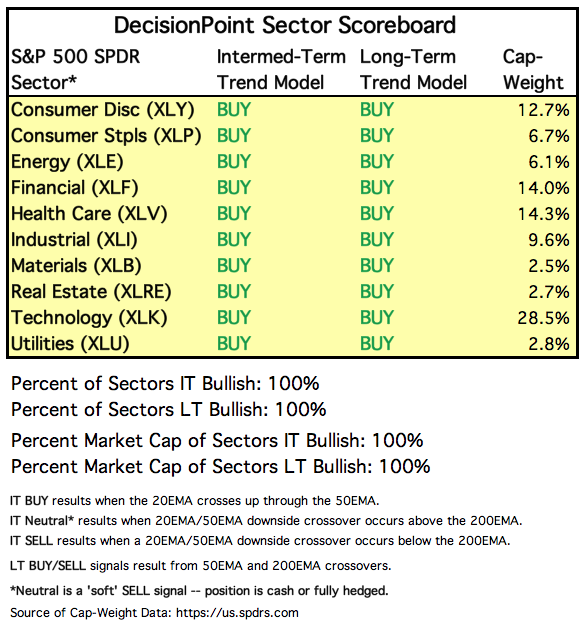
 We've now entered the longest bull market on record when counted from the 2009 lows to the highs of yesterday. While there are mixed opinions whether it will hold up much longer, our DP Scoreboards and intermediate-term indicators are still far too bullish to put me in the imminent bear market camp. Additionally, look closely at our Sector Signal Table below. Every sector is currently on a BUY signal in the intermediate and long terms. However, when I look at the shorter term, I do see weakness and likely problems for the next week or more.
The DecisionPoint Alert presents an mid-week assessment of the trend and condition of the stock market (S&P 500), the U.S. Dollar, Gold, Crude Oil, and Bonds.
SECTORS
Each S&P 500 Index component stock is assigned to one, and only one, of 10 major sectors. This is a snapshot of the Intermediate-Term and Long-Term Trend Model signal status for those sectors.
STOCKS
IT Trend Model: BUY as of 5/11/2018
LT Trend Model: BUY as of 4/1/2016
SPY Daily Chart: After hitting new all-time highs yesterday, the SPY pulled back slightly today. I noticed a short-term rising trend channel in the middle of the longer-term rising trend channel. After testing the top of the short-term trend channel, price is poised to pull back toward the bottom in the short term. The PMO is rising still and I suspect the SPY and SPX will be switching to PMO BUY signals soon, but I suspect we'll have to workout current overbought conditions first.
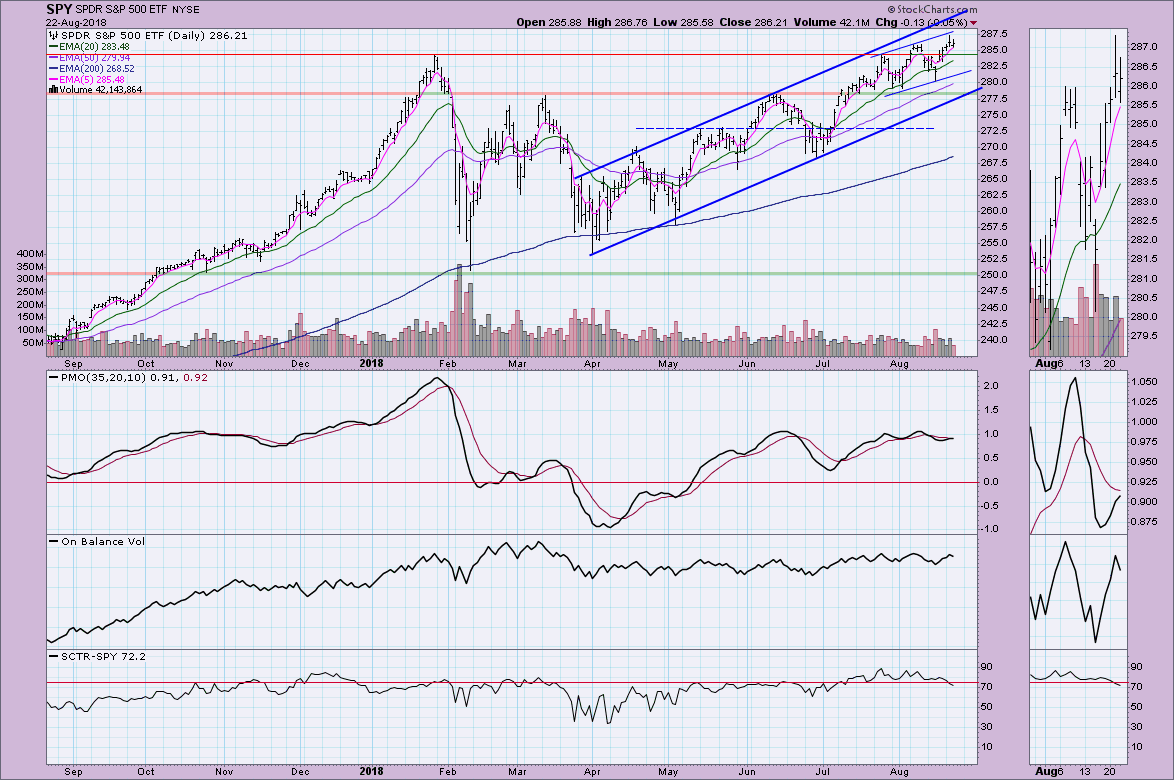
Climactic Market Indicators: Breadth is in a negative divergence with price and I believe the pullback today is a result of that disconnect. I don't think it is over just yet.
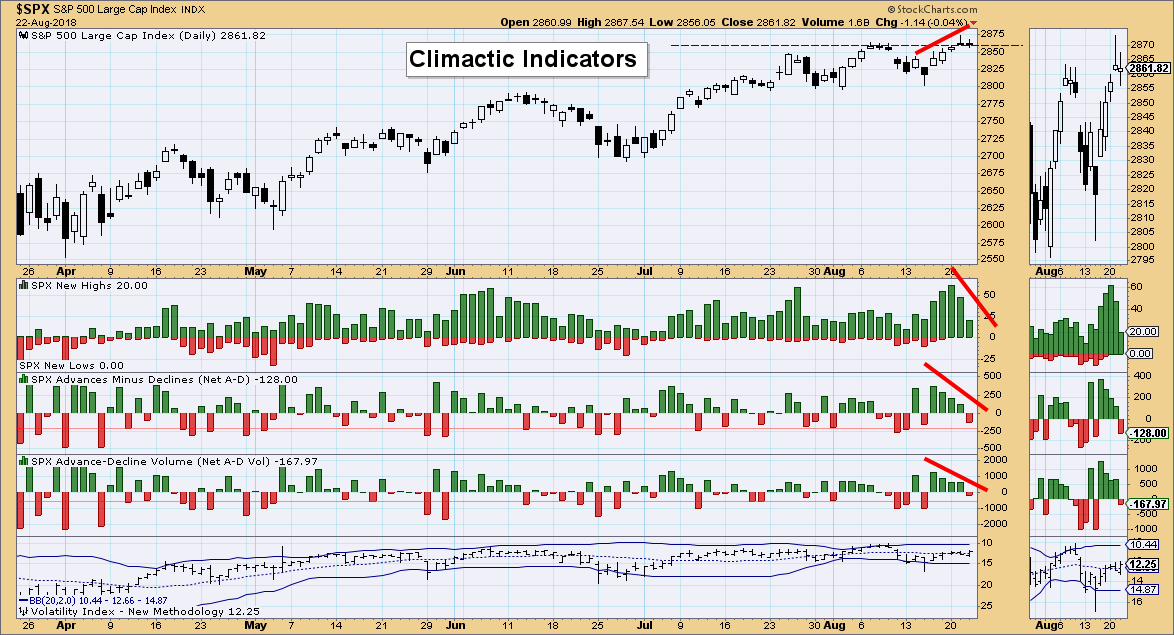
Short-Term Market Indicators: We now have very overbought short-term indicators and like the negative divergence with breadth above, this points to lower prices over the next week.
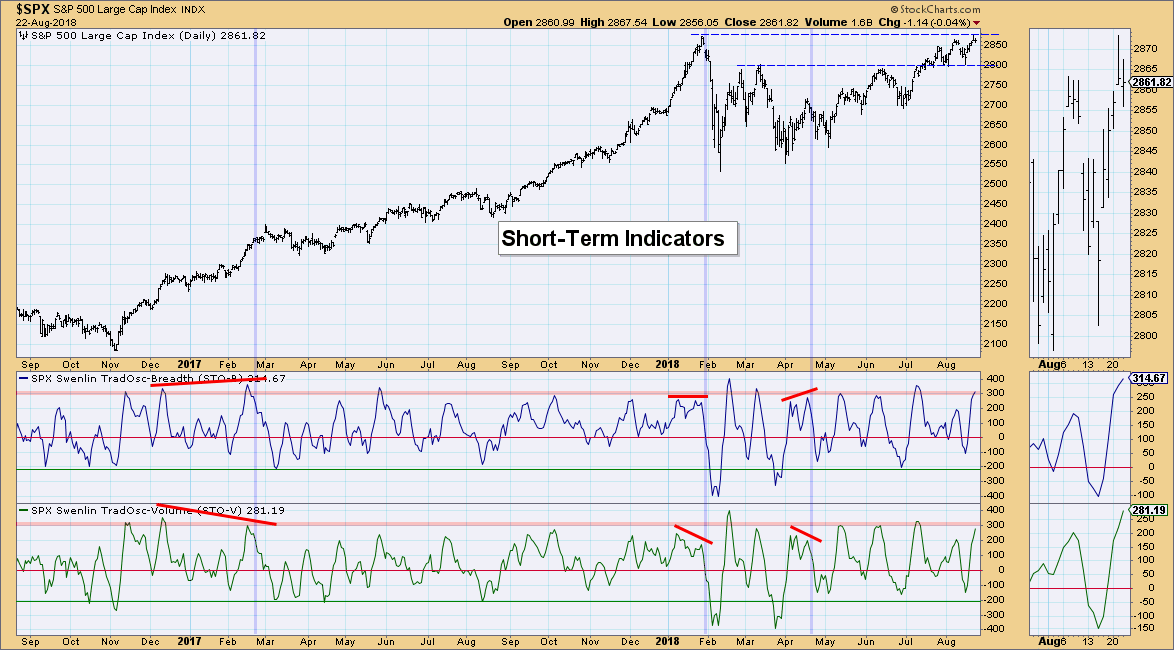
Intermediate-Term Market Indicators: These indicators aren't quite so bearish. They are rising again and have popped back above their signal lines. I'm watching to see if those declining tops trendlines will be broken. I'd feel more confident in their bullishness if we see that declining trend broken on both the ITBM and ITVM.
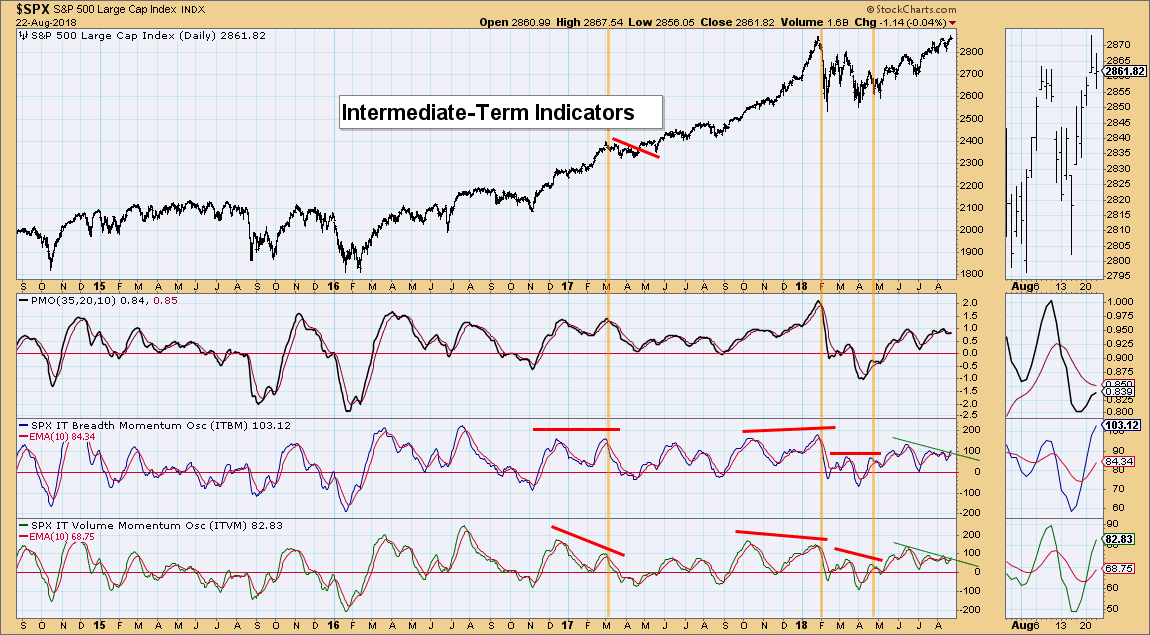
Conclusion: The short term is lined up for a decline or pullback. I'm not looking for a correction at this point given that intermediate-term indicators are still healthy and there is a PMO BUY signal waiting in the wings on the SPY.
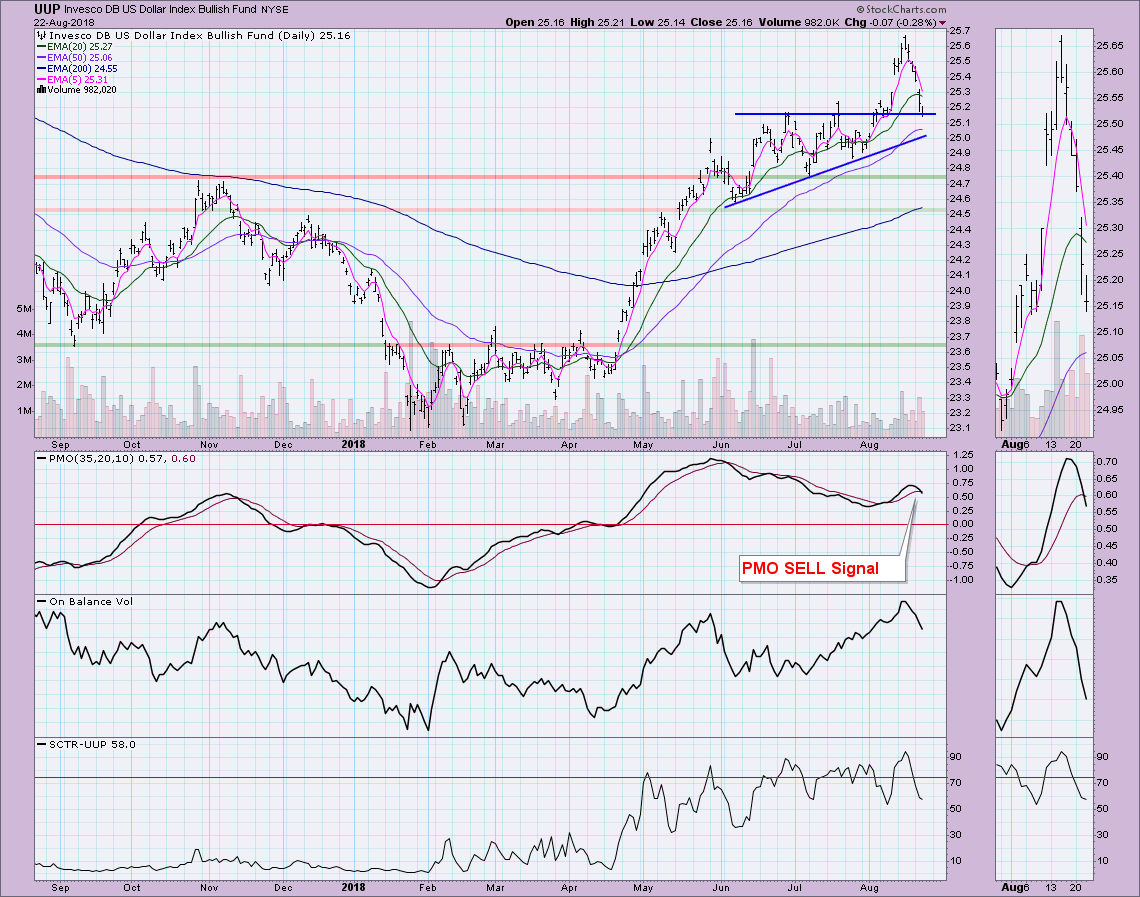
DOLLAR (UUP)
IT Trend Model: BUY as of 4/24/2018
LT Trend Model: BUY as of 5/25/2018
UUP Daily Chart: After completing the ascending triangle pattern, topping at the minimum upside target at about $25.70, the Dollar is pulling back considerably. It has now reached support that should hold. If not, the rising bottoms trendline could provide support. The new PMO SELL signal does suggest more downside ahead, but I suspect it should find support soon around $25 or worst case, a drop to $24.75.
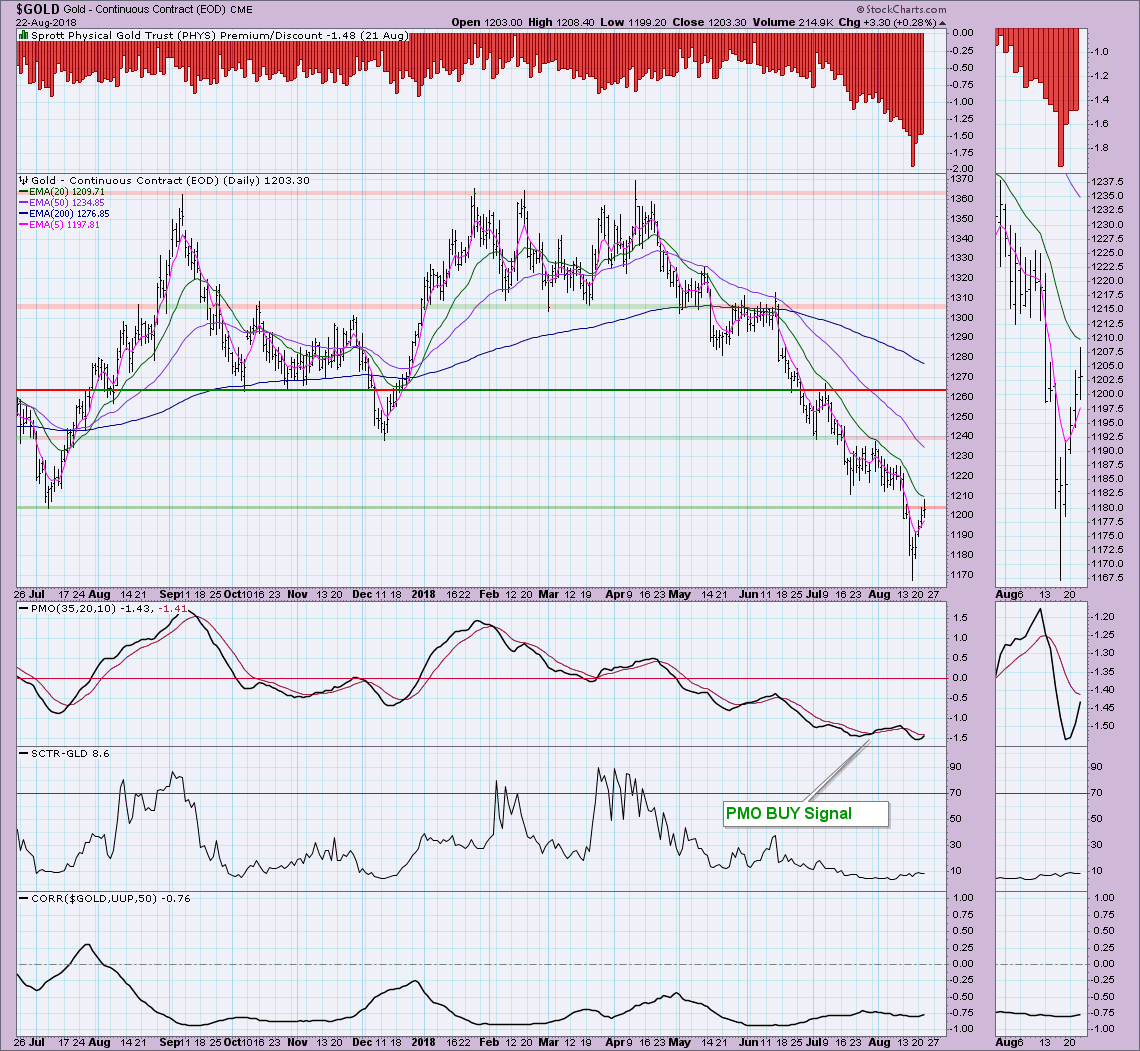
GOLD
IT Trend Model: Neutral as of 5/2/2018
LT Trend Model: SELL as of 6/22/2018
GOLD Daily Chart: Gold found a resurgence with the breakdown of the Dollar and actually managed a close above $1200. Bearish sentiment is still very strong, but I am not looking for more than a short-term continuation of this rally given the Dollar is ready to make a turn. Best case is a rally continuation above $1220 (about halfway into the previous trading channel or a resumption of the decline past previous support at the recent low.
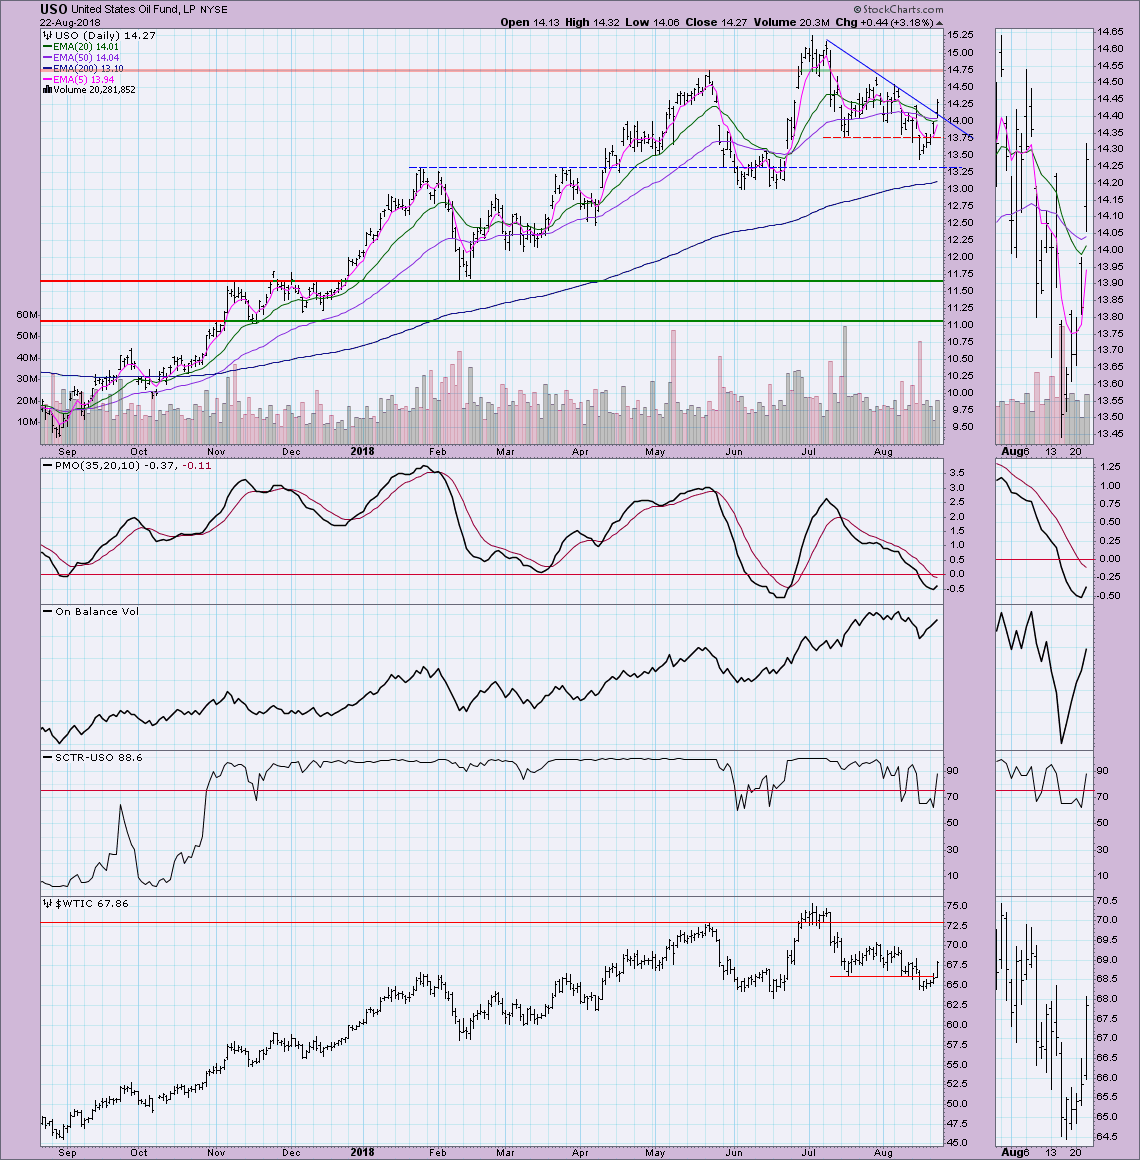
CRUDE OIL (USO)
IT Trend Model: Neutral as of 8/16/2018
LT Trend Model: BUY as of 11/2/2017
USO Daily Chart: The recent PMO BUY signal combined with today's nice breakout above a short-term declining tops line suggests higher prices for Oil. For USO I'd be looking for a move to $14.75 soon.
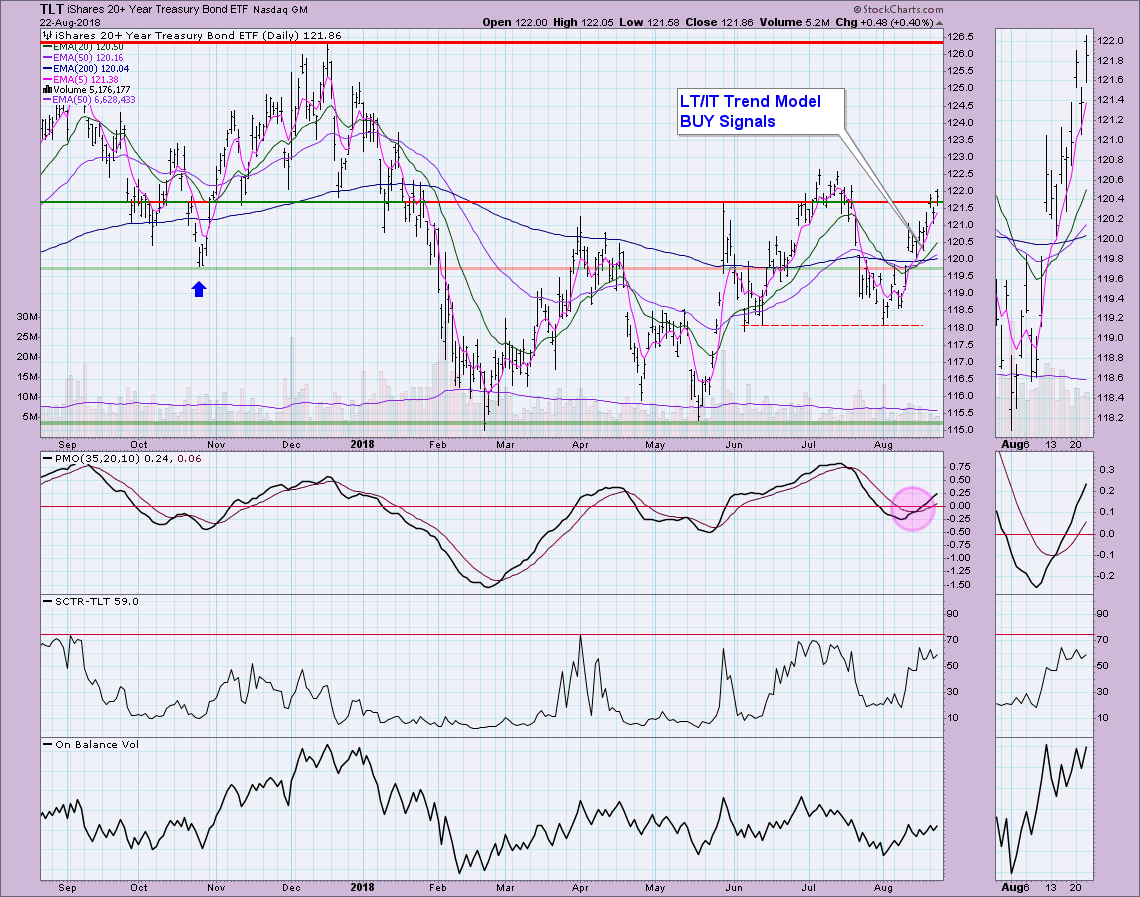
BONDS (TLT)
IT Trend Model: BUY as of 8/15/2018
LT Trend Model: BUY as of 8/20/2018
TLT Daily Chart: The Trend Models are telling us that Bonds are ready to breakout and move past resistance at the July tops. The PMO agrees with the recent BUY signal and strong rise. I can't argue with these trends and conditions, so I'll look for a move to about $123.
Technical Analysis is a windsock, not a crystal ball.
Happy Charting!
- Erin
**Don't miss any of the DecisionPoint commentaries! Go to the "Notify Me" box toward the end of this blog page to be notified as soon as they are published.**
NOTE: The signal status reported herein is based upon mechanical trading model signals, specifically, the DecisionPoint Trend Model. They define the implied bias of the price index based upon moving average relationships, but they do not necessarily call for a specific action. They are information flags that should prompt chart review. Further, they do not call for continuous buying or selling during the life of the signal. For example, a BUY signal will probably (but not necessarily) return the best results if action is taken soon after the signal is generated. Additional opportunities for buying may be found as price zigzags higher, but the trader must look for optimum entry points. Conversely, exit points to preserve gains (or minimize losses) may be evident before the model mechanically closes the signal.
Helpful DecisionPoint Links:
DecisionPoint Shared ChartList and DecisionPoint Chart Gallery
Price Momentum Oscillator (PMO)
Swenlin Trading Oscillators (STO-B and STO-V)
