 Today I received two bullish email alerts on Natural Gas (UNG). First, the Short-Term Trend Model had triggered a BUY signal. This means the 5-EMA just crossed above the 20-EMA. Second, there was a Short-Term Price Momentum Oscillator (PMO) BUY signal that registered today as well. I hadn't looked at UNG charts in some time and I can see why, they've been anything but interesting. However, the daily, weekly and monthly charts all look quite bullish right now.
Last June I wrote an article about a possible rebirth for XLRE based on the daily and weekly chart PMOs and set-ups. In today's case, I can point to daily, weekly and monthly charts. Let's start with the long term and move in.
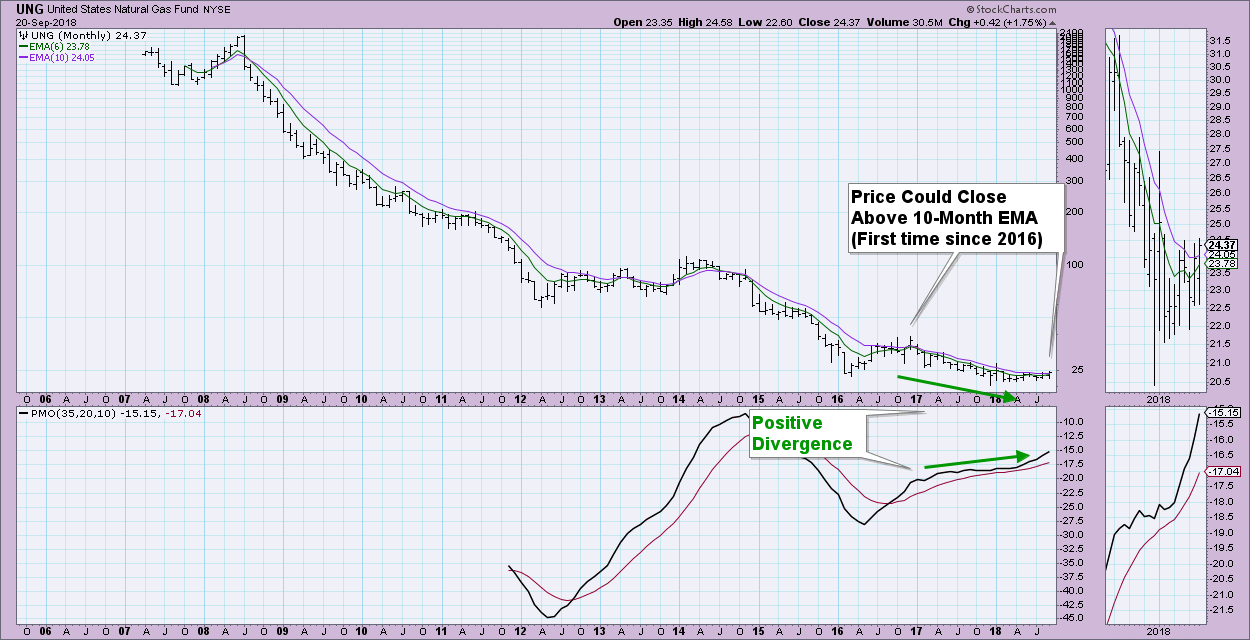
This chart really looks promising. First off, the PMO is rising and on a BUY signal. It also is sporting a very nice positive divergence with price. Take a look in the thumbnail, price is on track to close above the 10-Month EMA. That would be the first time since 2016 that price has closed above that EMA.
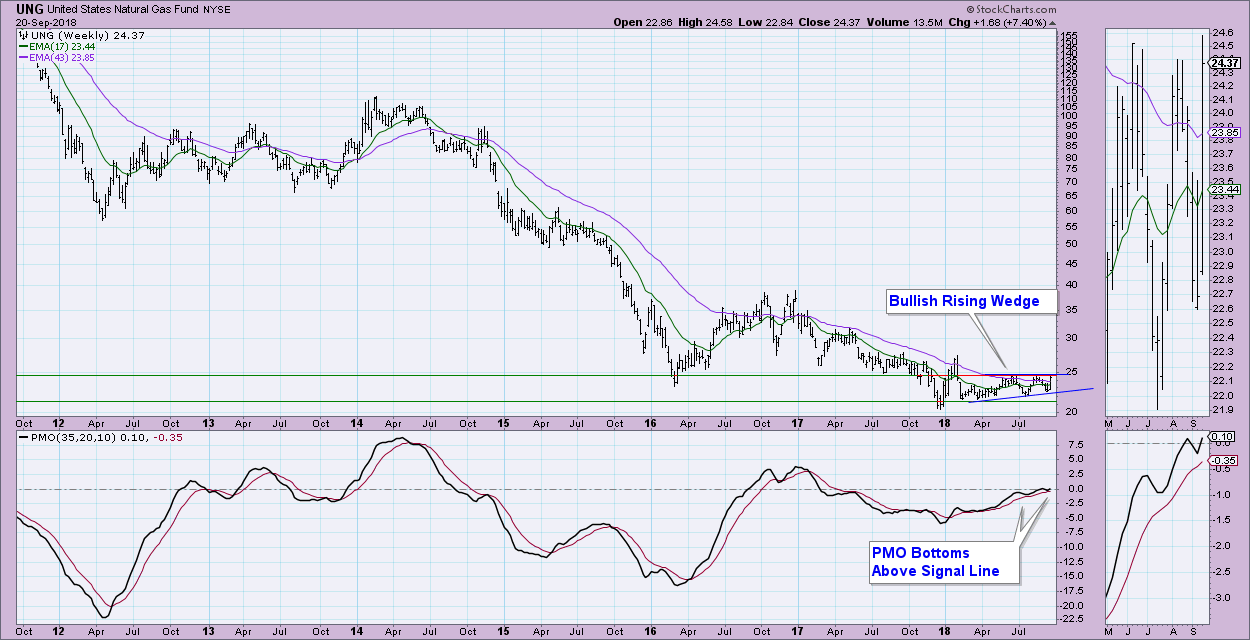
Next up, the weekly chart: The PMO is on a BUY signal and has now kissed the signal line twice before continuing to rise higher. With corresponding price bottoms rising, the PMO is confirming this new move to the upside. I also note a bullish rising wedge pattern that should resolve upward.
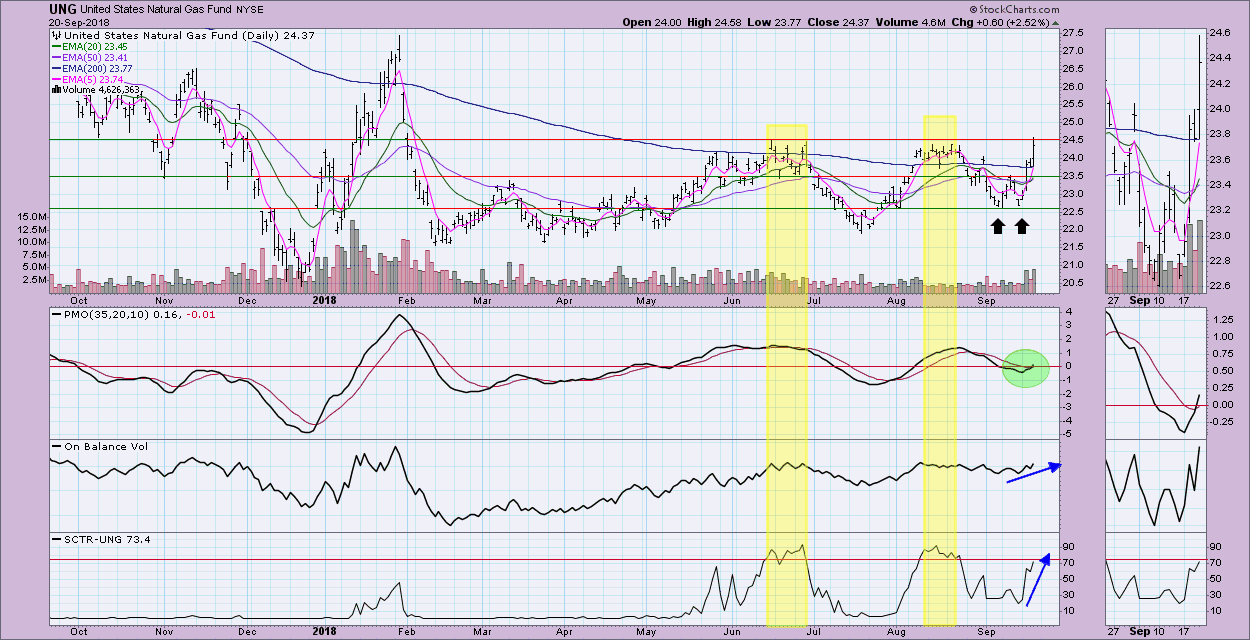
The daily chart is what my email alerted me to look at with the new STTM and PMO BUY signals. I note a short-term double-bottom pattern which executed on Tuesday with the breakout above the confirmation line. While price has reached the upside target, remember that pattern targets are "minimum" upside/downside targets. This area of resistance held tight in June and August, but the indicator picture was quite different. In June the PMO and OBV were flat and the SCTR had already started to move lower after that first test of resistance. In August, while the PMO looked promising, it was near-term overbought and the OBV was flattening out as the SCTR began to decline.
Conclusion: All three time frames are bullish on UNG. If you're a short-term investor, I would probably wait for a throwback off current resistance. For an intermediate-term trade, I'd want to see the breakout.
Technical Analysis is a windsock, not a crystal ball.
Happy Charting!
- Erin
Helpful DecisionPoint Links:
DecisionPoint Shared ChartList and DecisionPoint Chart Gallery
Price Momentum Oscillator (PMO)
Swenlin Trading Oscillators (STO-B and STO-V)
**Don't miss DecisionPoint Commentary! Add your email below to be notified of new updates"**
