 No new changes on the DecisionPoint Scoreboards since last week's PMO BUY signal on the NDX. Hard to believe the OEX and SPX haven't followed suit with the Dow and NDX. The OEX is nearing the BUY signal and should trigger tomorrow barring a large decline. The SPX as you'll see still has a falling PMO, so no new BUY signal anytime soon.
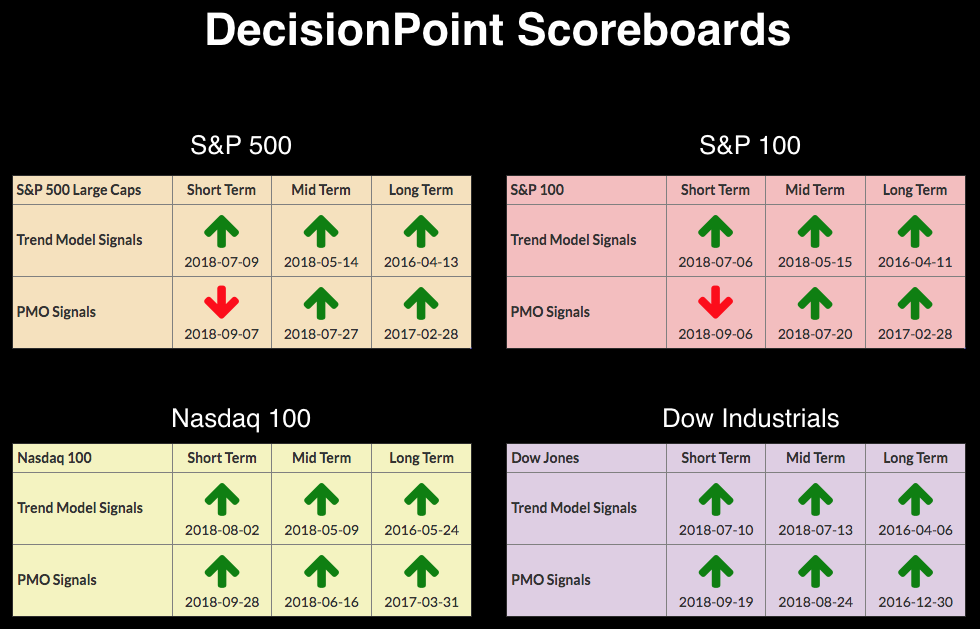
The DecisionPoint Alert presents an mid-week assessment of the trend and condition of the stock market (S&P 500), the U.S. Dollar, Gold, Crude Oil, and Bonds.
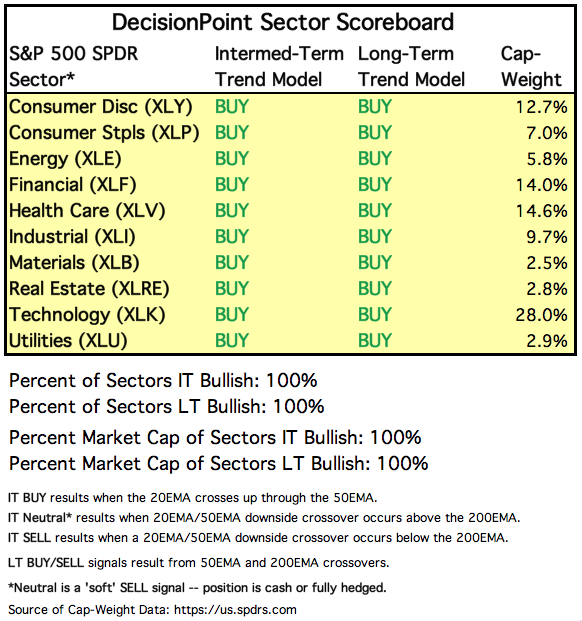
SECTORS
Each S&P 500 Index component stock is assigned to one, and only one, of 10 major sectors. This is a snapshot of the Intermediate-Term and Long-Term Trend Model signal status for those sectors.
STOCKS
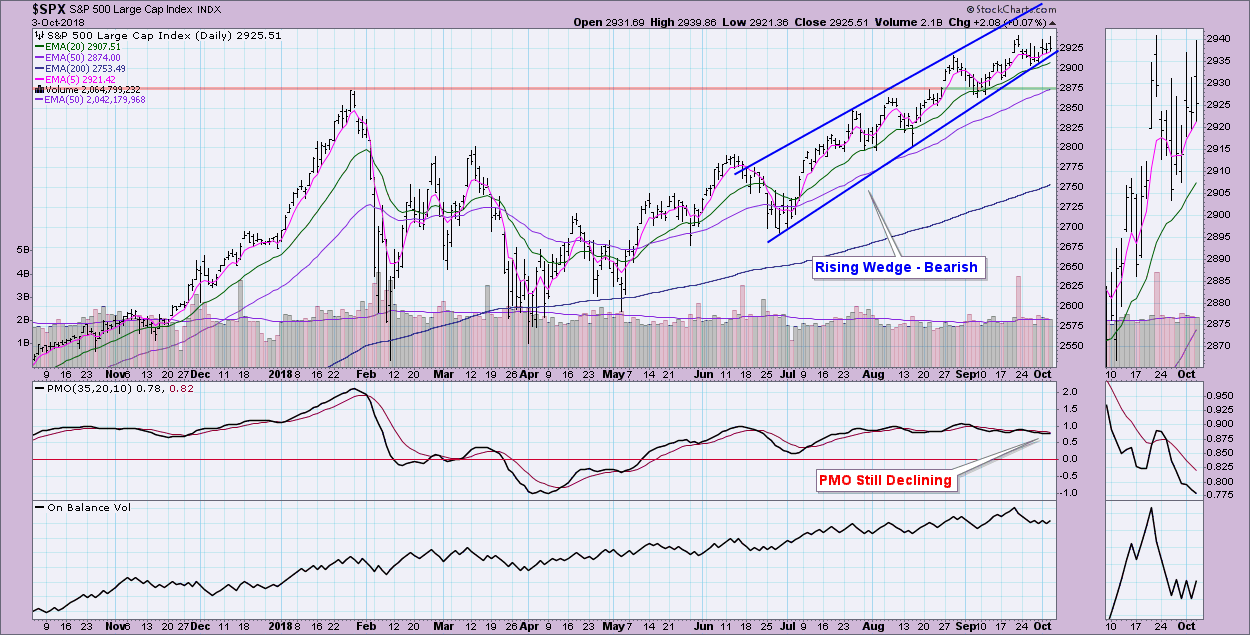
IT Trend Model: BUY as of 5/11/2018
LT Trend Model: BUY as of 4/1/2016
SPX Daily Chart: As I alluded to, the PMO is falling on the SPX and hasn't really decelerated. I've annotated a bearish rising wedge. Price so far has been able to tiptoe up the rising bottoms trendline which forms the base of the wedge. The OBV is flat, suggesting indecision. Err on the side of caution with the SPX.
Short-Term Market Indicators: The good news is that the STOs suggest we should see prices continue to rise. They are sitting in neutral territory and are rising strongly.
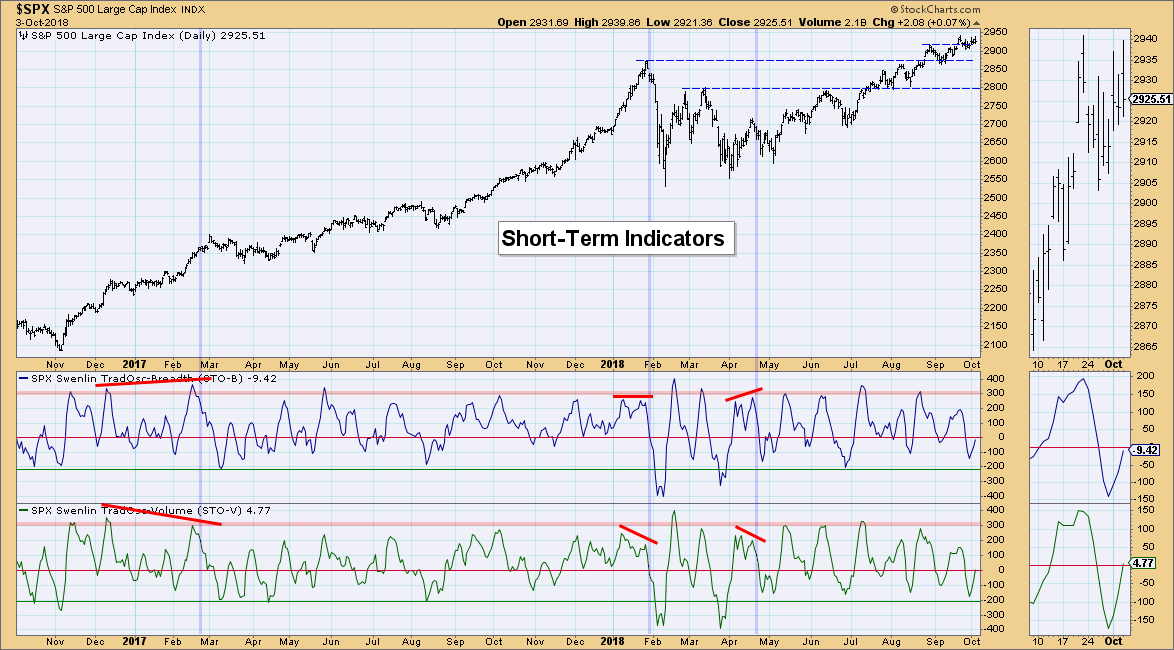
Intermediate-Term Market Indicators: This is where the weakness is reflected on the SPX. These indicators have been in decline since the gap up and this week they have fallen below rising bottoms suggesting the uptrend is in jeopardy in the intermediate term.
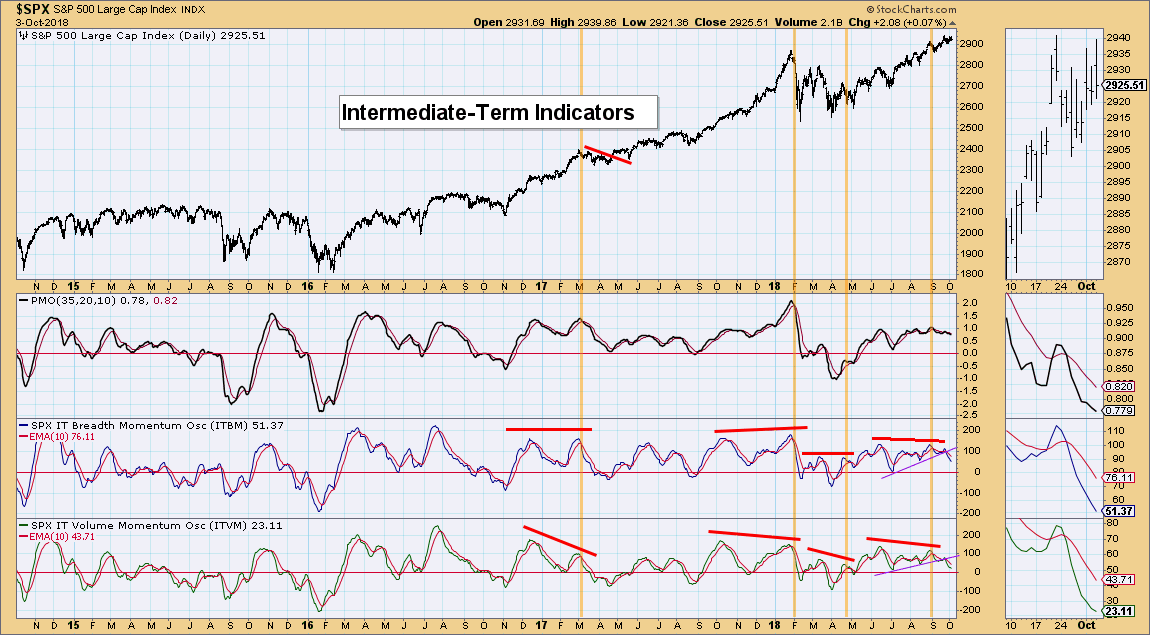
Conclusion: The SPX is the weakest of the four Scoreboard indexes. Short-term indicators are positive, but the declining PMO and ITBM/ITVM suggest there are still problems in the intermediate term.
DOLLAR (UUP)
IT Trend Model: BUY as of 4/24/2018
LT Trend Model: BUY as of 5/25/2018
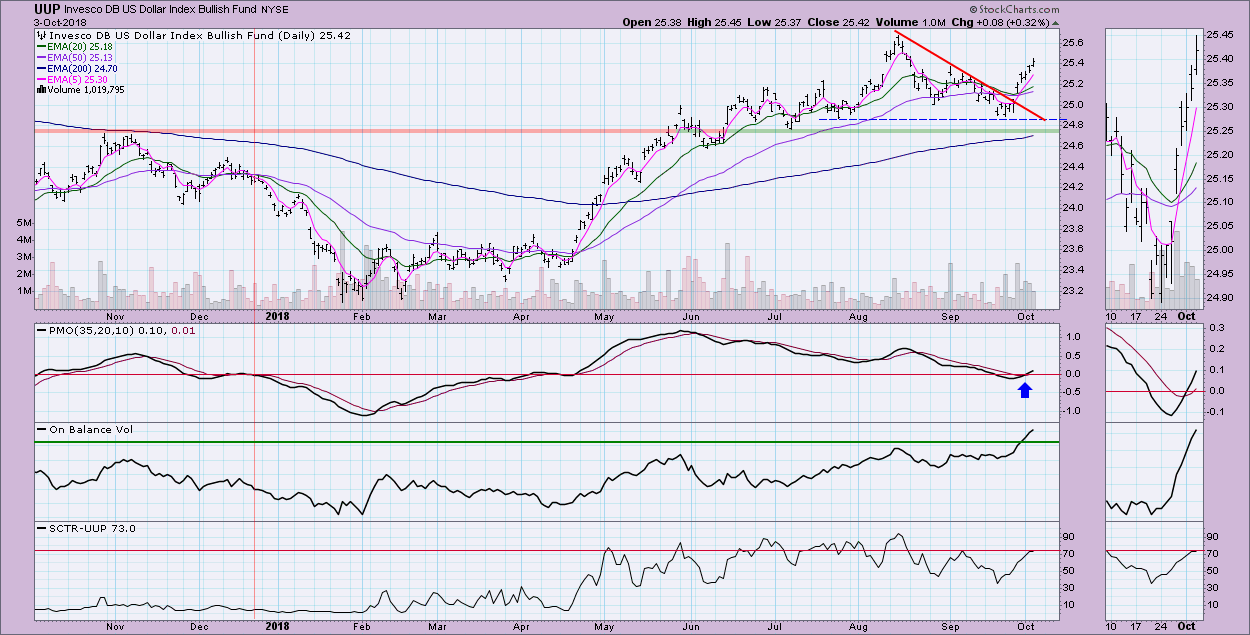
UUP Daily Chart: The Dollar woke up just as the PMO began to explore negative territory. This suggests internal strength. We also see that price has broken out above the September top. I would expect to see price rise to test the August top. Note the OBV is confirming with its strong upward momentum.
GOLD
IT Trend Model: Neutral as of 5/2/2018
LT Trend Model: SELL as of 6/22/2018
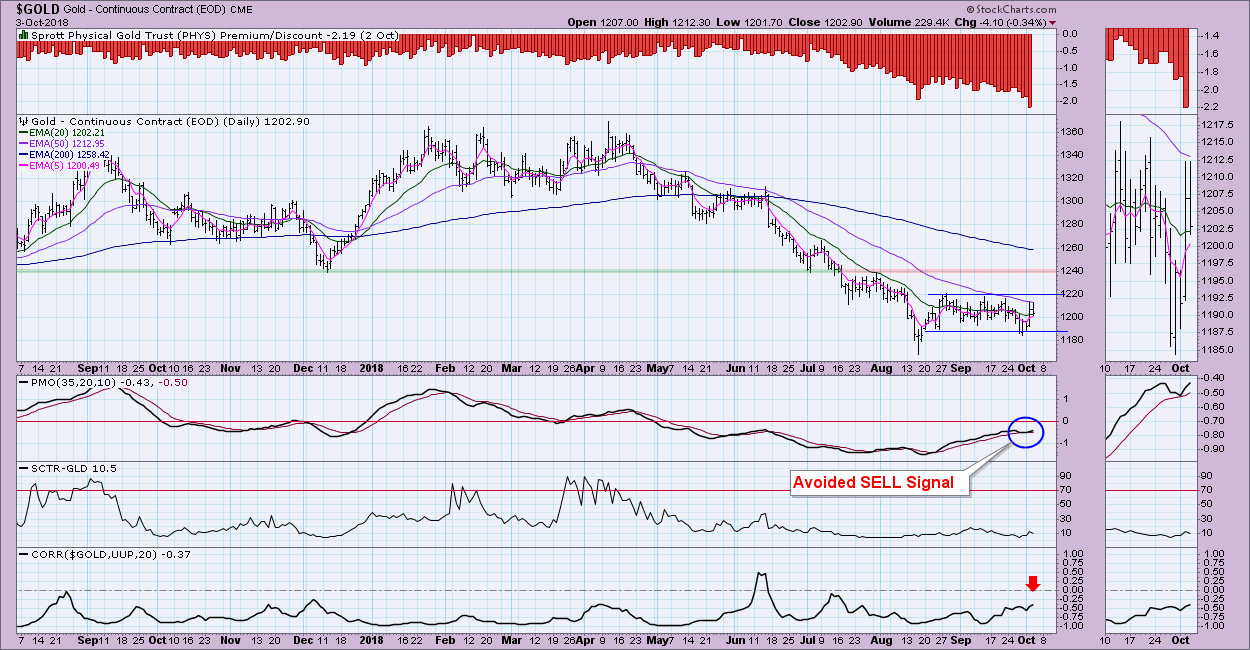
GOLD Daily Chart: Despite having a beautiful setup in late August, Gold never really produced the kind of rally we were all expecting. I don't believe it is over for Gold. On the contrary, note that the short-term 20-MA of the correlation with the Dollar (UUP) shows that the correlation is nearing zero. This means that Gold is decoupling/decoupled from the Dollar and isn't necessarily at its mercy if it rallies. Granted the Dollar will always have some effect on Gold, but right now prices are mostly holding up despite the new rally in the Dollar. The PMO avoided a SELL signal and the discounts are higher than we've seen all year which suggests bearish sentiment. I'm looking for Gold to at least test overhead resistance at $1220. We can reevaluate at that time.
CRUDE OIL (USO)
IT Trend Model: BUY as of 8/24/2018
LT Trend Model: BUY as of 11/2/2017
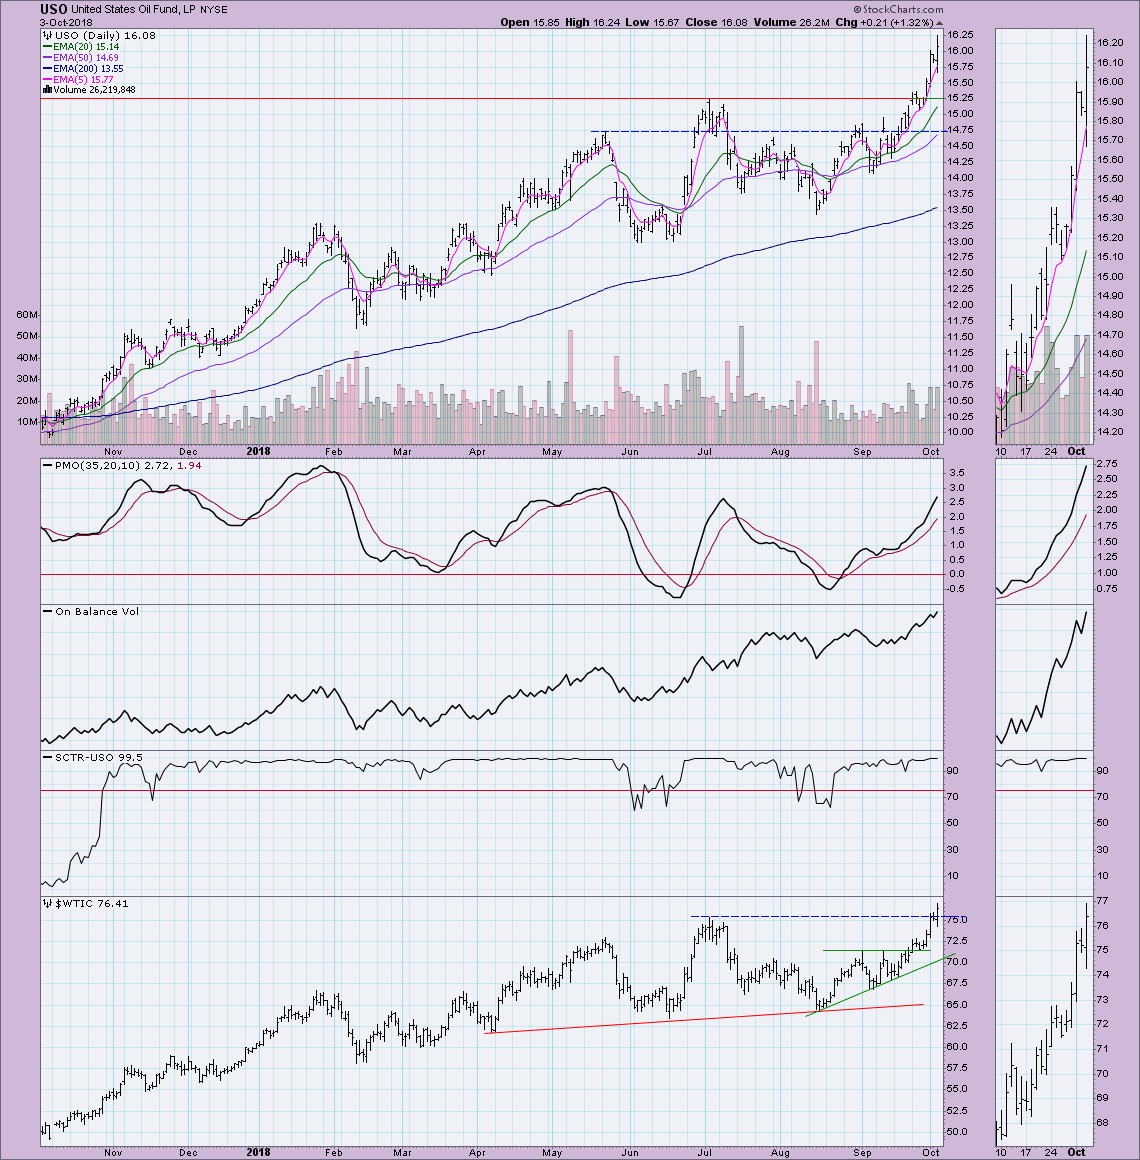
USO Daily Chart: Oil is enjoying a strong rally right now. $WTIC saw a new breakout to an annual high. Not to be pessimistic, but my advice is to set a trailing stop, only because we have seen a parabolic rally since the August low. If prices do weaken, we could see a quick and difficult decline based on studies of parabolic patterns. The PMO is reaching overbought territory, it's time for a pullback. We could see Oil run up higher before then as the PMO isn't showing any deterioration. A deceleration in the PMO will be our first warning.
BONDS (TLT)
IT Trend Model: Neutral as of 9/13/2018
LT Trend Model: SELL as of 9/18/2018
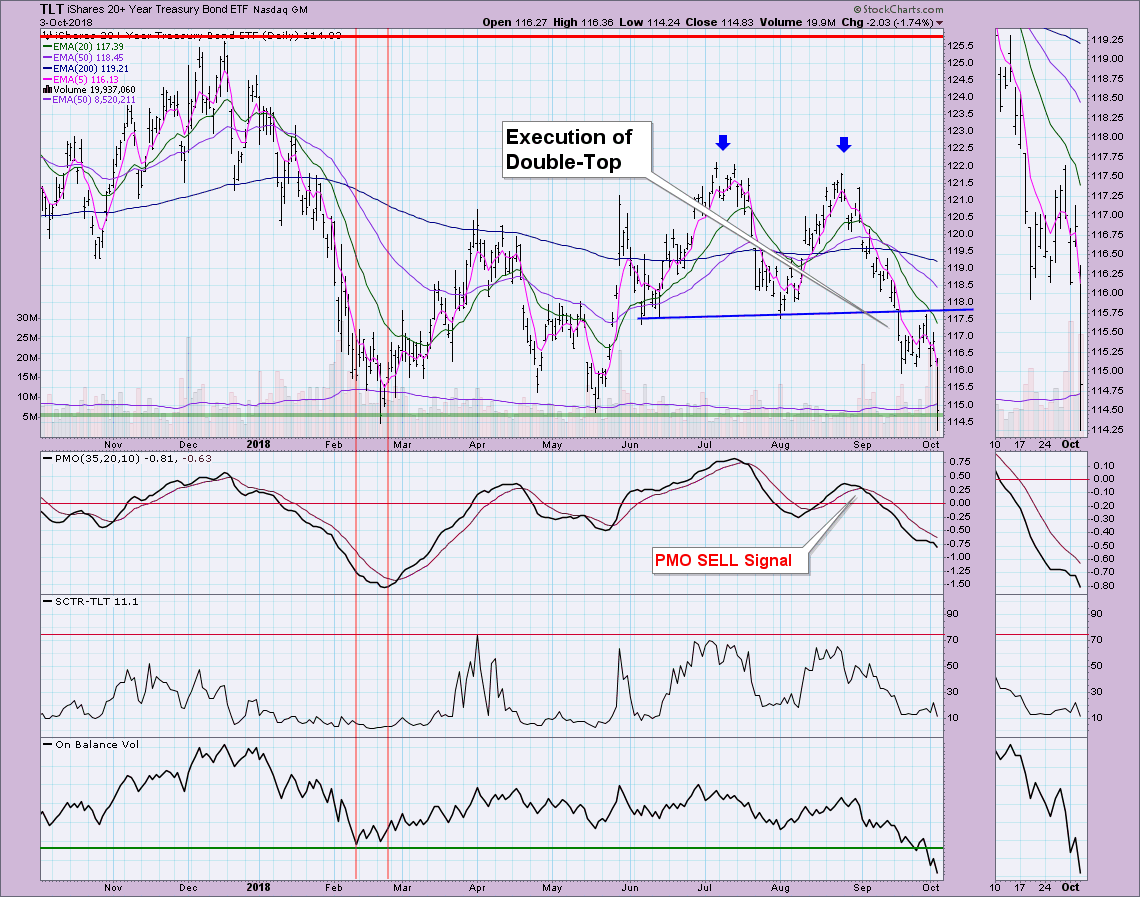
TLT Daily Chart: Today, TLT plunged almost 1.75%. Today it traded at lows we haven't seen all year. The PMO was improving on the throwback rally after the double-top confirmation line was broken. However, price reached that breakdown point and in response has declined. The PMO has topped below its signal line which I consider especially bearish.
 The weekly chart of TLT shows a distinct head and shoulders pattern with a rising neckline. The neckline has been broken. The minimum downside target is around $90 at the 2013 lows. There are some areas of intermediary support at the 2017/18 lows and 2012 high or even at the 2015 bottom. The IT PMO SELL signal arrived a few weeks ago, portending this correction.
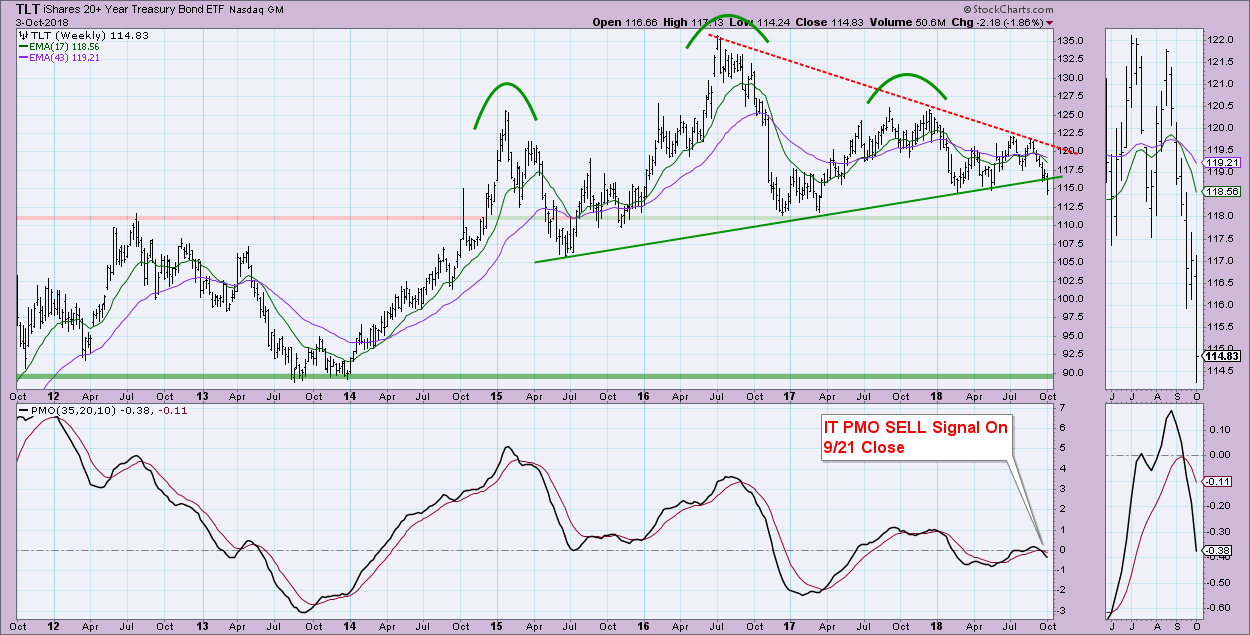
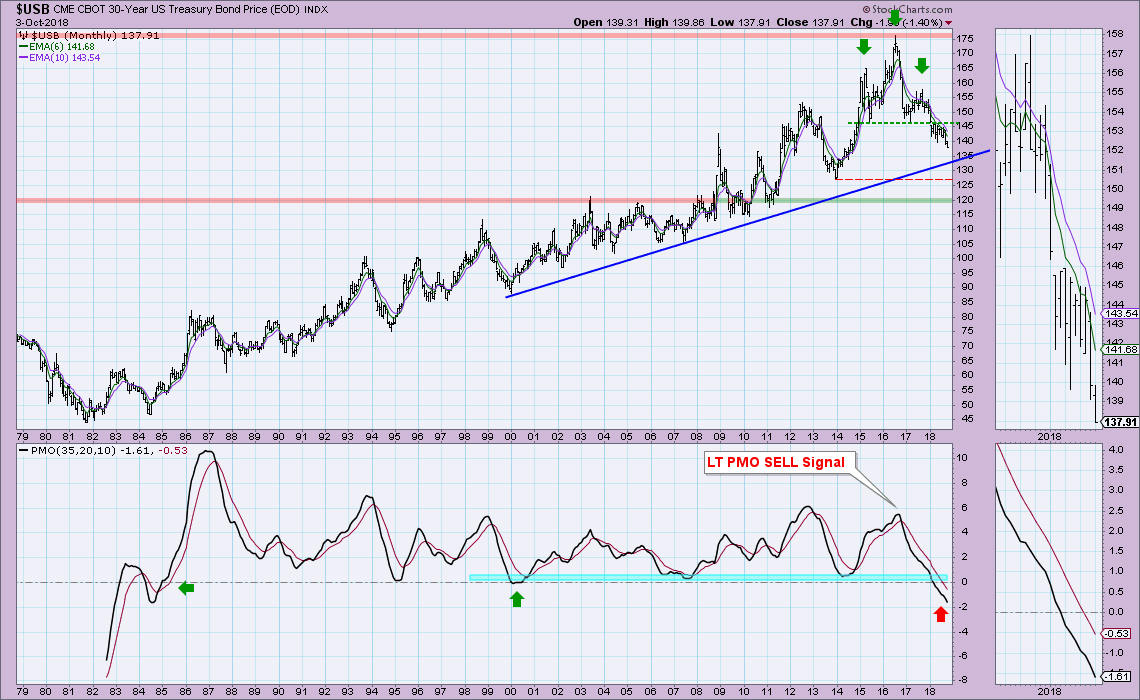
Here is the $USB monthly chart. I use this because it has more historical data than TLT. In the case of 30-Year Bonds, a long-term head shoulders already has executed. The minimum downside target of this head and shoulders is around $120. The PMO is reaching lows we haven't seen since we started tracking it.
Technical Analysis is a windsock, not a crystal ball.
Happy Charting!
- Erin
**Don't miss any of the DecisionPoint commentaries! Go to the "Notify Me" box toward the end of this blog page to be notified as soon as they are published.**
NOTE: The signal status reported herein is based upon mechanical trading model signals, specifically, the DecisionPoint Trend Model. They define the implied bias of the price index based upon moving average relationships, but they do not necessarily call for a specific action. They are information flags that should prompt chart review. Further, they do not call for continuous buying or selling during the life of the signal. For example, a BUY signal will probably (but not necessarily) return the best results if action is taken soon after the signal is generated. Additional opportunities for buying may be found as price zigzags higher, but the trader must look for optimum entry points. Conversely, exit points to preserve gains (or minimize losses) may be evident before the model mechanically closes the signal.
Helpful DecisionPoint Links:
DecisionPoint Shared ChartList and DecisionPoint Chart Gallery
Price Momentum Oscillator (PMO)
Swenlin Trading Oscillators (STO-B and STO-V)
