 **Special Announcement** Don't miss this Friday's DecisionPoint show at 4:30pm EST on StockCharts TV, where Carl will be joining me to discuss our outlook for 2019!
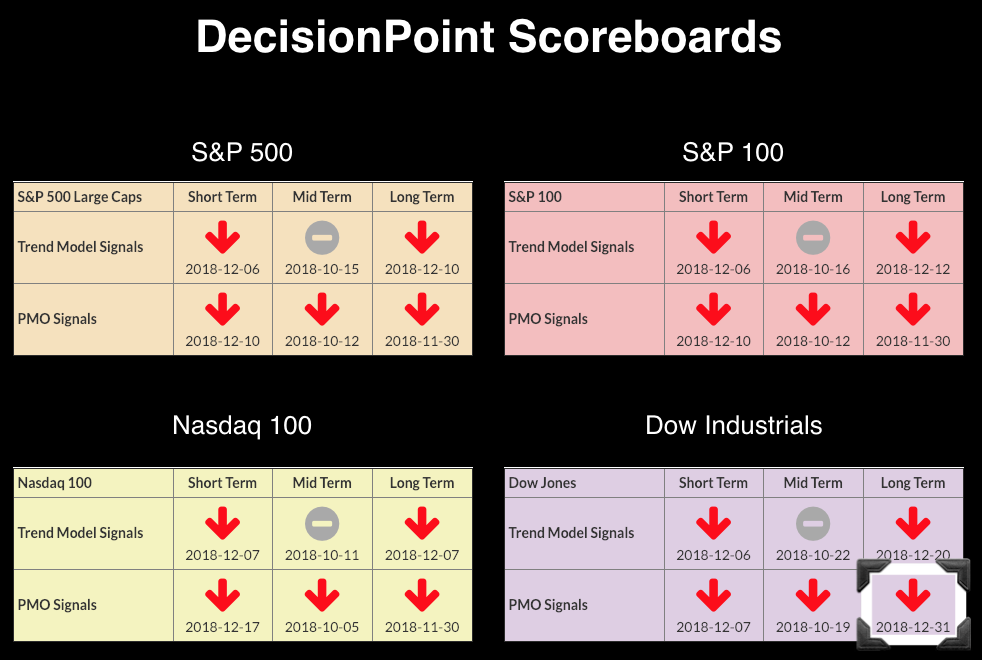
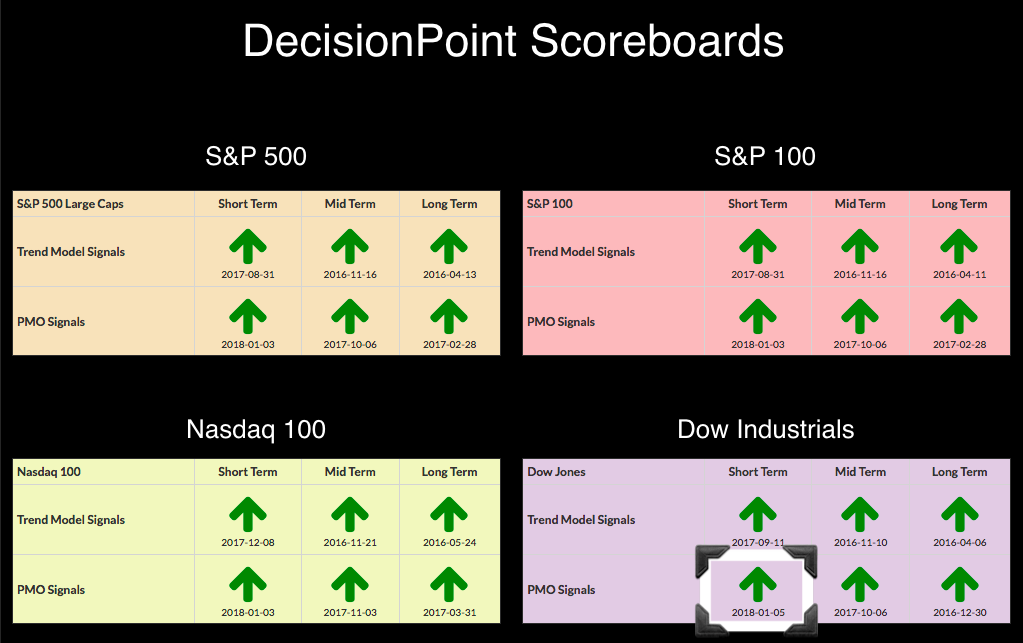
During today's MarketWatchers LIVE show, I showed viewers what the DP Scoreboards looked like at the beginning of 2018 and how they finished. As of 12/31/2018, the DP Scoreboards became 100% bearish, with no BUY signals to be found.
Here's a peek at what they looked like on 1/5/2018:
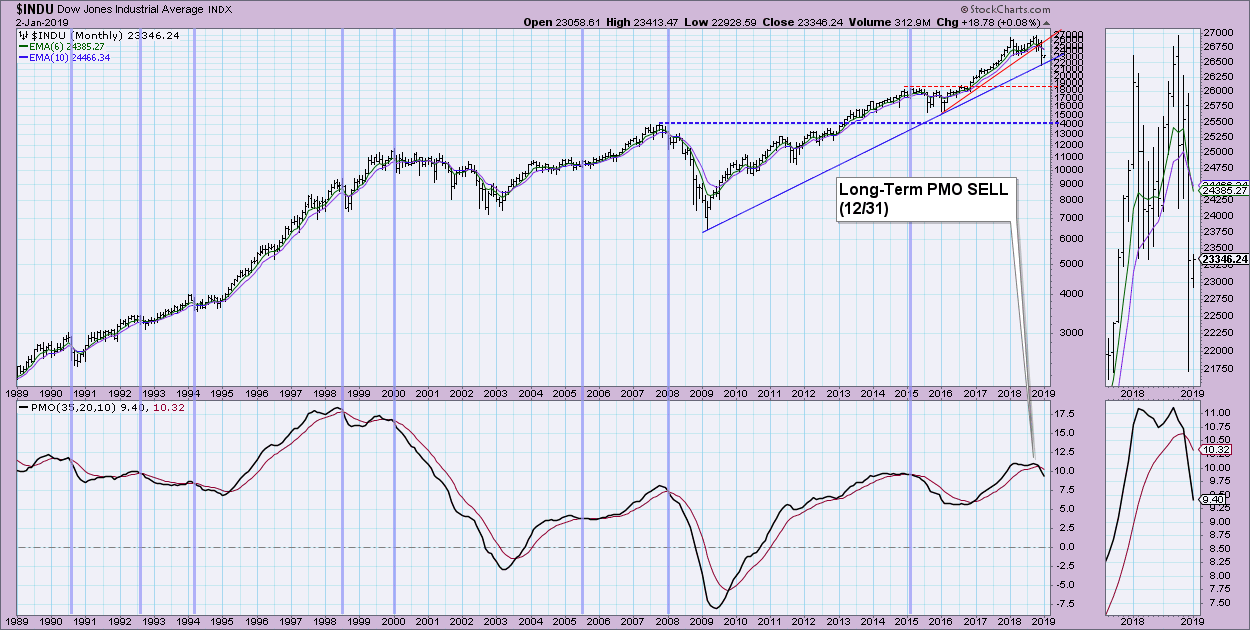
 What a difference a year makes. Below is the monthly chart for the Dow, where you can view the latest signal change on the Long-Term Price Momentum Oscillator (PMO) from a BUY to a SELL. Currently, the secular bull market rising bottoms trend line is holding. Spoiler alert...SPX and OEX have broken below said rising trend line. I would expect to see the NDX and INDU follow suit this month.
The DecisionPoint Alert presents a mid-week assessment of the trend and condition of the stock market (S&P 500), the U.S. Dollar, Gold, Crude Oil and Bonds.
SECTORS
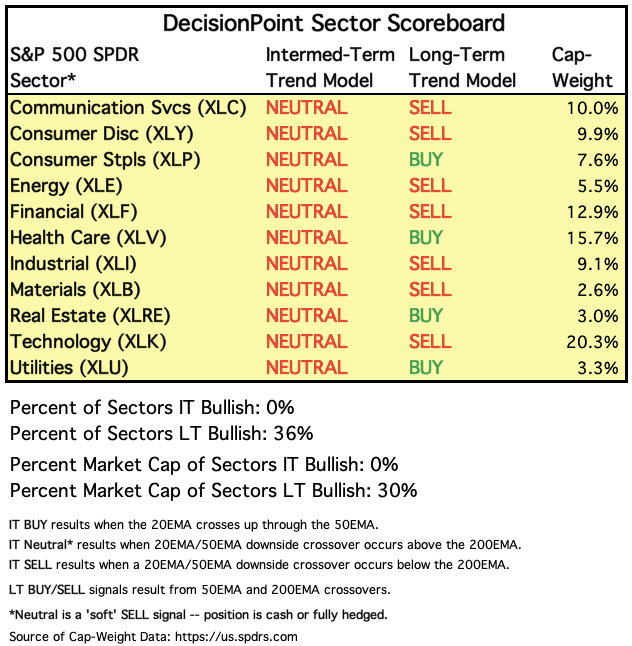
Each S&P 500 Index component stock is assigned to one, and only one, of eleven major sectors. This is a snapshot of the Intermediate-Term and Long-Term Trend Model signal status for those sectors.
STOCKS
IT Trend Model: Neutral as of 10/15/2018
LT Trend Model: SELL as of 12/14/2018
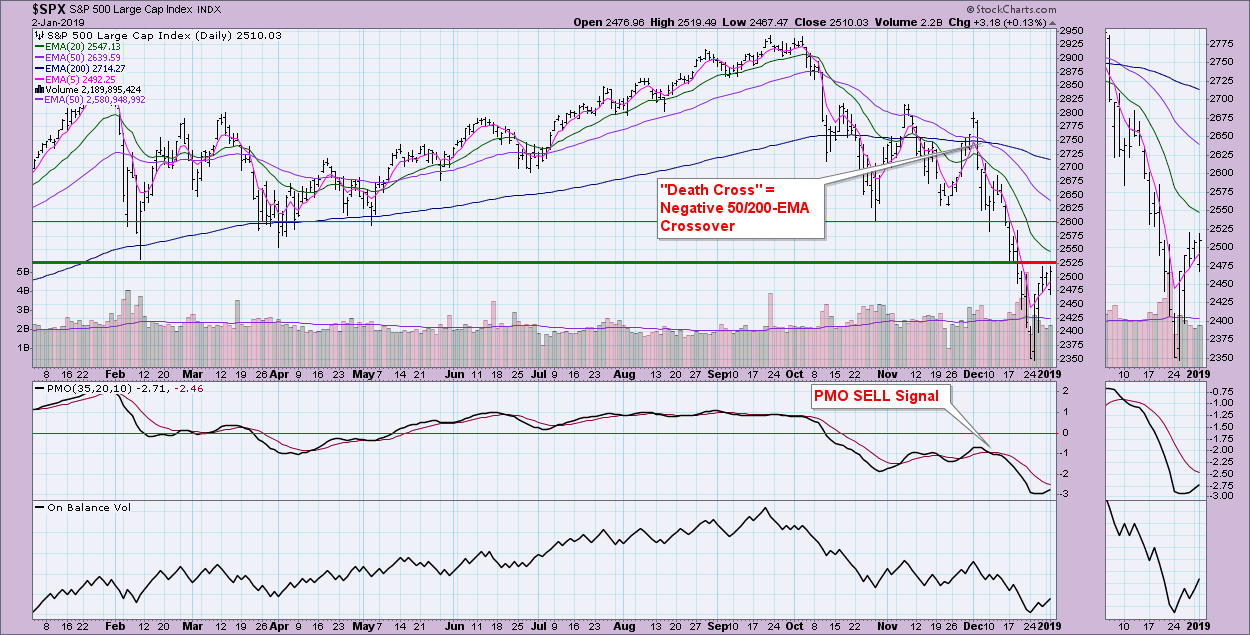
SPY Daily Chart: You'll note that, in the DP Sector Signal Table above, the only BUY signals remaining are the Long-Term Trend Model signals in the defensive sectors. This isn't good news for bulls. Looking at the daily chart, we can see that, although there has been some rally, price is now pushing against overhead resistance at the February low. The PMO is turning up in very oversold territory, which is positive, but don't forget that oversold in a bear market isn't necessarily a golden ticket to higher prices. Oversold conditions can persist in a bear market and amount to very little. Remember, oscillators must oscillate. I'd like to see the PMO rise back up toward the zero line, but that would require a price breakout, which seems unlikely as we finish up the week.
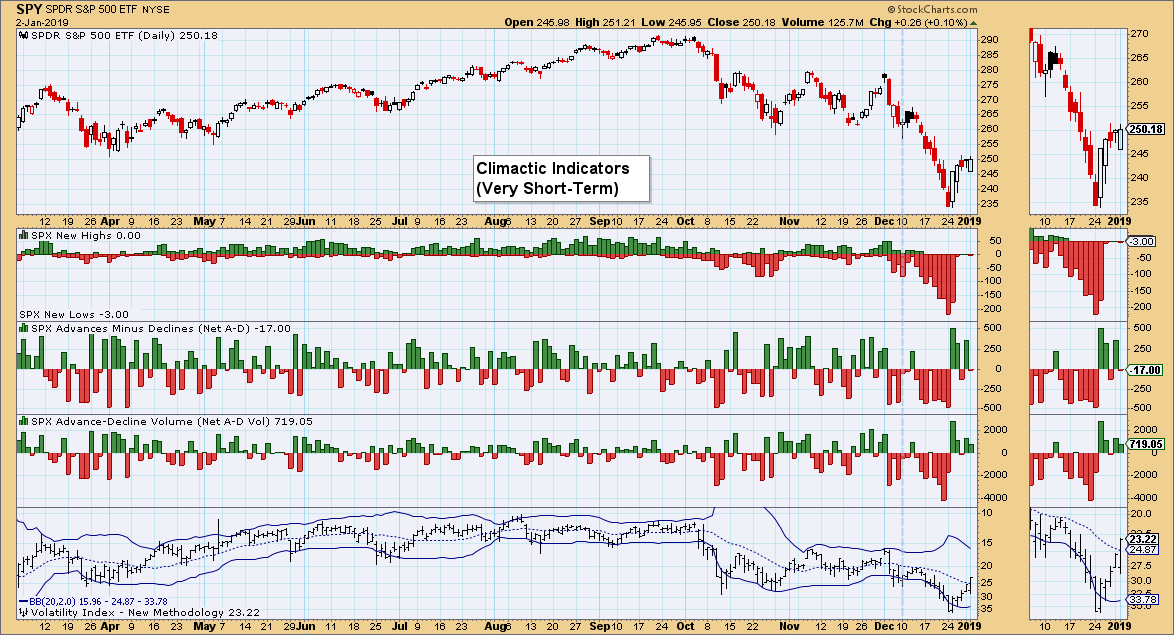
Climactic Market Indicators: We have seen climactic readings for over a week now. The VIX is currently in the middle of its range, so, unfortunately, this chart isn't telling us very much.
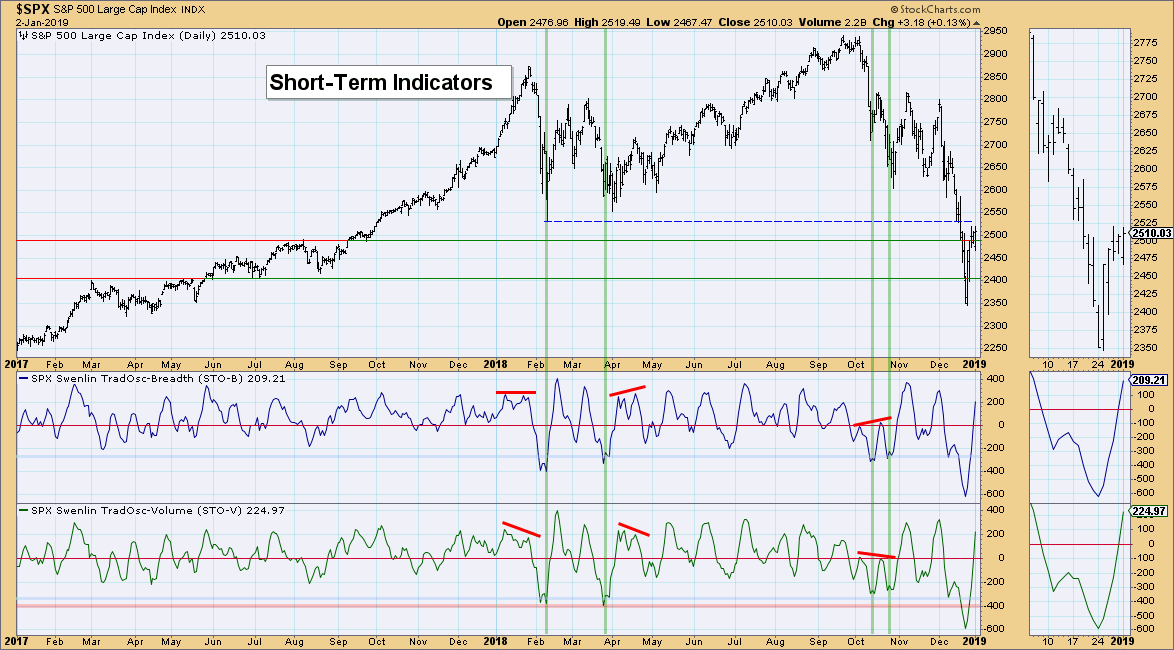
 Short-Term Market Indicators: These oscillators took full advantage of the rally and zoomed right into moderately overbought territory. If we see them get much more overbought, you should beware. Unlike oversold conditions in a bear market, which can be ambiguous, overbought conditions in a bear market are dangerous. Given the struggle to push back above the February low, these indicators suggest more sideways movement or a decline.
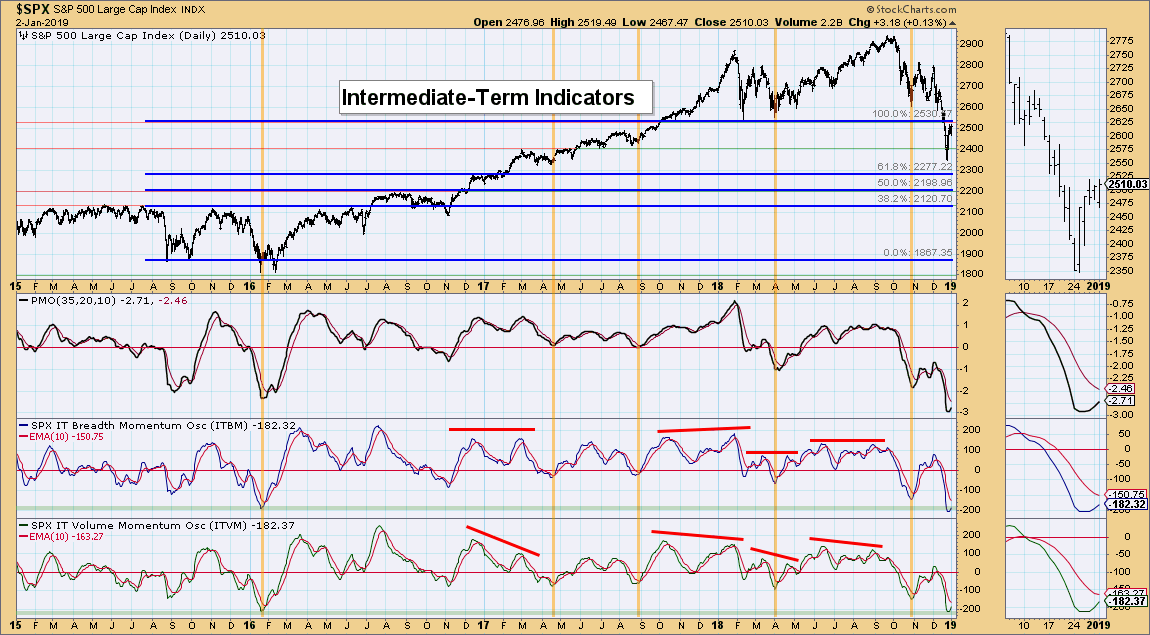
Intermediate-Term Market Indicators: These indicators are turning up in deeply oversold territory. This is bullish for the intermediate term. If we see a positive crossover of the ITBM and ITVM readings above their signal lines, my confidence in these indicators would rise appreciably.
Conclusion: With volatility still high, the roller coaster ride is almost certainly not over. Based on the overbought ST indicators, I favor short-term decline followed by a relief rally next week. I am completely in cash right now. If I change my outlook and/or positions, I'll be sure to give you a heads up.
DOLLAR (UUP)
IT Trend Model: BUY as of 4/24/2018
LT Trend Model: BUY as of 5/25/2018
UUP Daily Chart: The Dollar has been consolidating mostly sideways since the beginning of December. On the bright side, there is an intact rising trend channel and the PMO is ticking back up. Any move to the upside will likely be anemic with a rise to about $25.85.
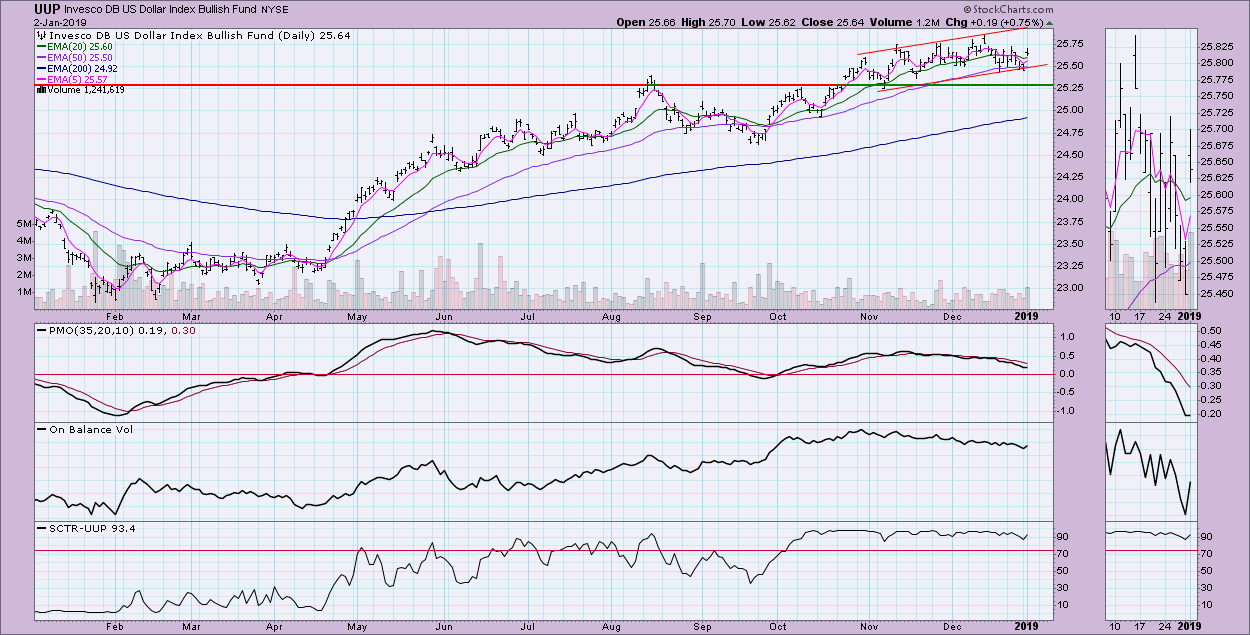
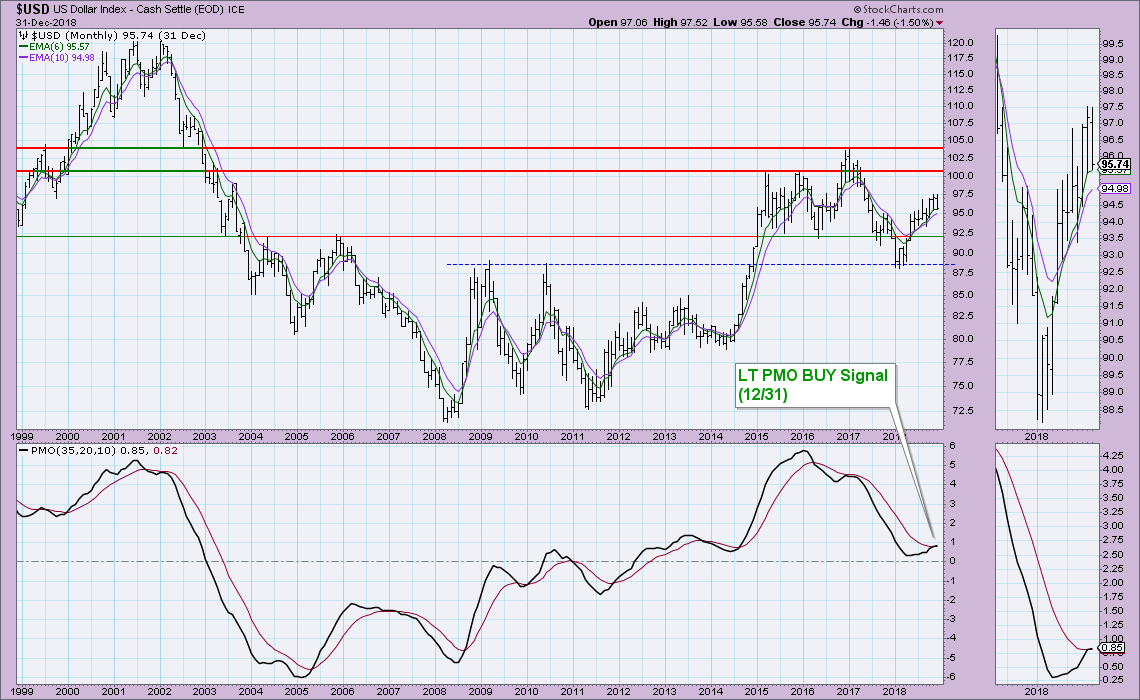
We did see a LT PMO BUY signal go final on 12/31. The rising trend and 6-month EMA is holding up, but the PMO is already decelerating. The next signal will be official after the final day of the trading month.
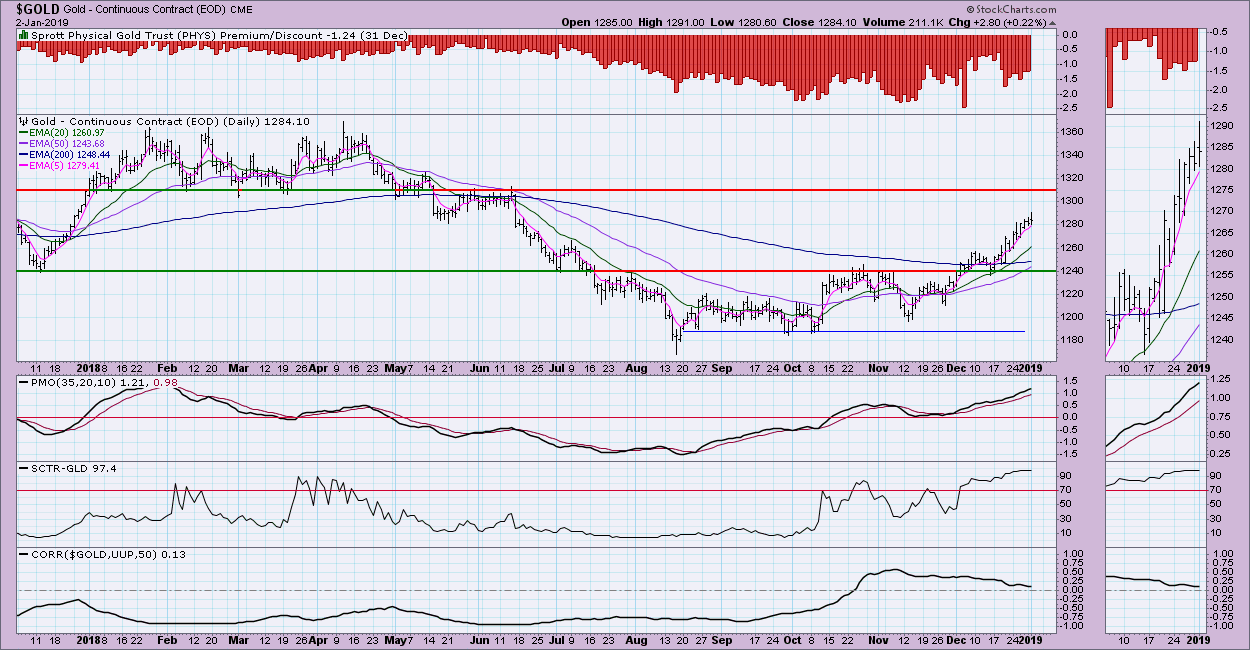
GOLD
IT Trend Model: BUY as of 10/19/2018
LT Trend Model: SELL as of 6/22/2018
GOLD Daily Chart: No signal changes here. The PMO is getting overbought, but isn't decelerating. The SCTR is healthy. The correlation between Gold and the Dollar has disintegrated - at this point, they aren't correlated at all. This means that a drop in the Dollar wouldn't necessarily mean a rise in Gold. This is my refuge of choice during corrections. I will let you know if I move in. I'd like to see a pullback.
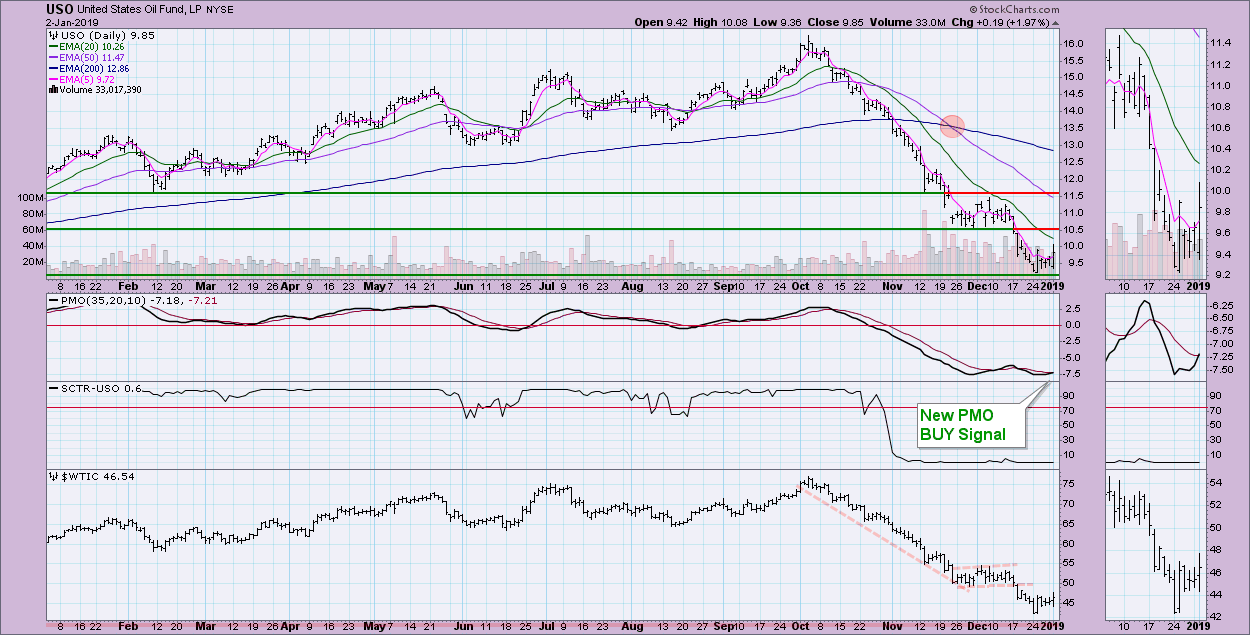
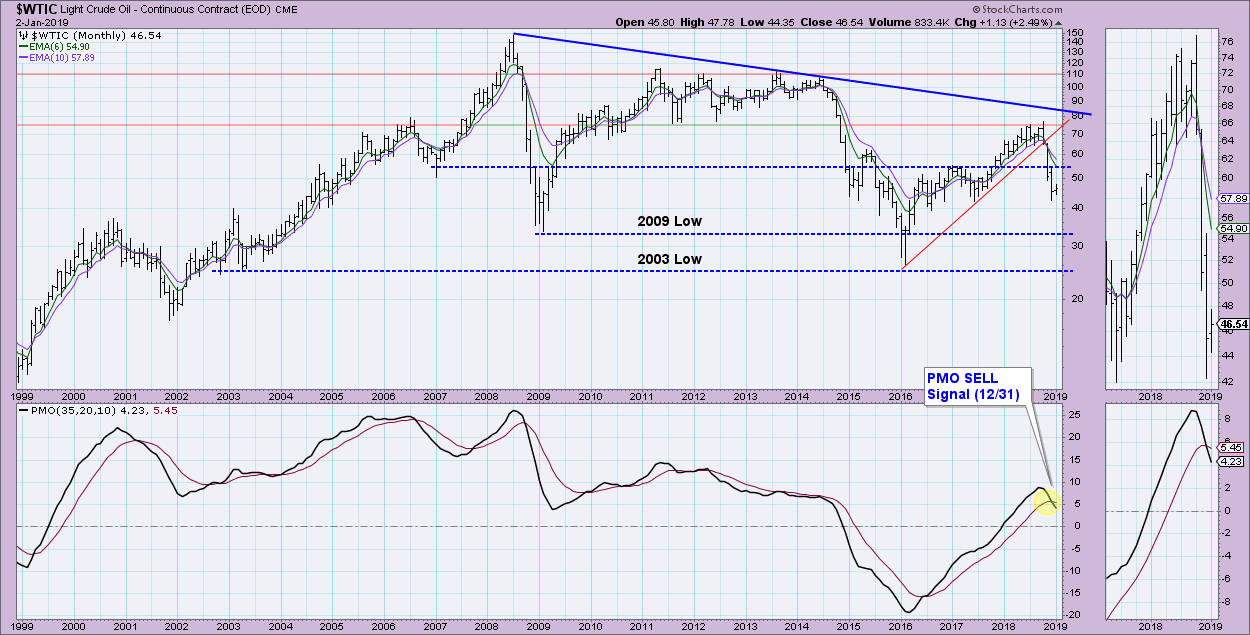
CRUDE OIL (USO)
IT Trend Model: Neutral as of 10/29/2018
LT Trend Model: SELL as of 11/23/2018
USO Daily Chart: Carl wrote an excellent article on Oil inside the "Weekly/Monthly Wrap" on Friday. Oil has lost almost 40% since the top in October. This has serious implications, which I recommend you read about in Carl's article here. I think we've hit an important price bottom at $9.20. This may be the time to ride USO as it pushes toward $10.50. The PMO just clicked a BUY signal today. The PMO bottoms are rising slightly while the corresponding price bottoms are declining. This is positive divergence. Any price rise will likely be short-term in nature. The monthly chart shows a new PMO SELL signal that went final on Monday.
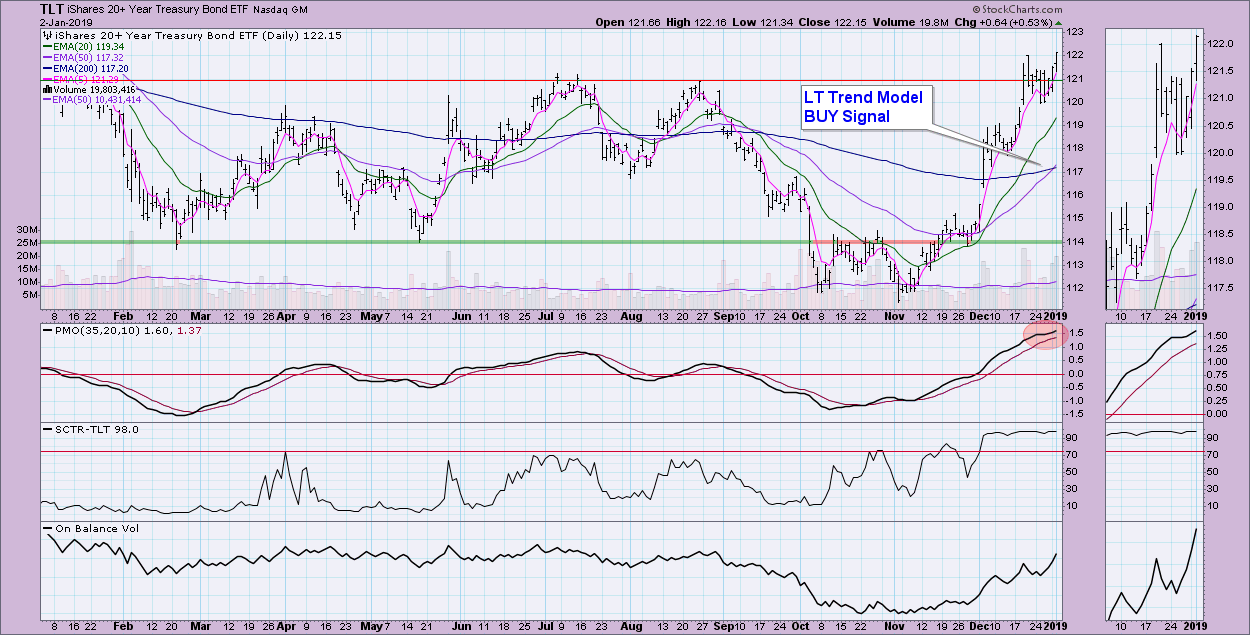
BONDS (TLT)
IT Trend Model: BUY as of 12/6/2018
LT Trend Model: BUY as of 1/2/2019
TLT Daily Chart: TLT set another new high today. This was accompanied by a new Long-Term Trend Model BUY signal coming in. As much as I'd like to stay bullish, I would still look for a possible island reversal that would close the December gap and (hopefully) get the PMO out of overbought territory.
Technical Analysis is a windsock, not a crystal ball.
Happy Charting!
- Erin
**Don't miss any of the DecisionPoint commentaries! Go to the "Notify Me" box toward the end of this blog page to be notified as soon as they are published.**
NOTE: The signal status reported herein is based upon mechanical trading model signals, specifically the DecisionPoint Trend Model. They define the implied bias of the price index based upon moving average relationships, but they do not necessarily call for a specific action. They are information flags that should prompt chart review. Further, they do not call for continuous buying or selling during the life of the signal. For example, a BUY signal will probably (but not necessarily) return the best results if action is taken soon after the signal is generated. Additional opportunities for buying may be found as price zigzags higher, but the trader must look for optimum entry points. Conversely, exit points to preserve gains (or minimize losses) may be evident before the model mechanically closes the signal.
Helpful DecisionPoint Links:
DecisionPoint Shared ChartList and DecisionPoint Chart Gallery
Price Momentum Oscillator (PMO)
Swenlin Trading Oscillators (STO-B and STO-V)
