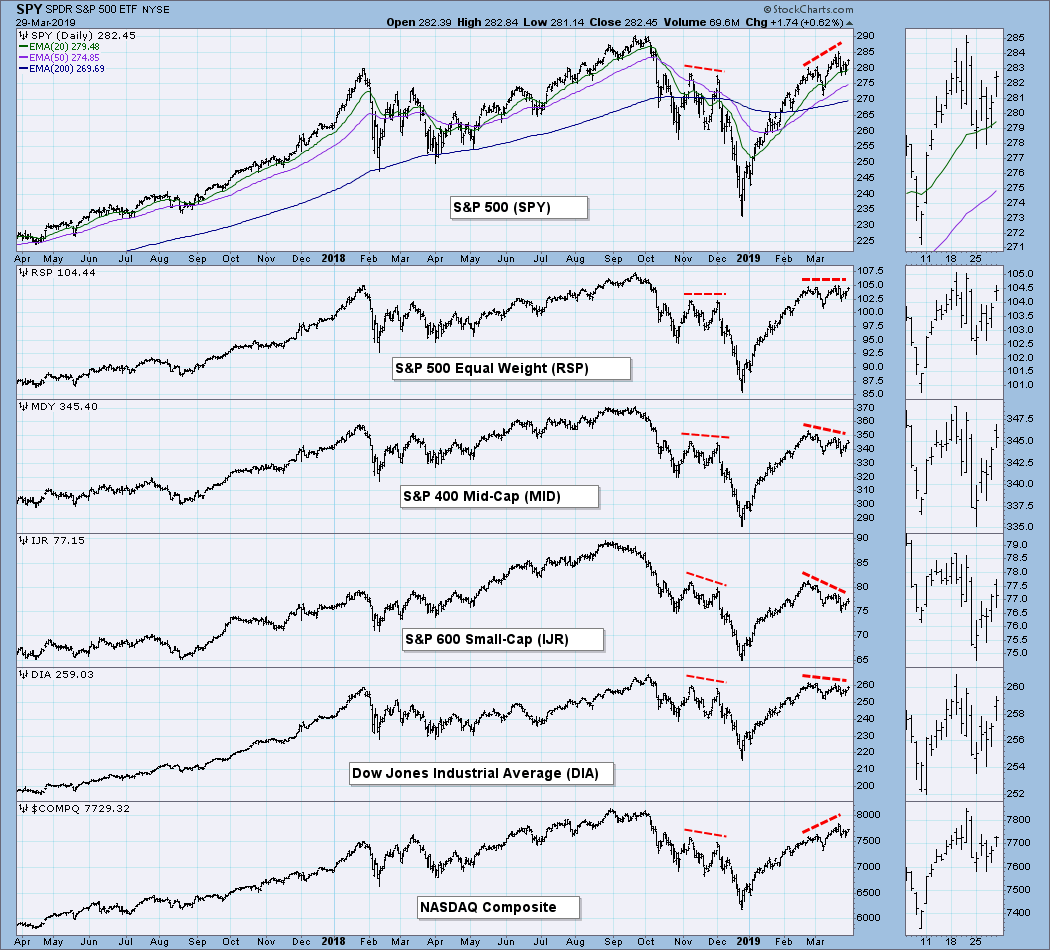
This is a new chart I will be adding to my weekly commentary. My concentration has always been on the S&P 500 Index, but I realized that I needed to broaden my scope somewhat to include other segments of the the broad market, and this is my first effort. The idea is to get a quick scan to see if something needs a closer look. First, we notice that these indexes can be in agreement, as they were last fall. The S&P 500 made a December top beneath the November top, and the other indexes did the same. More recently the S&P 500 made a March top higher than the February top, but the only index to agree was the NASDAQ Composite, which was propelled by the NASDAQ 100 stocks. The others have negative divergences.
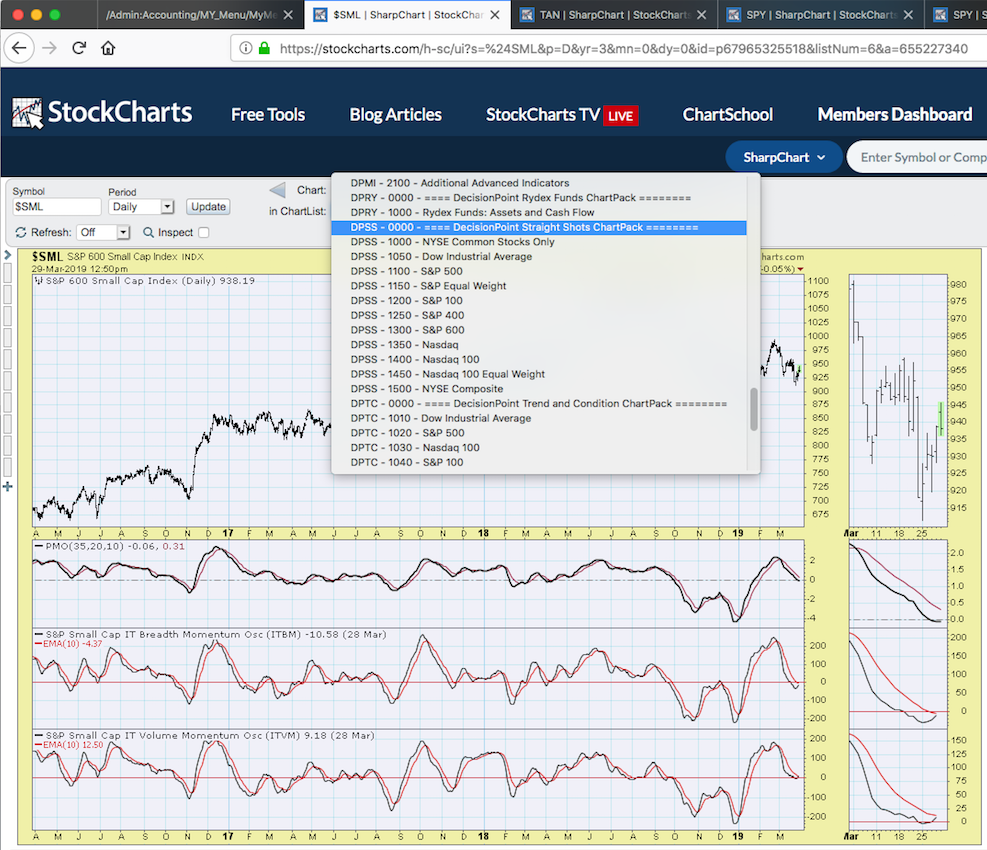
Some may wonder why I chose the S&P 600 Small-Cap Index instead of the Russell 2000. The reason is simple. The two indexes are quite similar, but StockCharts.com has a complete set of market indicator charts for the S&P 600 that are based upon the components of the S&P 600: A-D Line, A-D Volume Line, Swenlin Trading Oscillator for Breadth and Volume, ITBM and ITVM, Stocks Above 20/50/200EMAs, New Highs and New Lows, and more. You can find this specialized set of indicators in the DecisionPoint Straight Shots ChartPack, as illustrated below. Note that we have several market indexes with collections of their own market indicator charts.
The DecisionPoint Weekly Wrap presents an end-of-week assessment of the trend and condition of the stock market (S&P 500), the U.S. Dollar, Gold, Crude Oil, and Bonds.
Watch the latest episode of DecisionPoint on StockCharts TV's YouTube channel here!
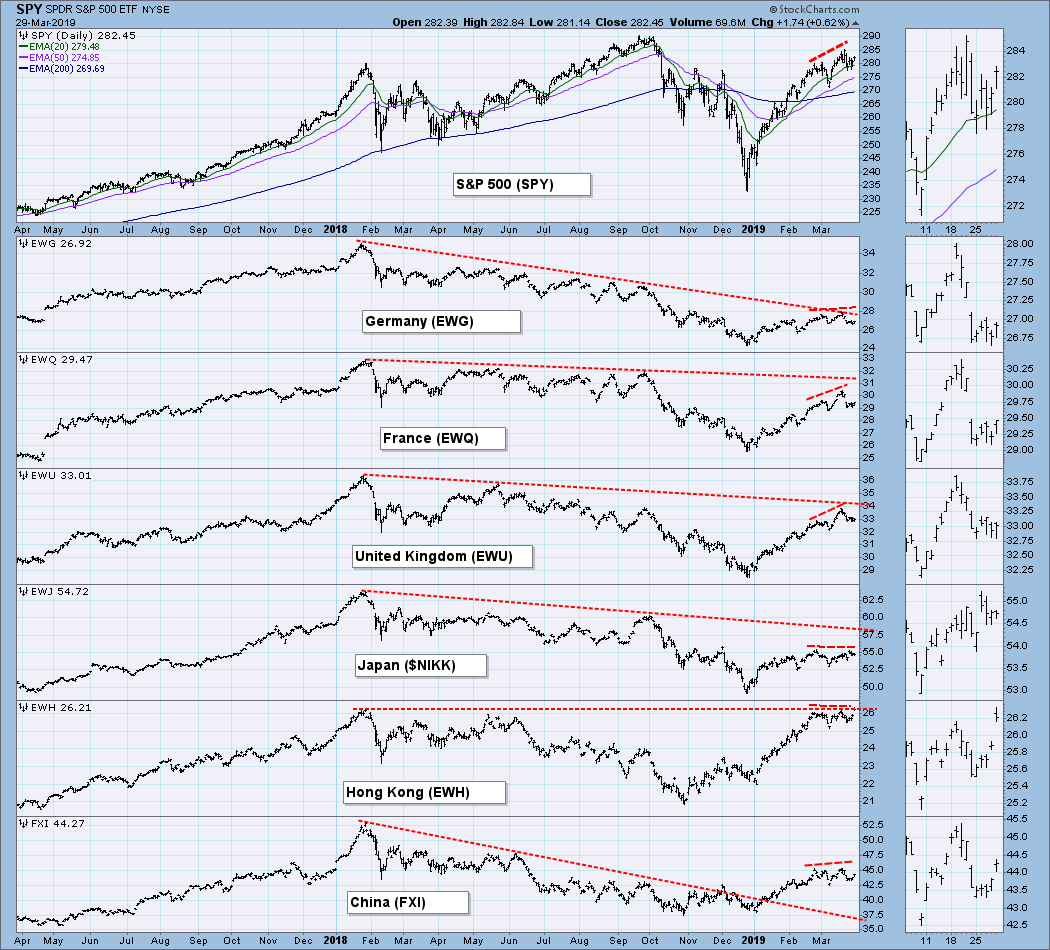
GLOBAL MARKETS
This is another chart that will become a part of this weekly commentary. Again, we're looking for a quick scan. We note that, except for Hong Kong, all these markets are below a long-term declining tops line drawn from the January 2016 price top. While they have rallied significantly since the 2018 low, they are essentially in secular bear markets.
BROAD MARKET INDEXES
We introduced this chart in our opening comments, and we will discuss it further in future commentaries.
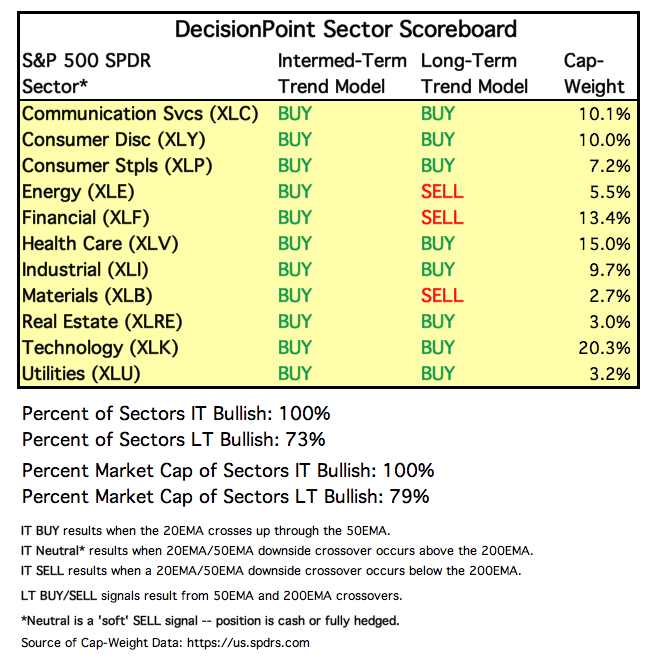
SECTORS
Each S&P 500 Index component stock is assigned to one, and only one, of 11 major sectors. This is a snapshot of the Intermediate-Term and Long-Term Trend Model signal status for those sectors.
STOCKS
IT Trend Model: BUY as of 2/1/2019
LT Trend Model: BUY as of 2/26/2019
SPY Daily Chart: Price was in a rising wedge. While the wedge resolved downward, it was not at all decisive. The VIX found support on the bottom Bollinger Band and is now moving to toward the top band. The OBV negative divergence still holds.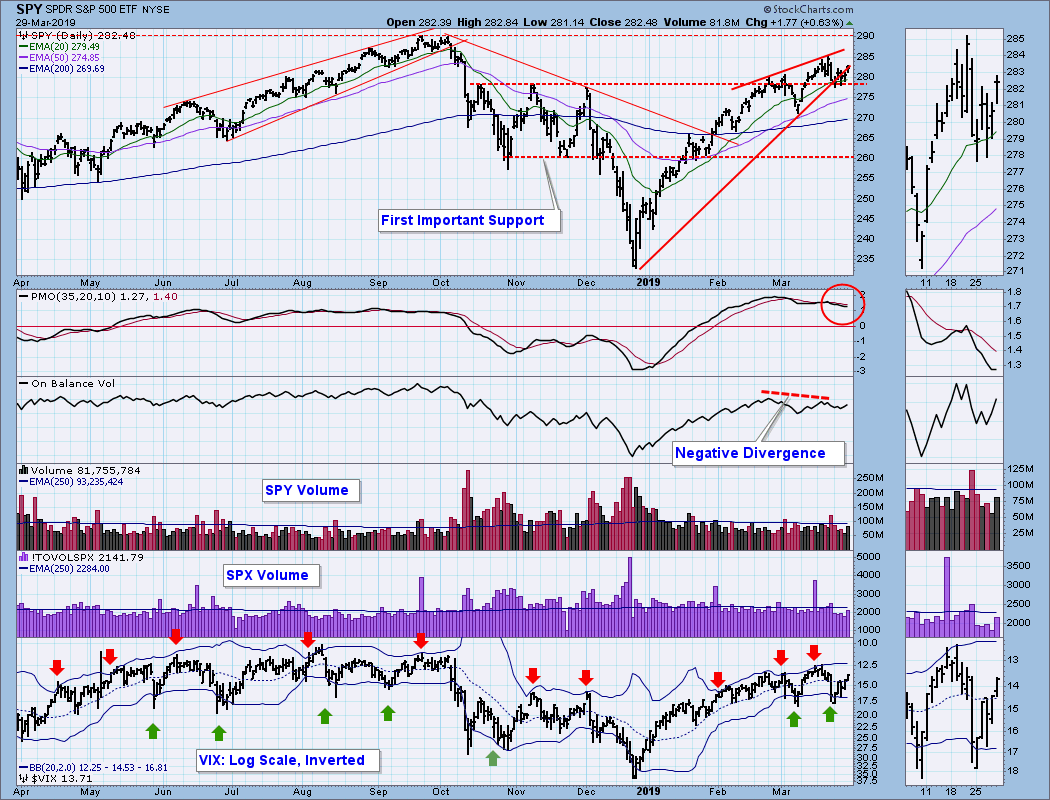
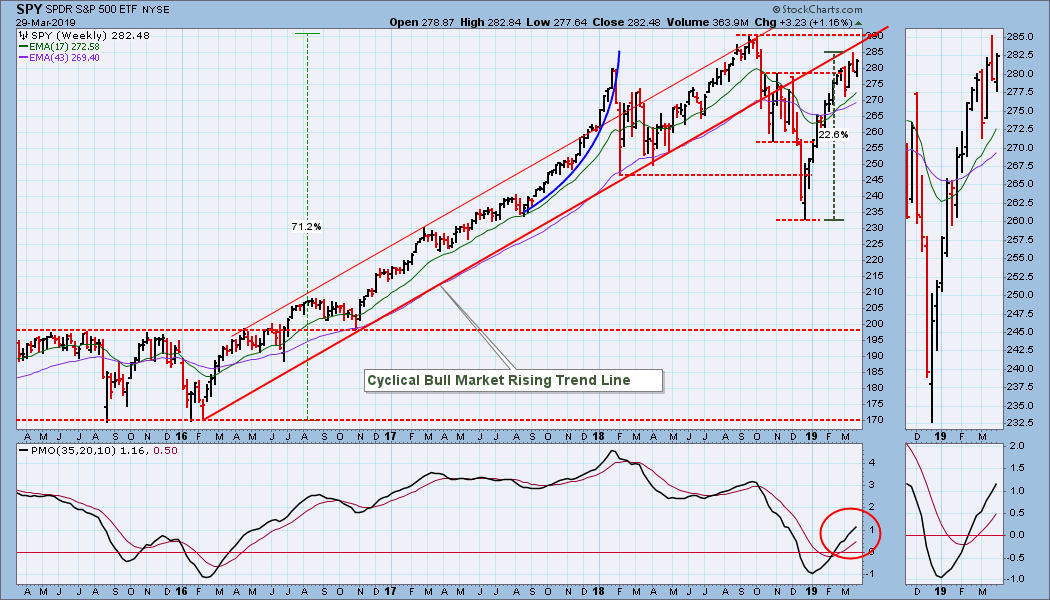
SPY Weekly Chart: Price seems to be trying to top, but the weekly PMO is still moving steady upward.
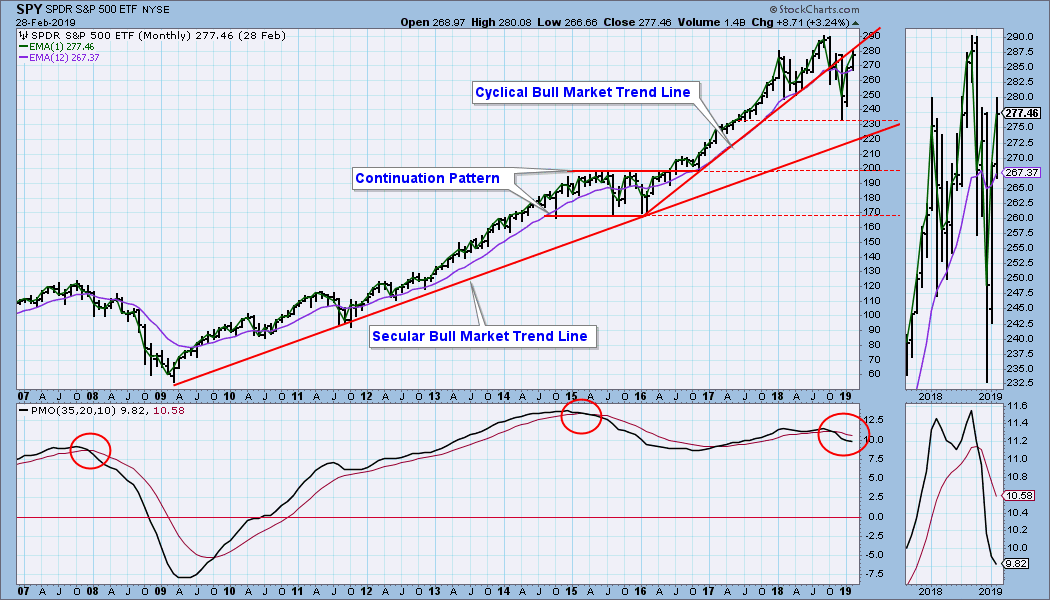
SPY Monthly Chart: SPY is attempting to recapture the cyclical bull market rising trend line. It's close, but not a done deal. This is more clear on the weekly chart above.
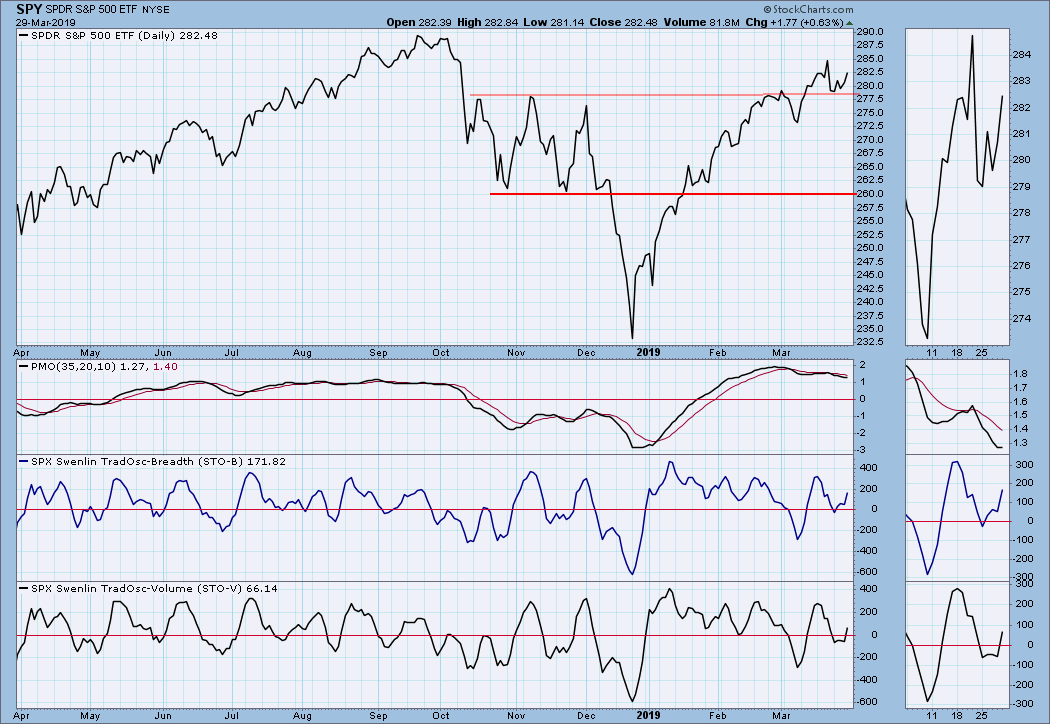
Climactic Market Indicators: S&P 500 volume has been a bit thin this week.
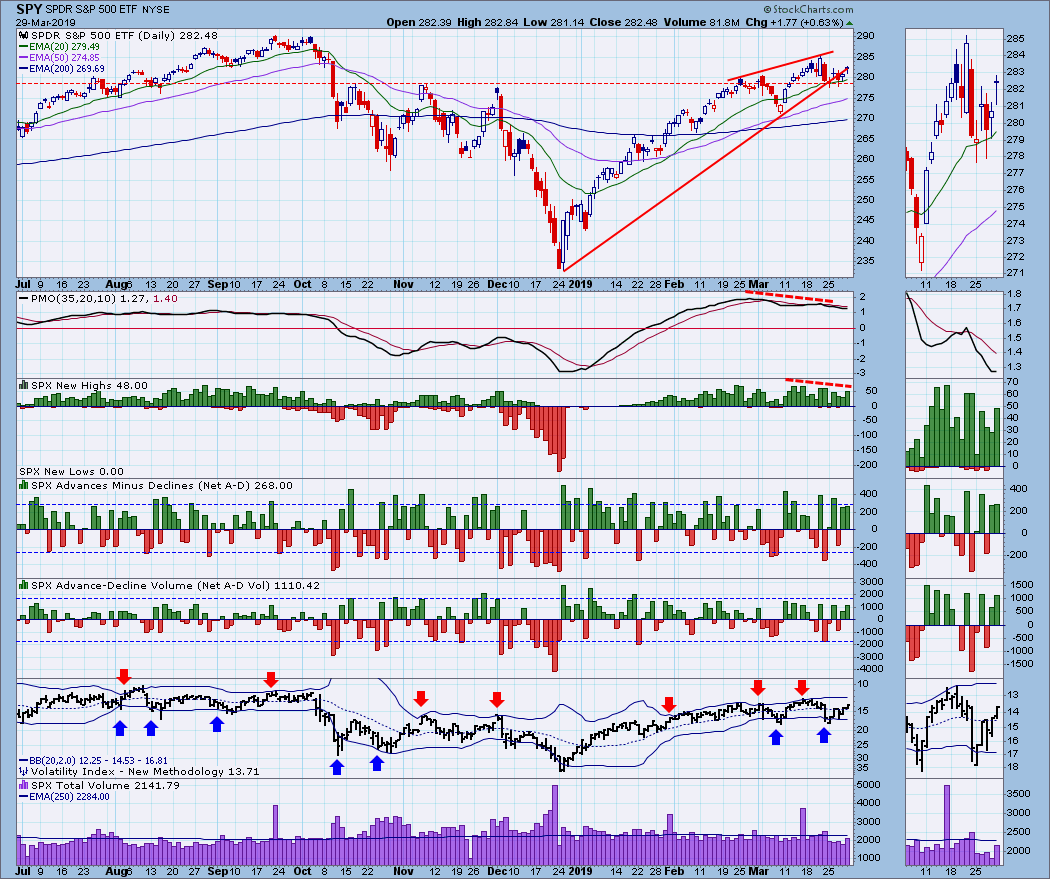
Short-Term Market Indicators: The fact that the STOs have bottomed so close to the zero line indicates that bullish conditions prevail.
Intermediate-Term Market Indicators: The ITBM and ITVM have bottomed, but they are still somewhat overbought. The daily PMO has not bottomed, and it is very overbought.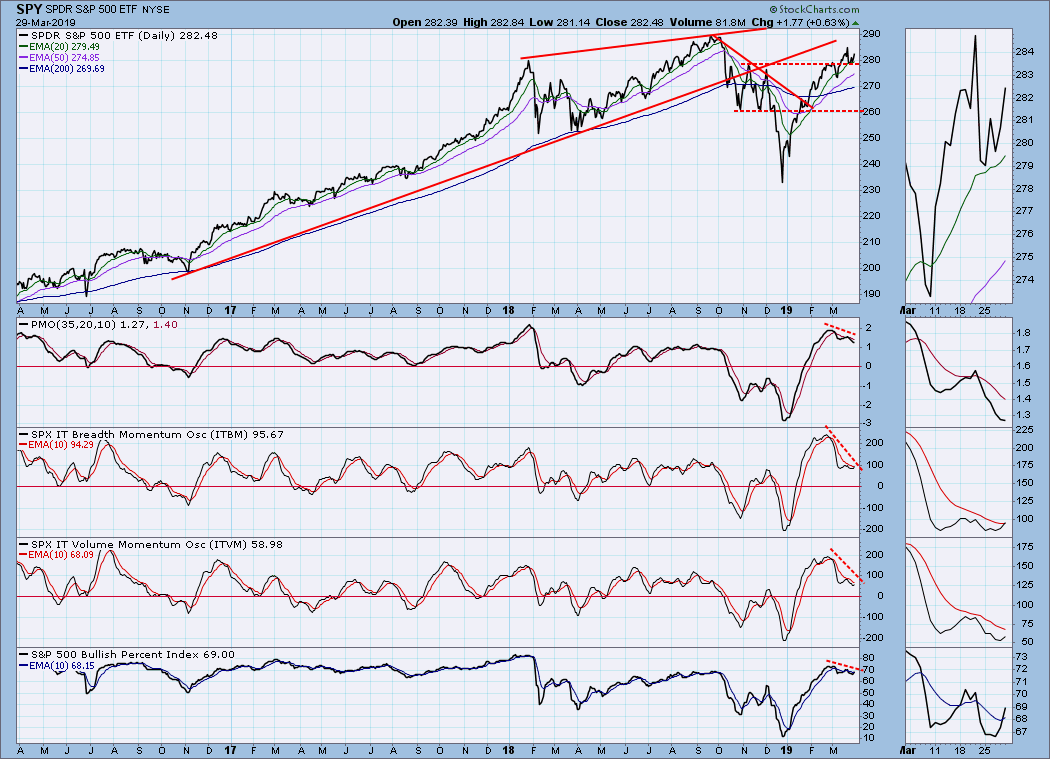
CONCLUSION: Last week I thought conditions looked ripe for some selling, but price stalled above support all week, and on Friday Larry Kudlow said he thought the Fed should cut interest rates. Whether or not the Fed will respond to the administration's prodding is anybody's guess, but in any case, the next Fed announcement won't be until May 1. The market is less than 3% away from making new, all-time highs, and that could be done in a couple of days without much effort. The bearish technical picture I saw last week is not so clear now, but it is clear that upward progress is being driven by the large-cap segment. This is less than ideal, but the large-cap stocks can drive the market higher for a long time. I have to say I'm neutral about next week.
DOLLAR (UUP)
IT Trend Model: BUY as of 2/7/2019
LT Trend Model: BUY as of 5/25/2018
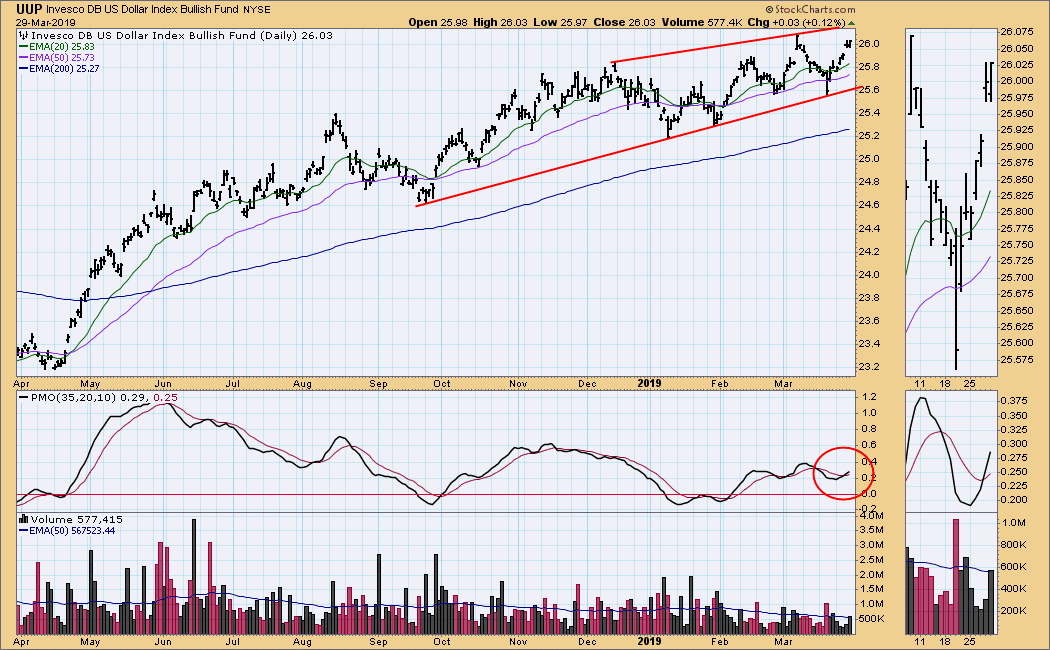
UUP Daily Chart: Price is in a loose rising wedge and will not be forced into resolution anytime soon.
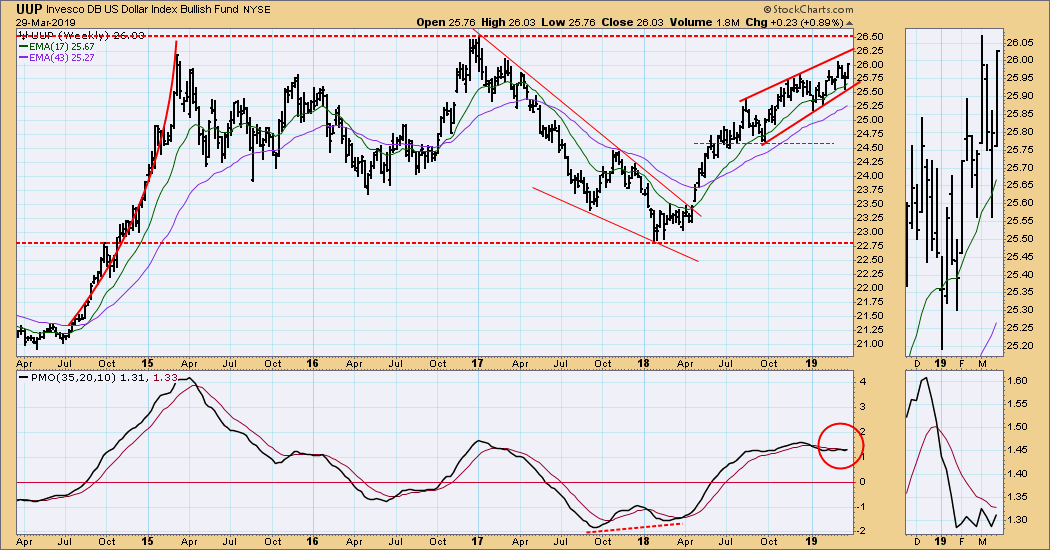
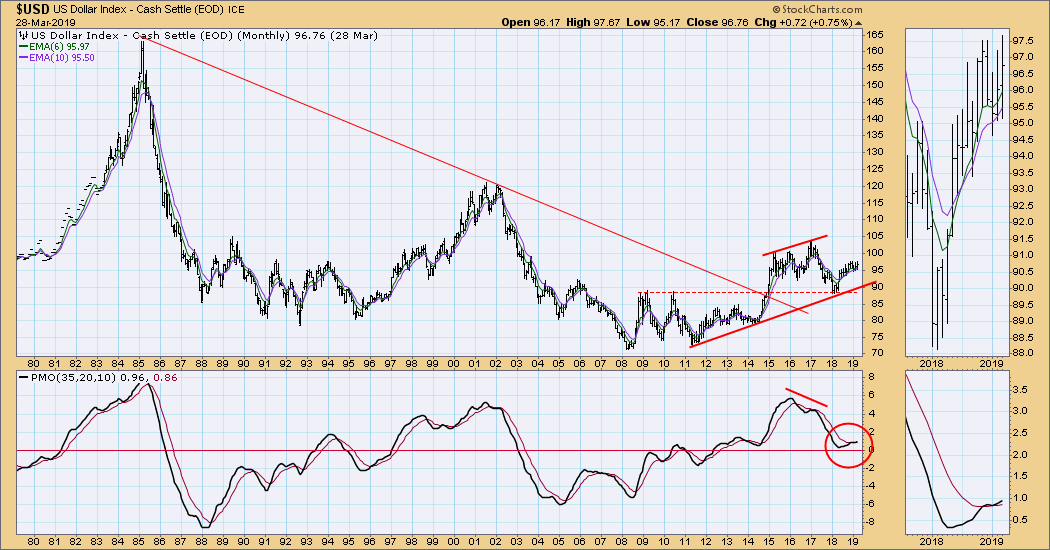
UUP Weekly Chart: In this broader context we can see that price is approaching the top of a 4-year trading range. The weekly PMO has been running sideways all this year, but it is well above the zero line, indicating steady pressure upwards.
$USD Monthly Chart: The dollar is in a rising trend, supported by a positive monthly PMO.
GOLD
IT Trend Model: BUY as of 10/19/2018
LT Trend Model: BUY as of 1/8/2019
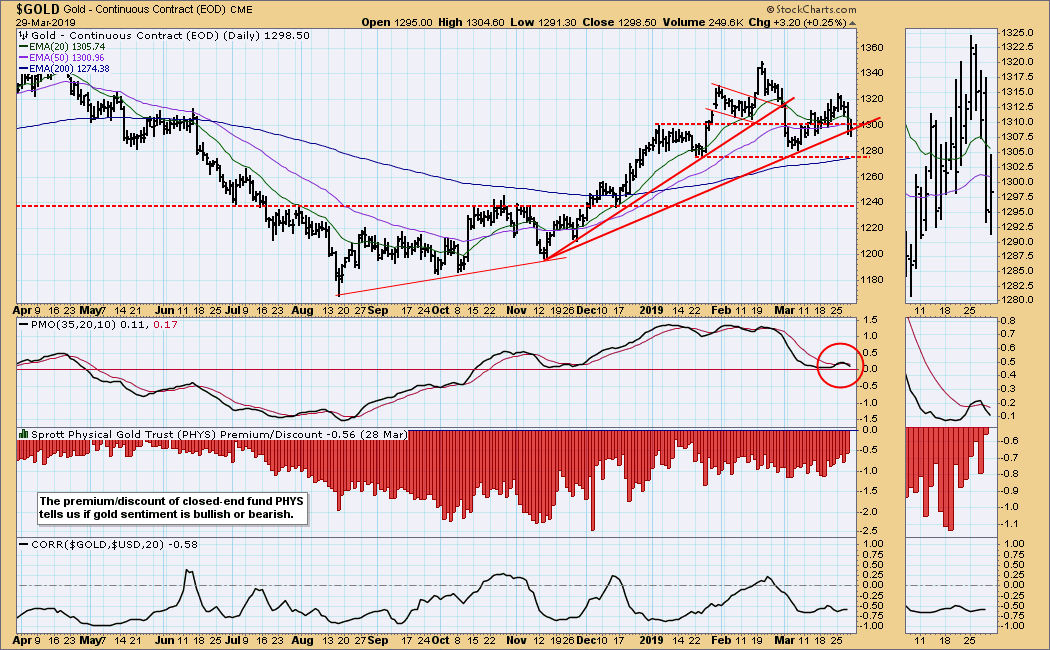
GOLD Daily Chart: Price broke down from a rising trend line at the beginning of this month. An effort to regain lost ground throughout the month ultimately failed this week and over half the gains were lost. There is currently a March top beneath the February top, but a falling trend will not be official until price drops below the March low. The dollar is currently strong, so gold is swimming up stream.
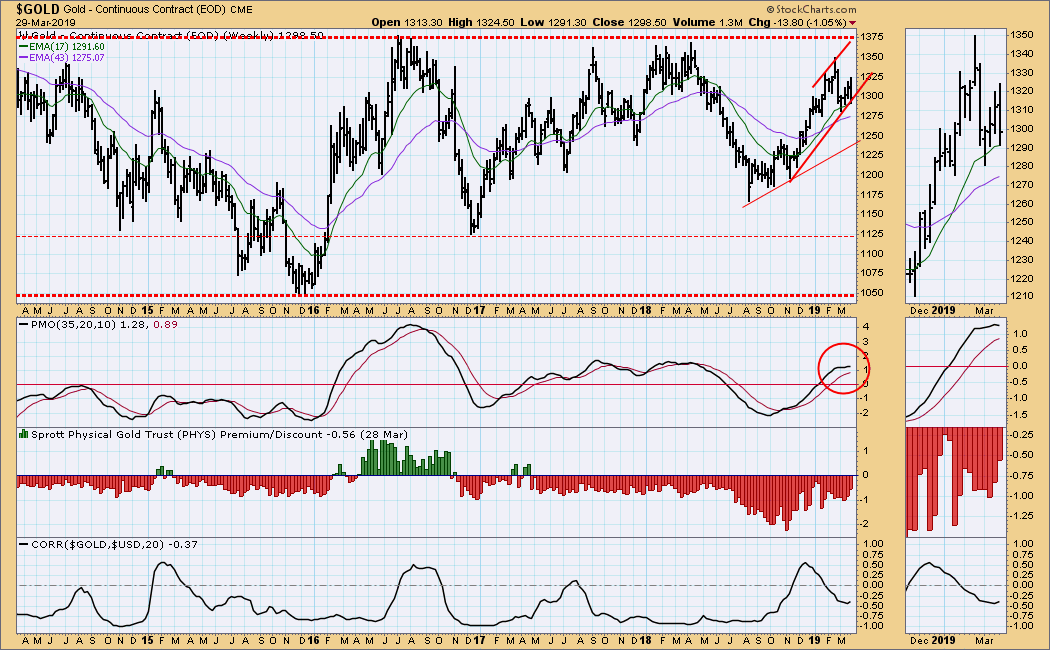
GOLD Weekly Chart: The view in this time frame is a little more positive with price still in a rising trend channel. The weekly PMO is positive and flat.
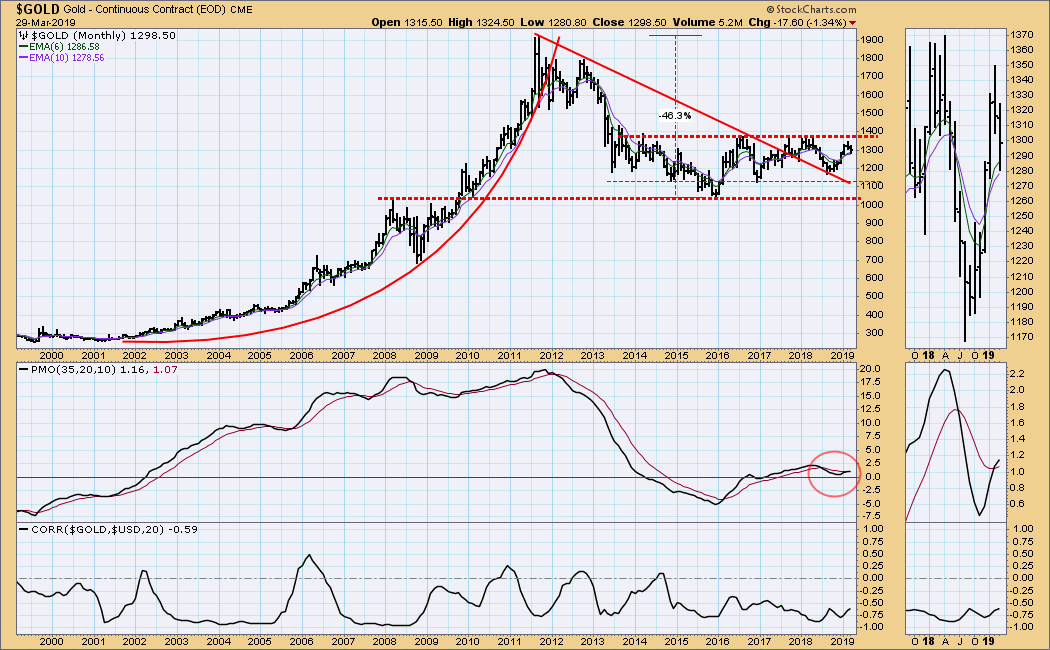
GOLD Monthly Chart: The trading range still dominates.
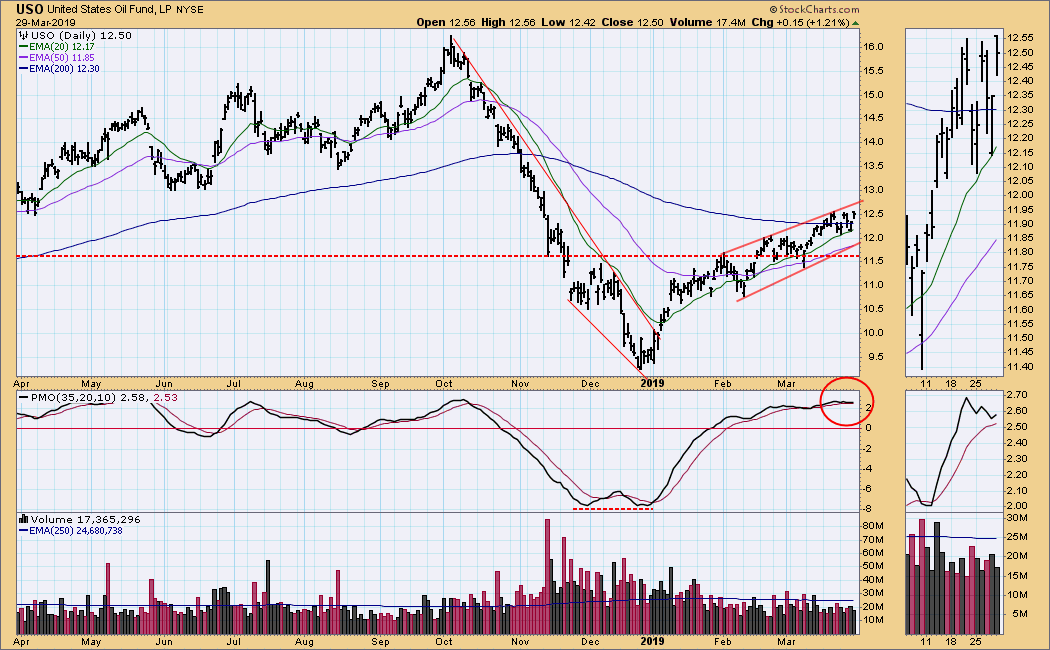
CRUDE OIL (USO)
IT Trend Model: BUY as of 2/19/2019
LT Trend Model: SELL as of 11/23/2018
USO Daily Chart: Price is still in a rising trend channel, with the daily PMO indicating steady upward pressure.
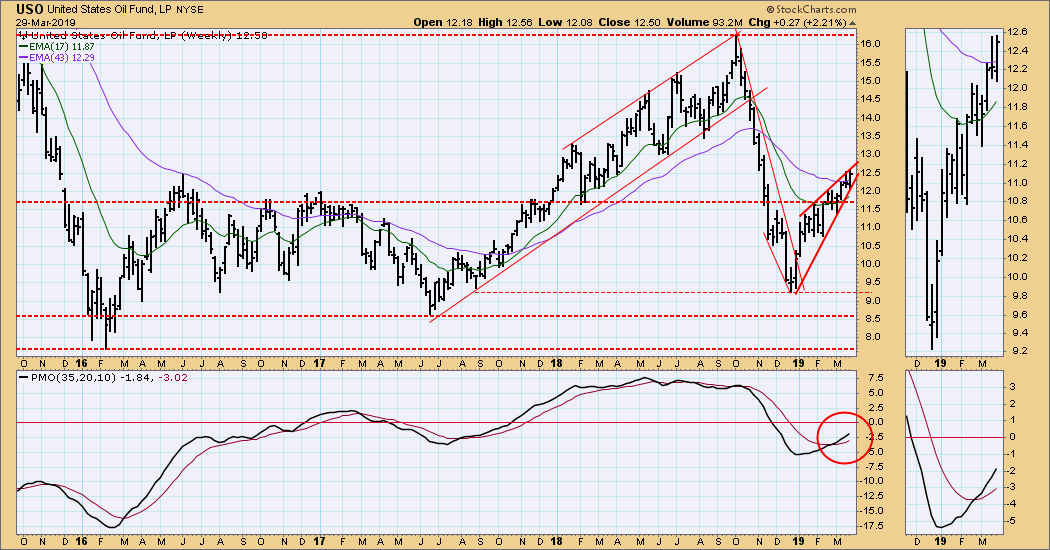
USO Weekly Chart: he rising wedge is a tight one, and it will resolve in a few weeks, probably in a few weeks.
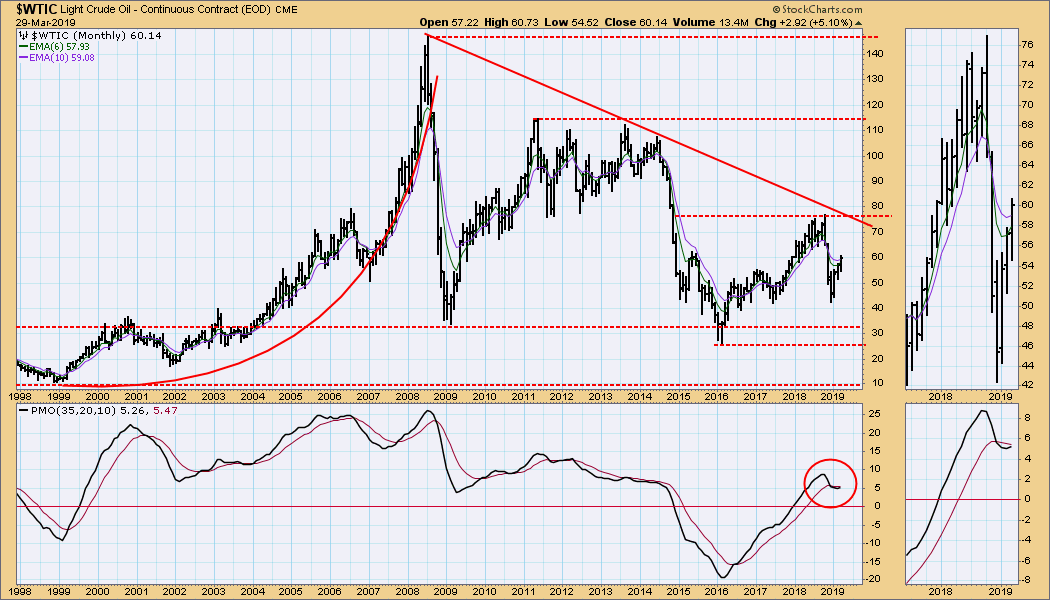
$WTIC Monthly Chart: Last year's top sets a likely upside limit and a reasonable target.
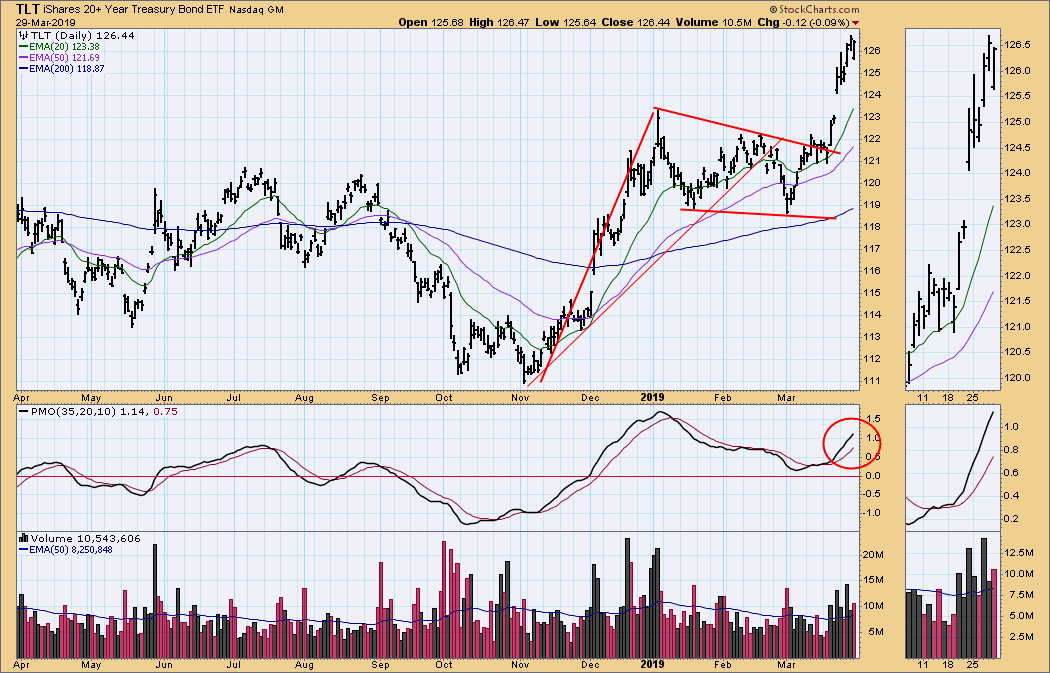
BONDS (TLT)
IT Trend Model: BUY as of 12/6/2018
LT Trend Model: BUY as of 1/2/2019
TLT Daily Chart: Price broke out of a bullish flag formation in a big way. The daily PMO is rising and is moderately overbought.
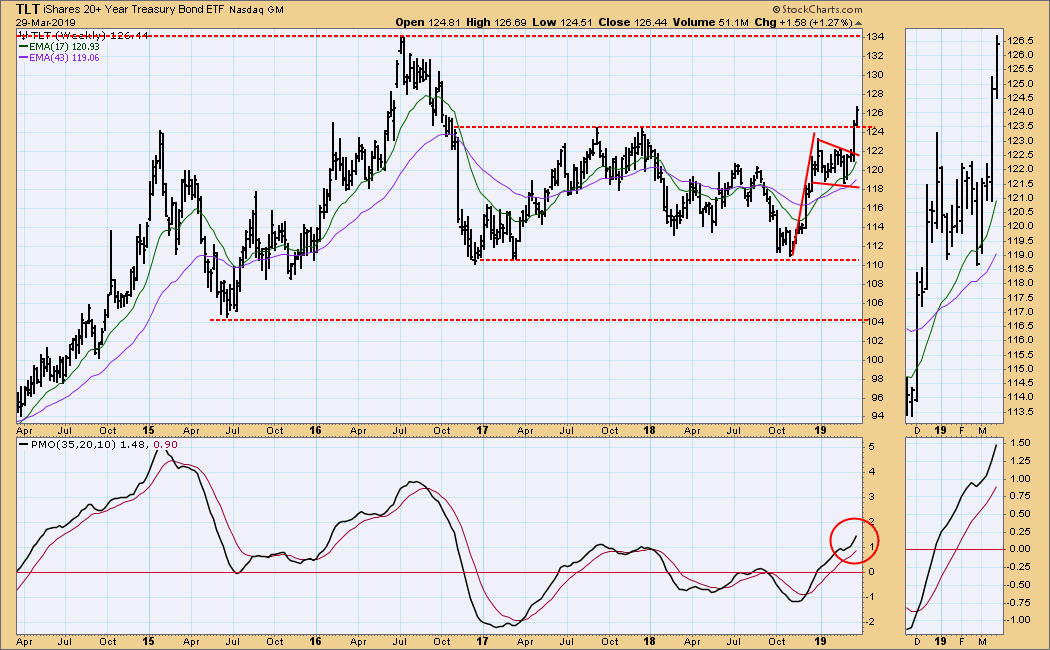
TLT Weekly Chart: In this time frame we see price in the context of a longer-term trading range, with resistance well above. The weekly PMO is rising steeply, and I think there is a good chance for the resistance at 134 to be tested.
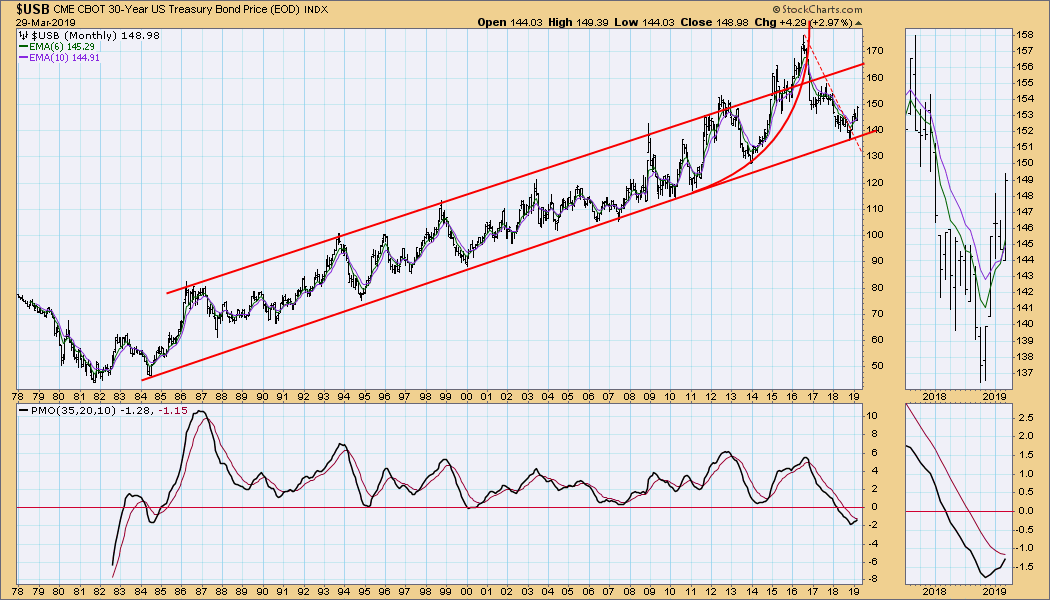
$USB Monthly Chart: The long-term rising trend line support held, and the bullish Fed has bonds in a strong rally.
**Don't miss any of the DecisionPoint commentaries! Go to the "Notify Me" box toward the end of this blog page to be notified as soon as they are published.**
Technical Analysis is a windsock, not a crystal ball.
Happy Charting!
- Carl
NOTE: The signal status reported herein is based upon mechanical trading model signals, specifically, the DecisionPoint Trend Model. They define the implied bias of the price index based upon moving average relationships, but they do not necessarily call for a specific action. They are information flags that should prompt chart review. Further, they do not call for continuous buying or selling during the life of the signal. For example, a BUY signal will probably (but not necessarily) return the best results if action is taken soon after the signal is generated. Additional opportunities for buying may be found as price zigzags higher, but the trader must look for optimum entry points. Conversely, exit points to preserve gains (or minimize losses) may be evident before the model mechanically closes the signal.
Helpful DecisionPoint Links:
DecisionPoint Shared ChartList and DecisionPoint Chart Gallery
Price Momentum Oscillator (PMO)
Swenlin Trading Oscillators (STO-B and STO-V)
