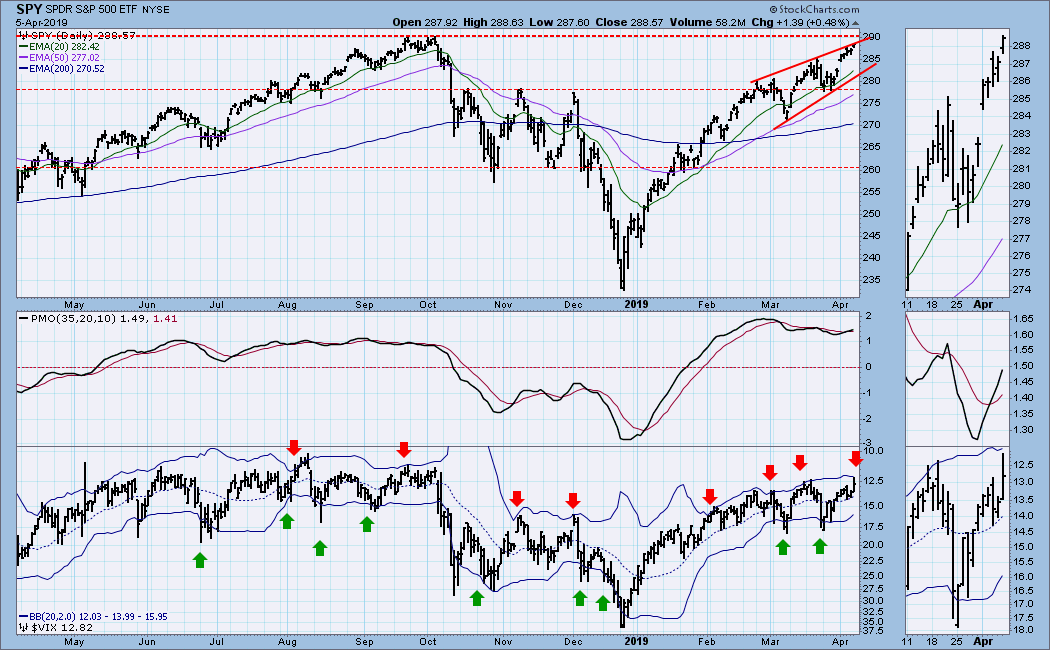
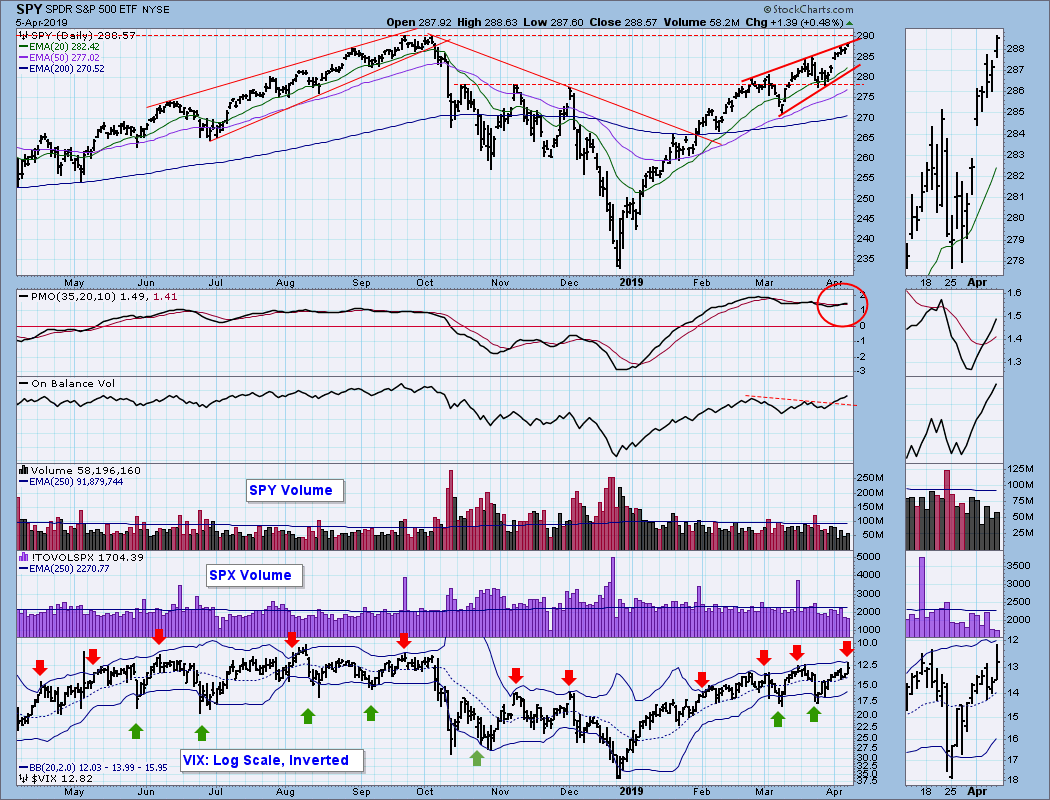
An inverted VIX with Bollinger Bands is a pretty good overbought/oversold indicator, and it is overbought when the VIX hits the upper band as it almost did today. "Almost" might be good enough this time, or we may have to wait a few days for the real deal, but it is close enough to get my attention. Not only is the VIX overbought, the S&P 500 (SPY) has nearly reached last year's all-time highs, which is a significant level of overhead resistance. Below we will be looking at the condition of other indicators to see if they pose additional obstacles to higher prices.
The DecisionPoint Weekly Wrap presents an end-of-week assessment of the trend and condition of the stock market (S&P 500), the U.S. Dollar, Gold, Crude Oil, and Bonds.
Watch the latest episode of DecisionPoint on StockCharts TV's YouTube channel here!
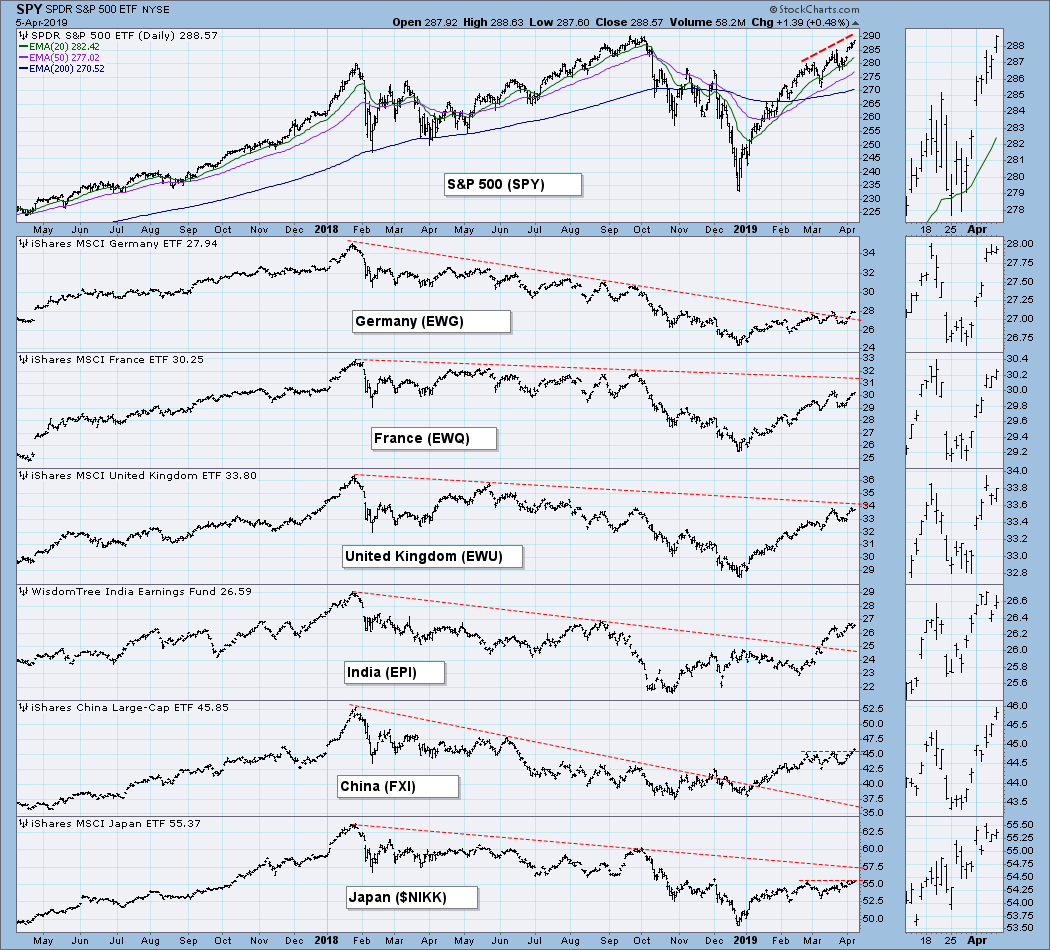
GLOBAL MARKETS
Our list of selected global markets shows that all-time highs were reached in early-2018, and that bear market lows were reached at the end of 2018. The S&P 500 was and is more vigorous, making its record high and bear market low in late-2018, and it is currently ahead of the others in challenging its old record.
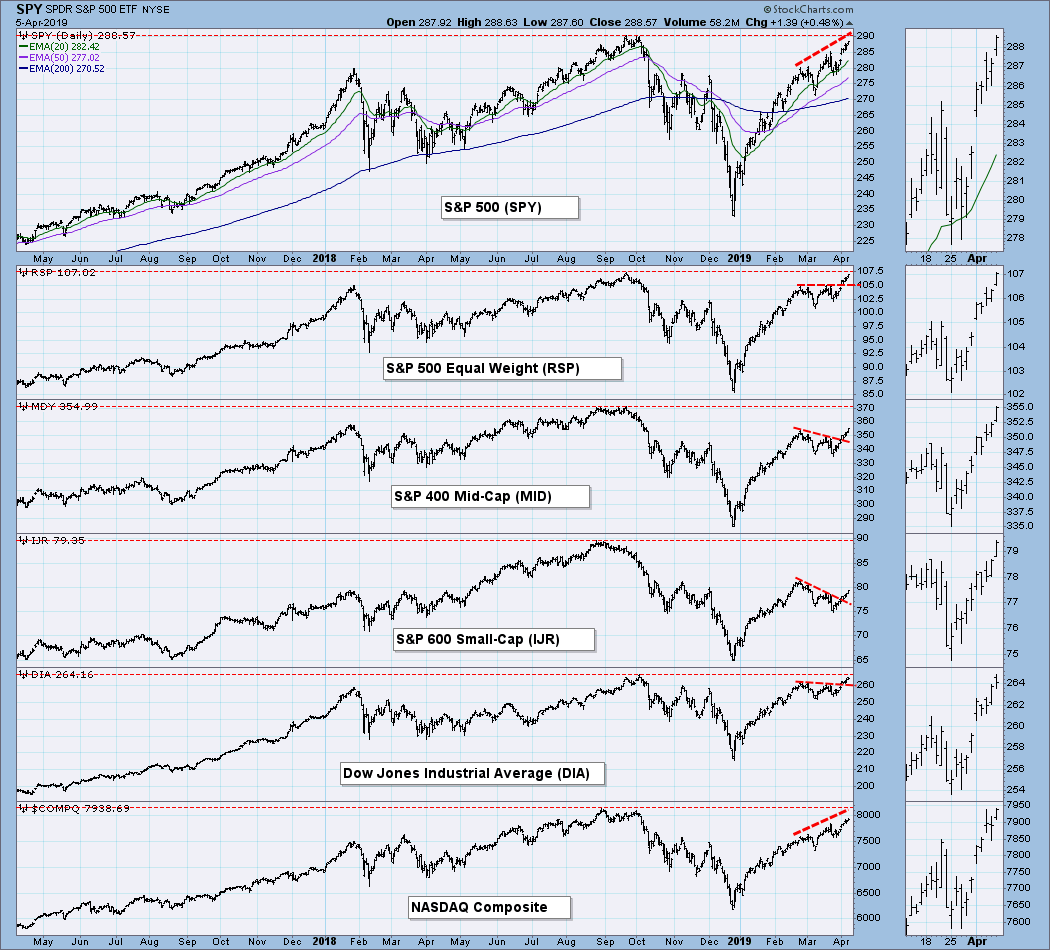
BROAD MARKET INDEXES
February/March declining tops and double tops lines have been overcome. The S&P 600 Small-Cap Index is farthest from its 2018 top (about -11%), but it is positively configured to move higher.
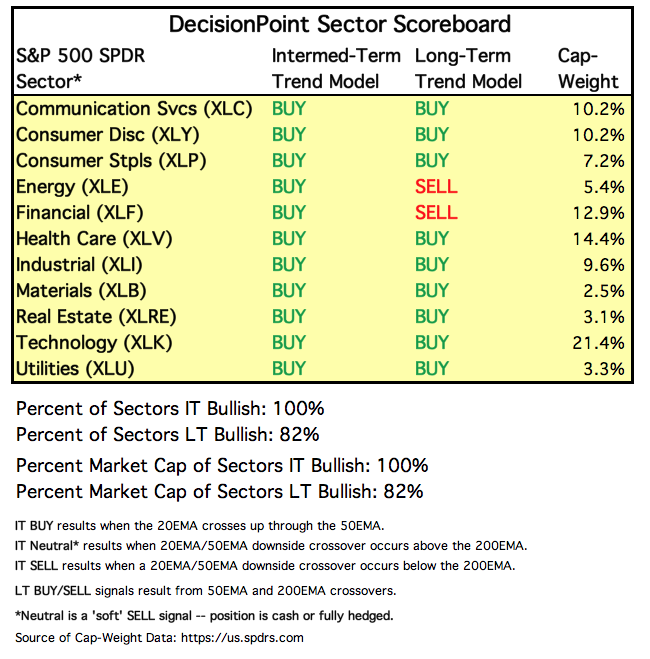
SECTORS
Each S&P 500 Index component stock is assigned to one, and only one, of 11 major sectors. This is a snapshot of the Intermediate-Term and Long-Term Trend Model signal status for those sectors.
STOCKS
IT Trend Model: BUY as of 2/1/2019
LT Trend Model: BUY as of 2/26/2019
SPY Daily Chart: The daily PMO shows that price has been moving higher at a steady pace for about five weeks, but price is in a rising wedge, the top of which will provide additional resistance just as the line drawn across the all-time highs comes into play. Note that SPX Volume for the last few weeks has frequently been substandard.
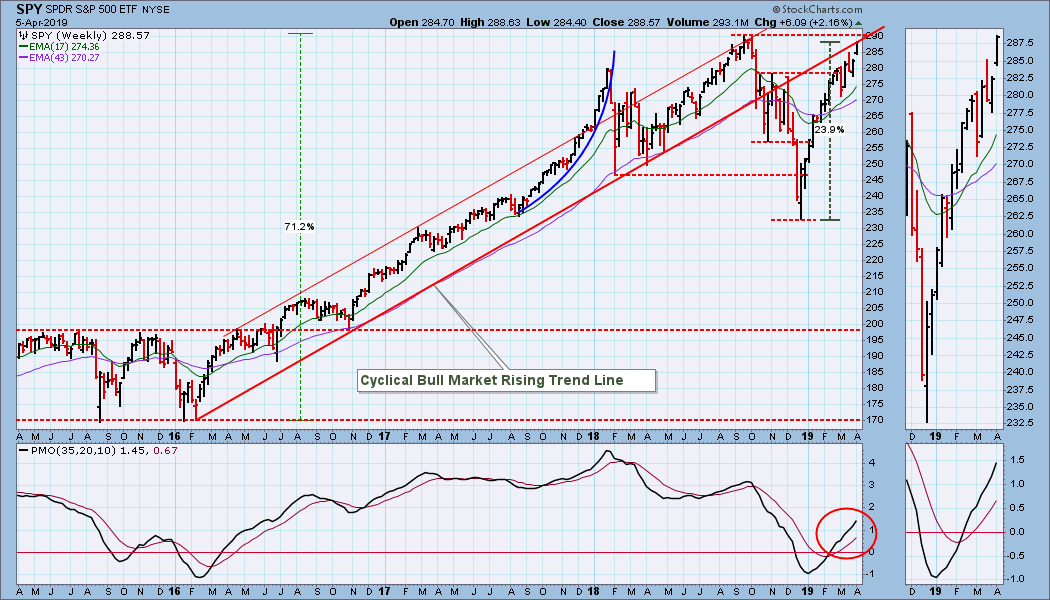
SPY Weekly Chart: Price has finally bumped into the cyclical bull market rising trend line, but the weekly PMO is very positive.
 Climactic Market Indicators: New Highs hit a rally high on Monday, but they faded the rest of the week.
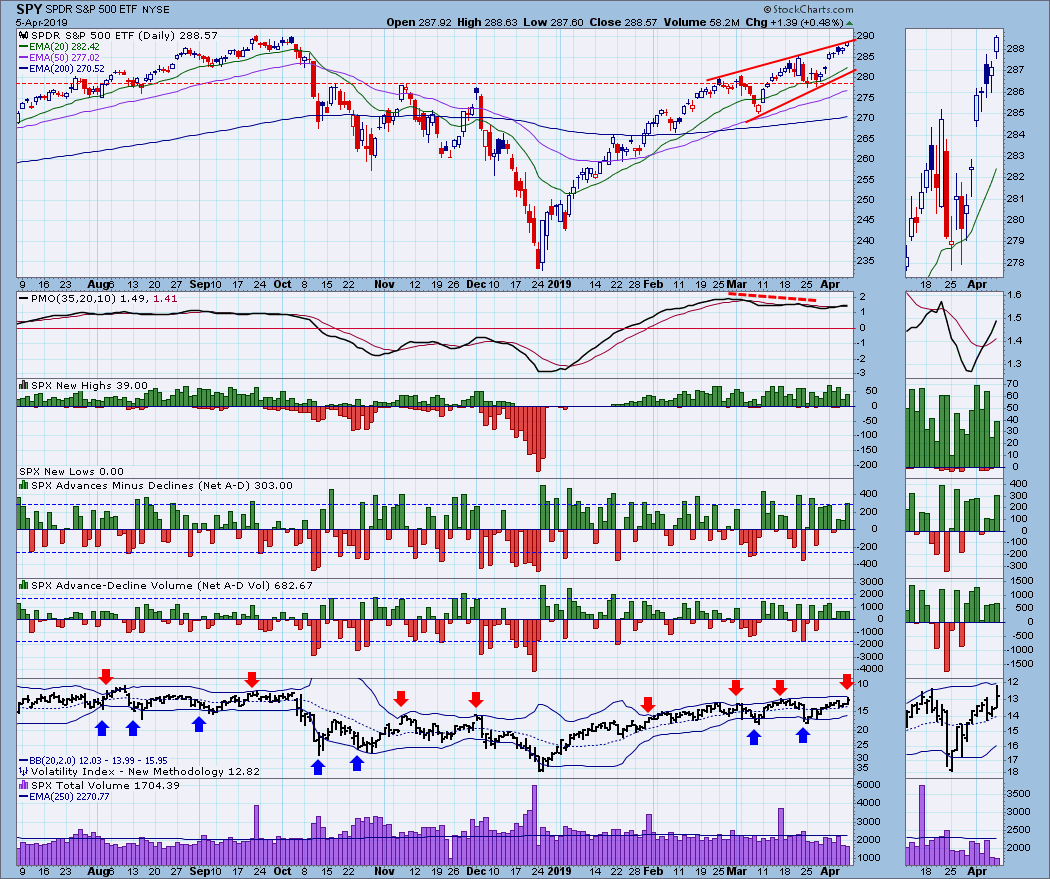
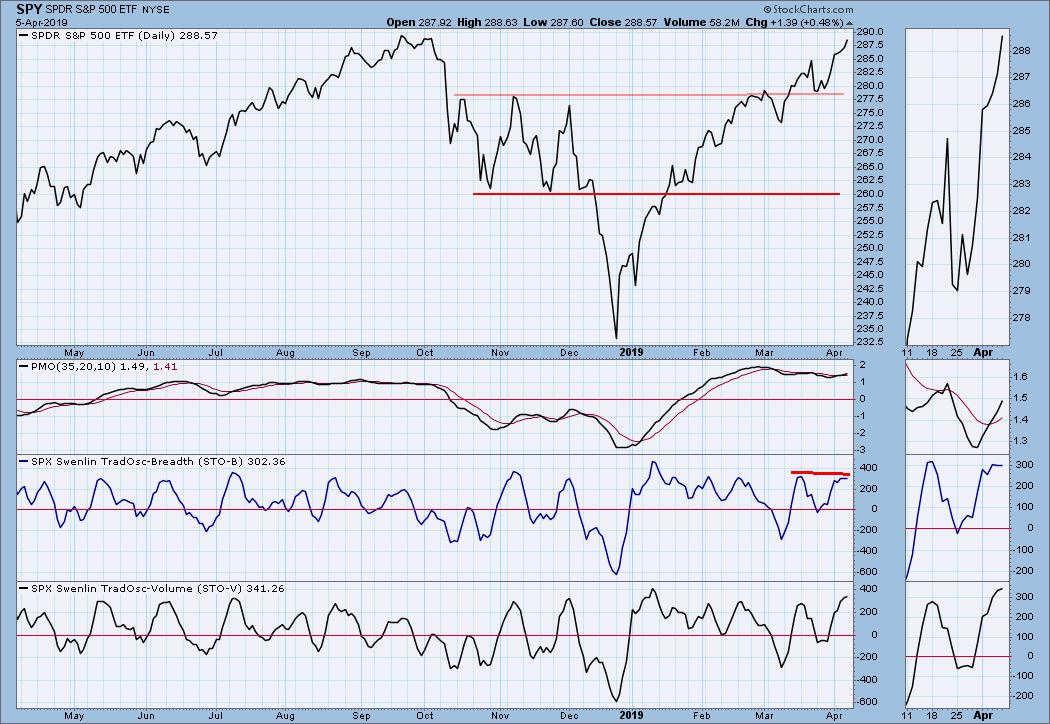
Short-Term Market Indicators: The STO-B and STO-V are very overbought.
Intermediate-Term Market Indicators: While the ITBM and ITVM are far below their February peaks, they are near the top of their normal range compared to most of their overbought peaks of the last two years.
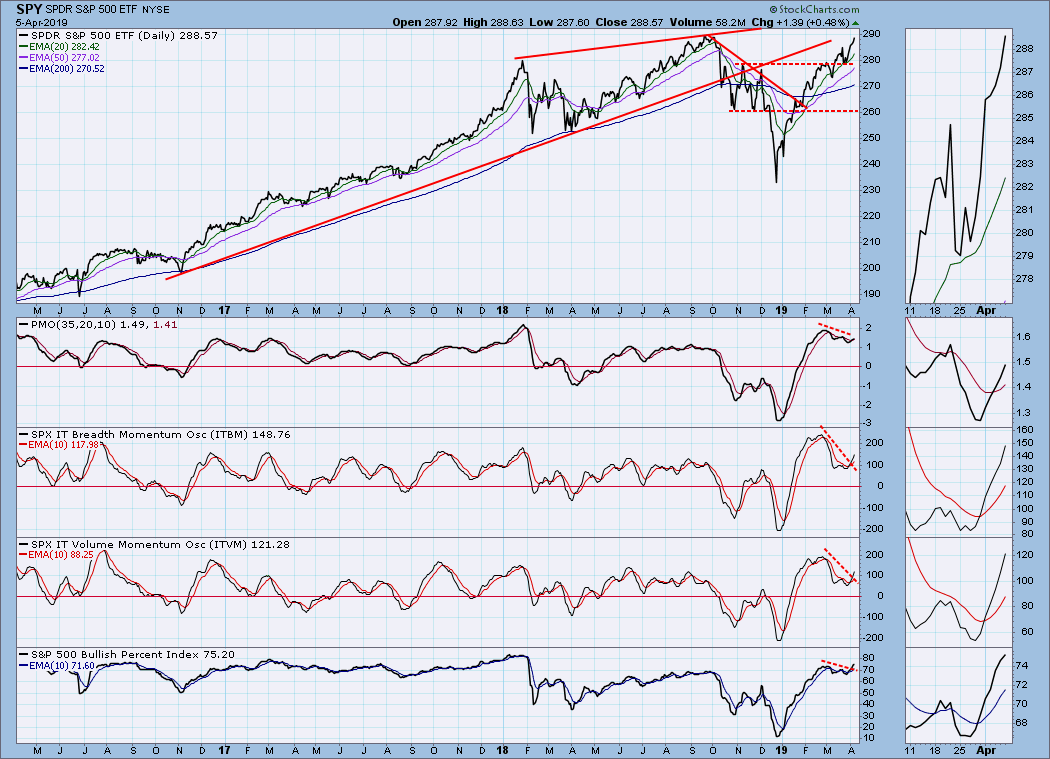
CONCLUSION: The S&P 500 needs only to rally a little more than 48 points (about +1.7%) to set a new record high, and it could do that by accident; however, the market is overbought in all time frames, and major overhead resistance is dead ahead. I also can see the potential for a major double top, so I think that now is not the time to open new longs. Conversely, like Ricky Nelson on Ozzie and Harriet, the market has been irrepressible in its upward push, so, if it is turned back by resistance, it may be a temporary setback.
DOLLAR (UUP)
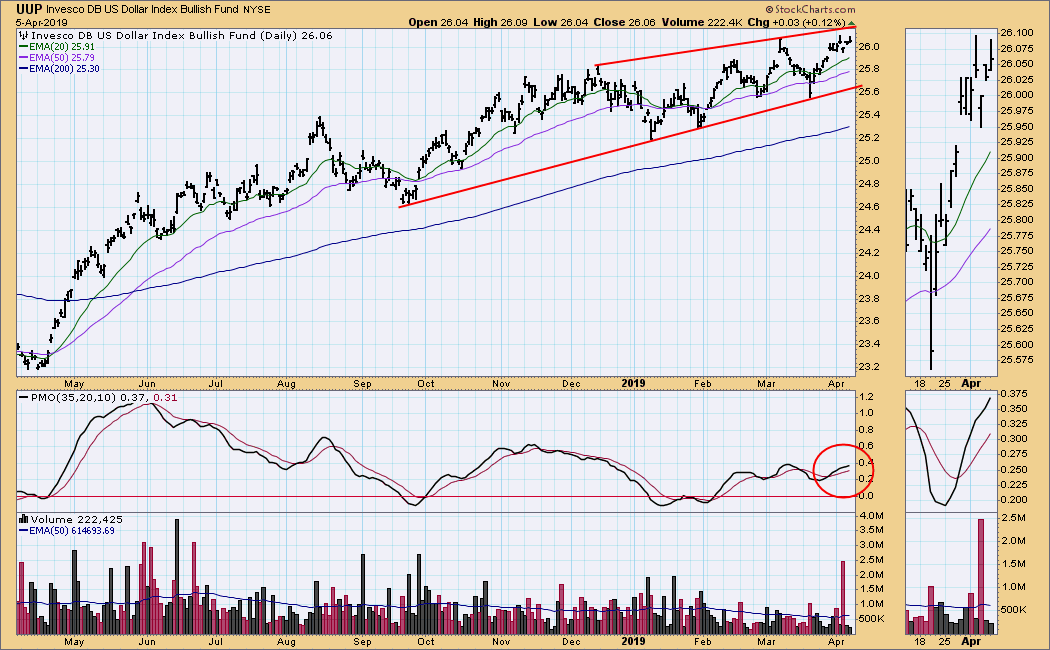
IT Trend Model: BUY as of 2/7/2019
LT Trend Model: BUY as of 5/25/2018
UUP Daily Chart: Price may be challenging the top of the rising wedge formation soon.
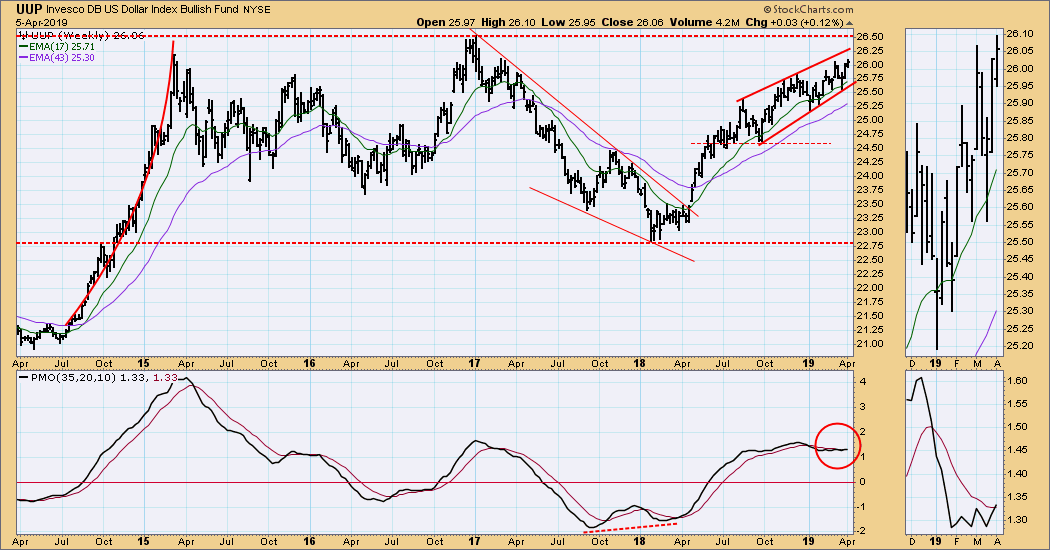
UUP Weekly Chart: While UUP may persist in its push upward, some long-term resistance is not far ahead.
GOLD
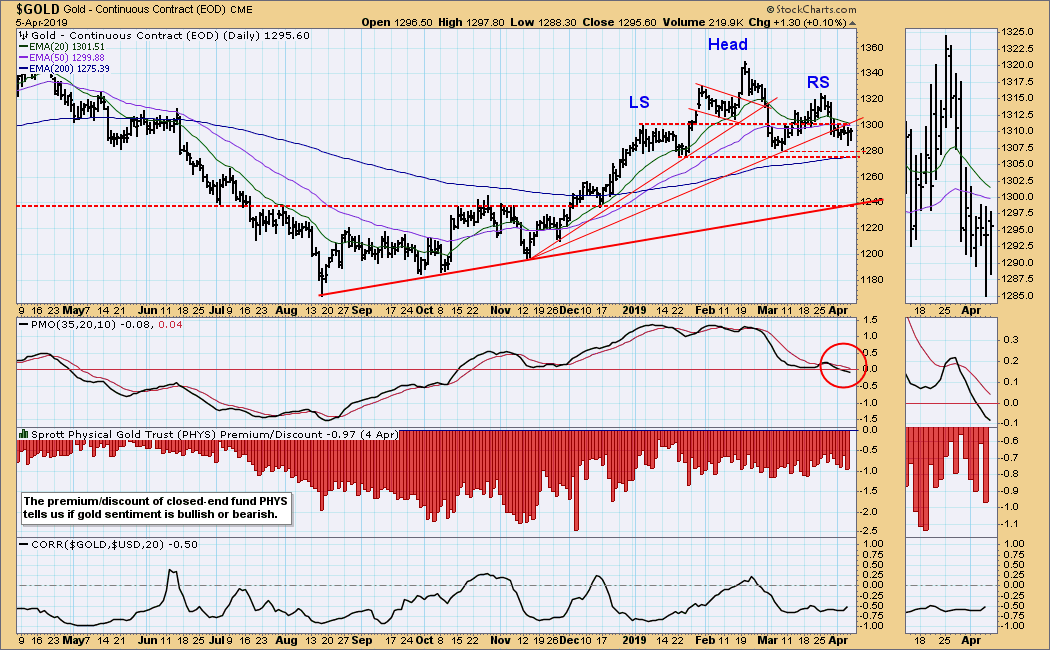
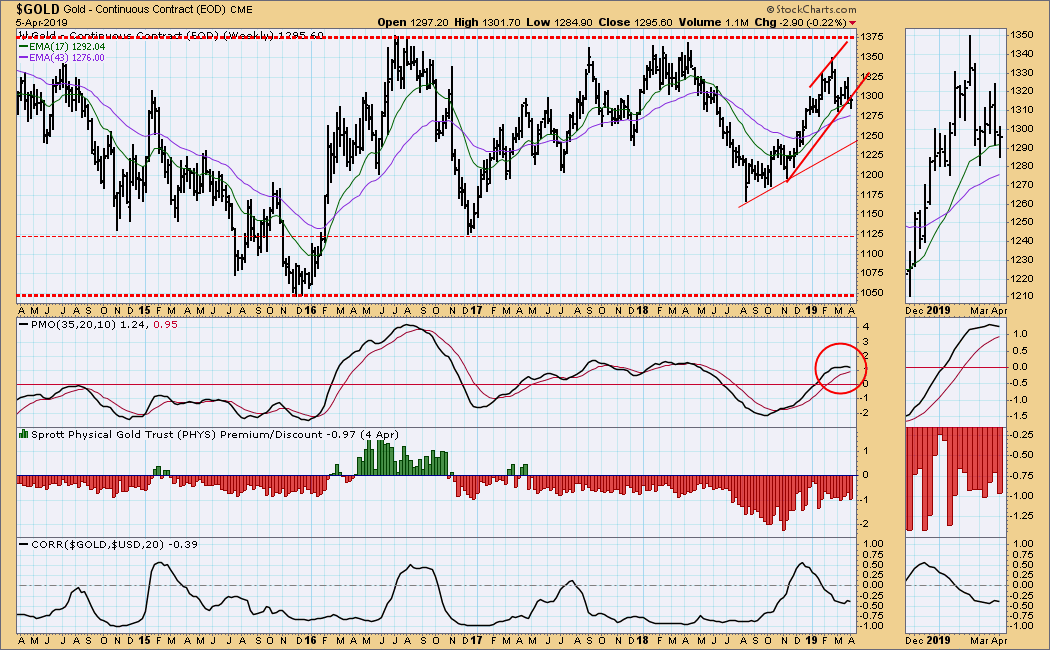
IT Trend Model: BUY as of 10/19/2018
LT Trend Model: BUY as of 1/8/2019
GOLD Daily Chart: Unless there is a rally, the IT Trend Model will change from BUY to NEUTRAL in a week or two. There are support lines at about 1280 drawn from the January and March lows that form the neckline of a bearish head and shoulders pattern. The daily PMO has fallen below the zero line, and the picture is not encouraging.
GOLD Weekly Chart: Gold has fallen below a rising trend line, and the daily PMO has topped. The next visible support (at about 1250) is on a rising trend line drawn from the July 2018 low.
CRUDE OIL (USO)
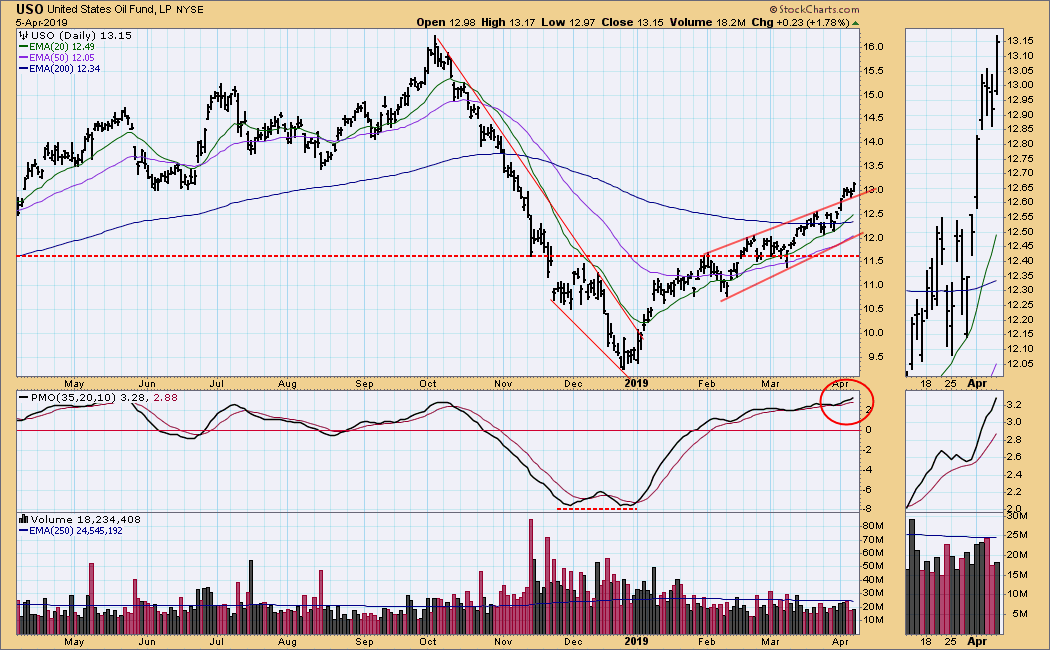
IT Trend Model: BUY as of 2/19/2019
LT Trend Model: SELL as of 11/23/2018
USO Daily Chart: A very loose rising wedge has resolved to the upside, and a continued rally seems likely.
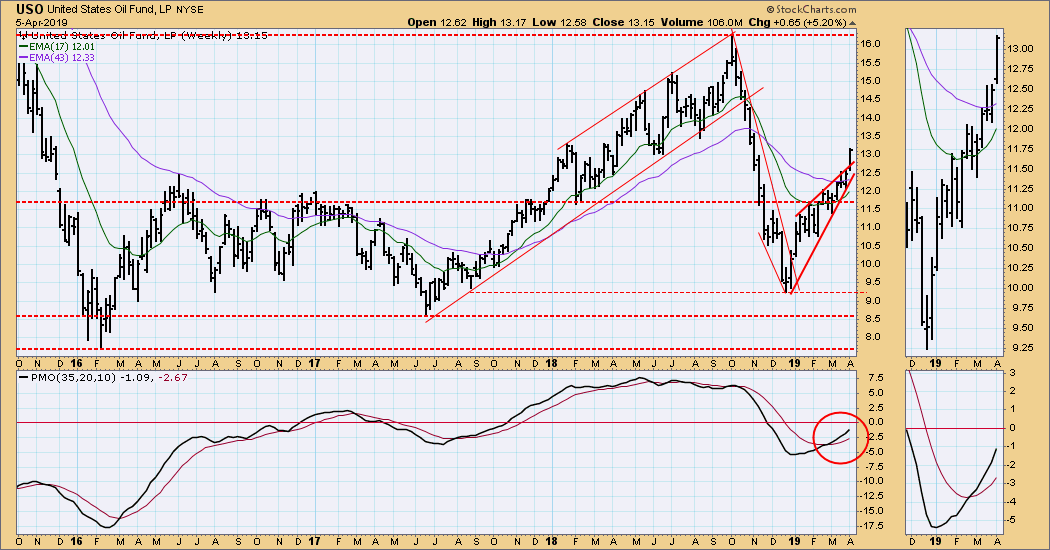
USO Weekly Chart: The bearish rising wedge formation resolved in a bullish direction this week. My assumption is that the 2018 top will be challenged in the coming months.
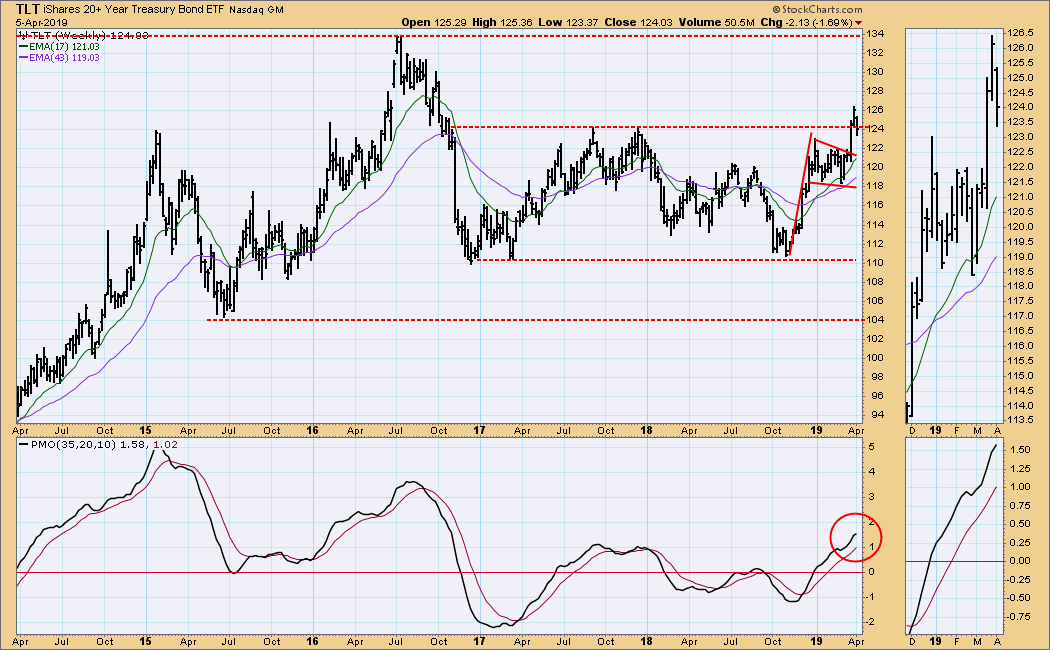
BONDS (TLT)
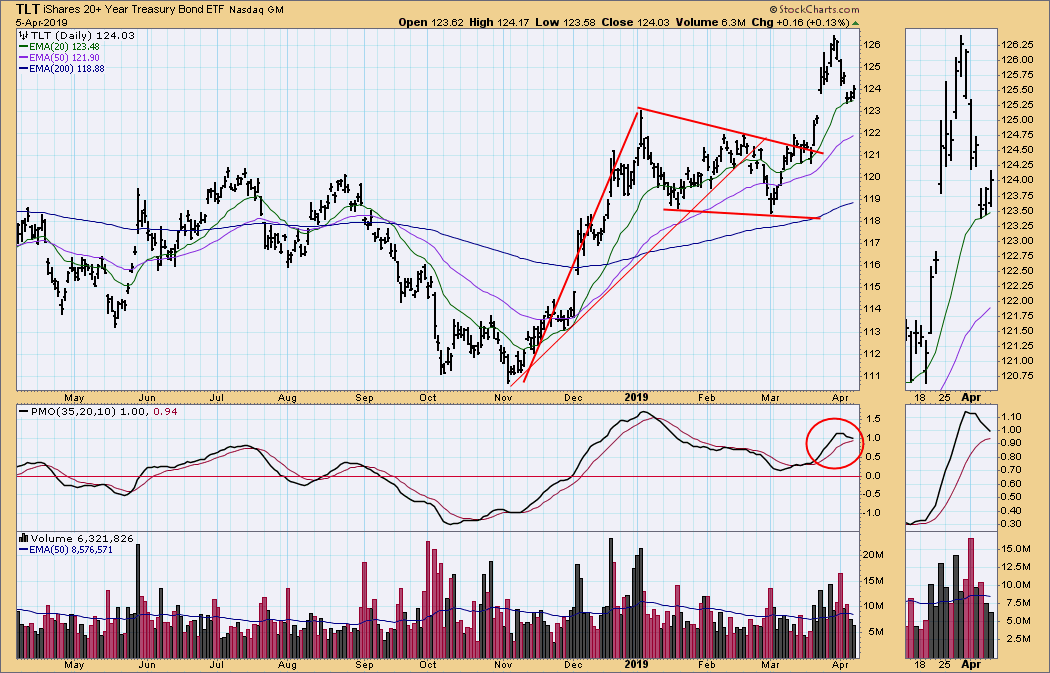
IT Trend Model: BUY as of 12/6/2018
LT Trend Model: BUY as of 1/2/2019
TLT Daily Chart: Price broke out of a flag formation, then gapped higher. This week it pulled back, then gapped down. The gap was filled on Friday, so it is likely price will continue lower. The daily PMO is falling.
TLT Weekly Chart: An important line of resistance was overcome last week, but this week the retest of that line had ambiguous results.
**Don't miss any of the DecisionPoint commentaries! Go to the "Notify Me" box toward the end of this blog page to be notified as soon as they are published.**
Technical Analysis is a windsock, not a crystal ball.
Happy Charting!
- Carl
NOTE: The signal status reported herein is based upon mechanical trading model signals, specifically, the DecisionPoint Trend Model. They define the implied bias of the price index based upon moving average relationships, but they do not necessarily call for a specific action. They are information flags that should prompt chart review. Further, they do not call for continuous buying or selling during the life of the signal. For example, a BUY signal will probably (but not necessarily) return the best results if action is taken soon after the signal is generated. Additional opportunities for buying may be found as price zigzags higher, but the trader must look for optimum entry points. Conversely, exit points to preserve gains (or minimize losses) may be evident before the model mechanically closes the signal.
Helpful DecisionPoint Links:
DecisionPoint Shared ChartList and DecisionPoint Chart Gallery
Price Momentum Oscillator (PMO)
Swenlin Trading Oscillators (STO-B and STO-V)
