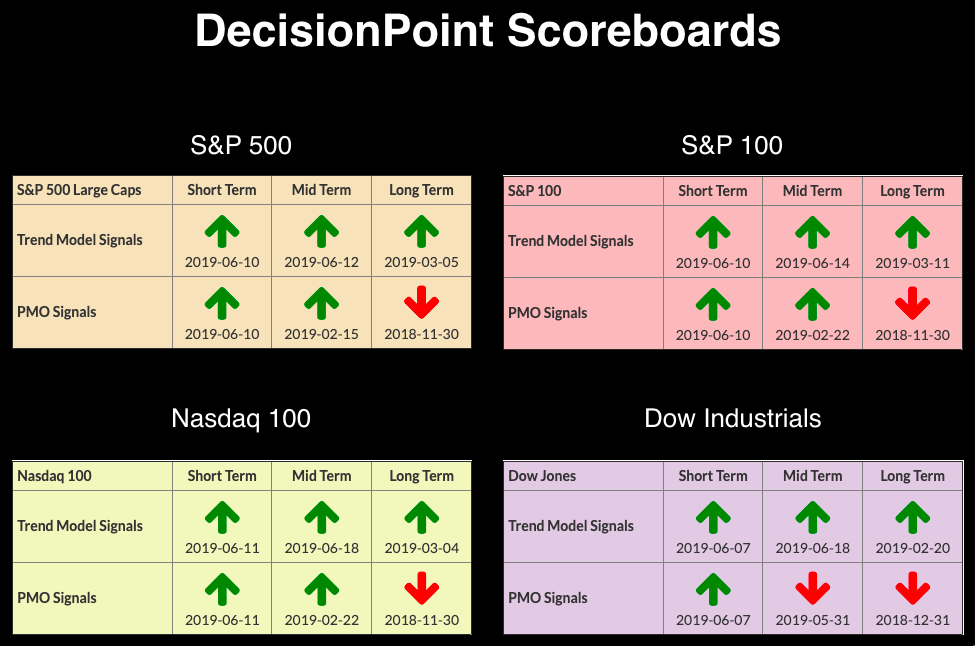
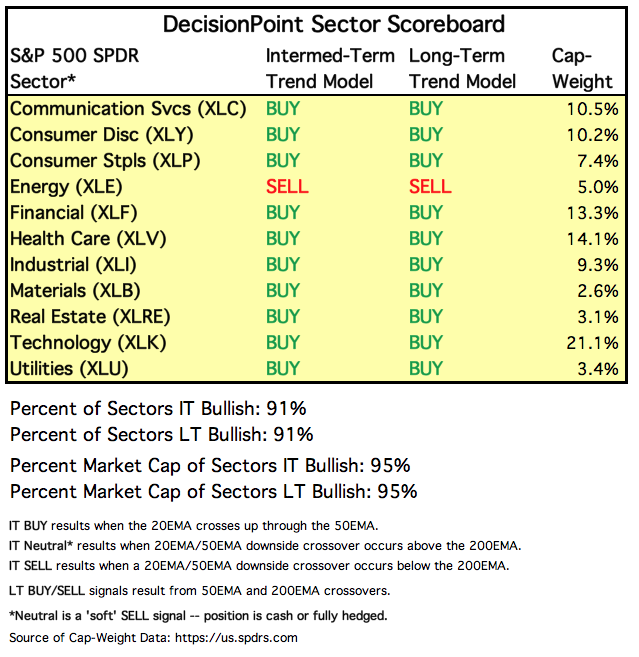
 Yesterday, in a DP Bulletin, I covered the new IT BUY signals on the NDX and Dow. We should soon see the Dow's weekly PMO click a new IT BUY signal. That would only leave the Long-Term PMO SELL signals that still linger on the monthly charts. Indicators, minus the VIX, are very bullish. The DP Sector Scoreboard shows on Energy (XLE) on SELL signals, while the rest are on BUYs in the intermediate and long term.
The DecisionPoint Alert presents a mid-week assessment of the trend and condition of the stock market (S&P 500), the U.S. Dollar, Gold, Crude Oil and Bonds.
Watch the latest episode of DecisionPoint on StockCharts TV's YouTube channel here!
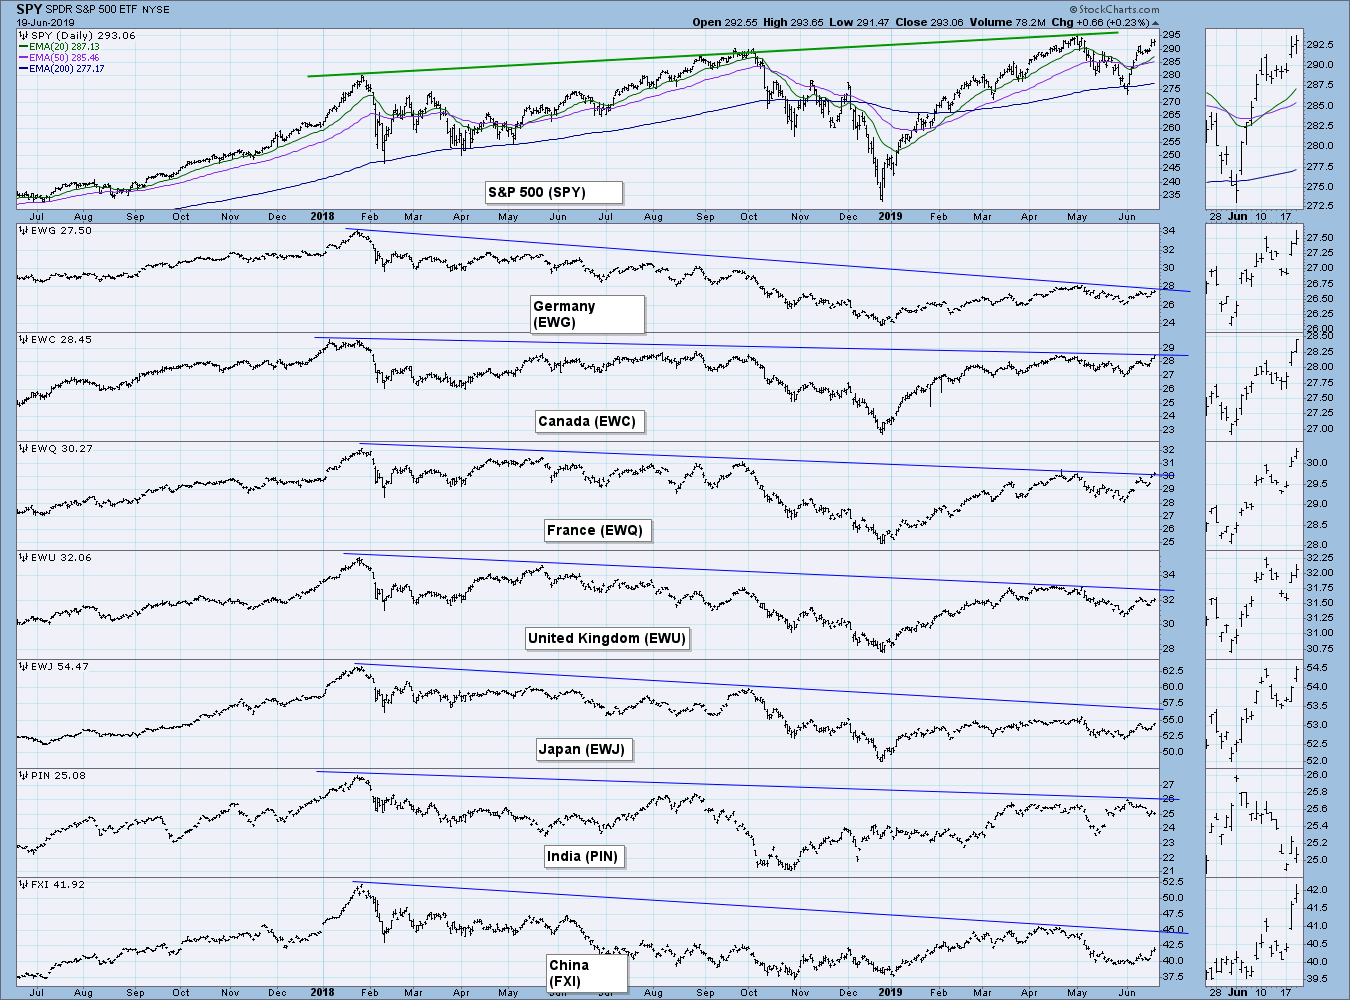
GLOBAL MARKETS
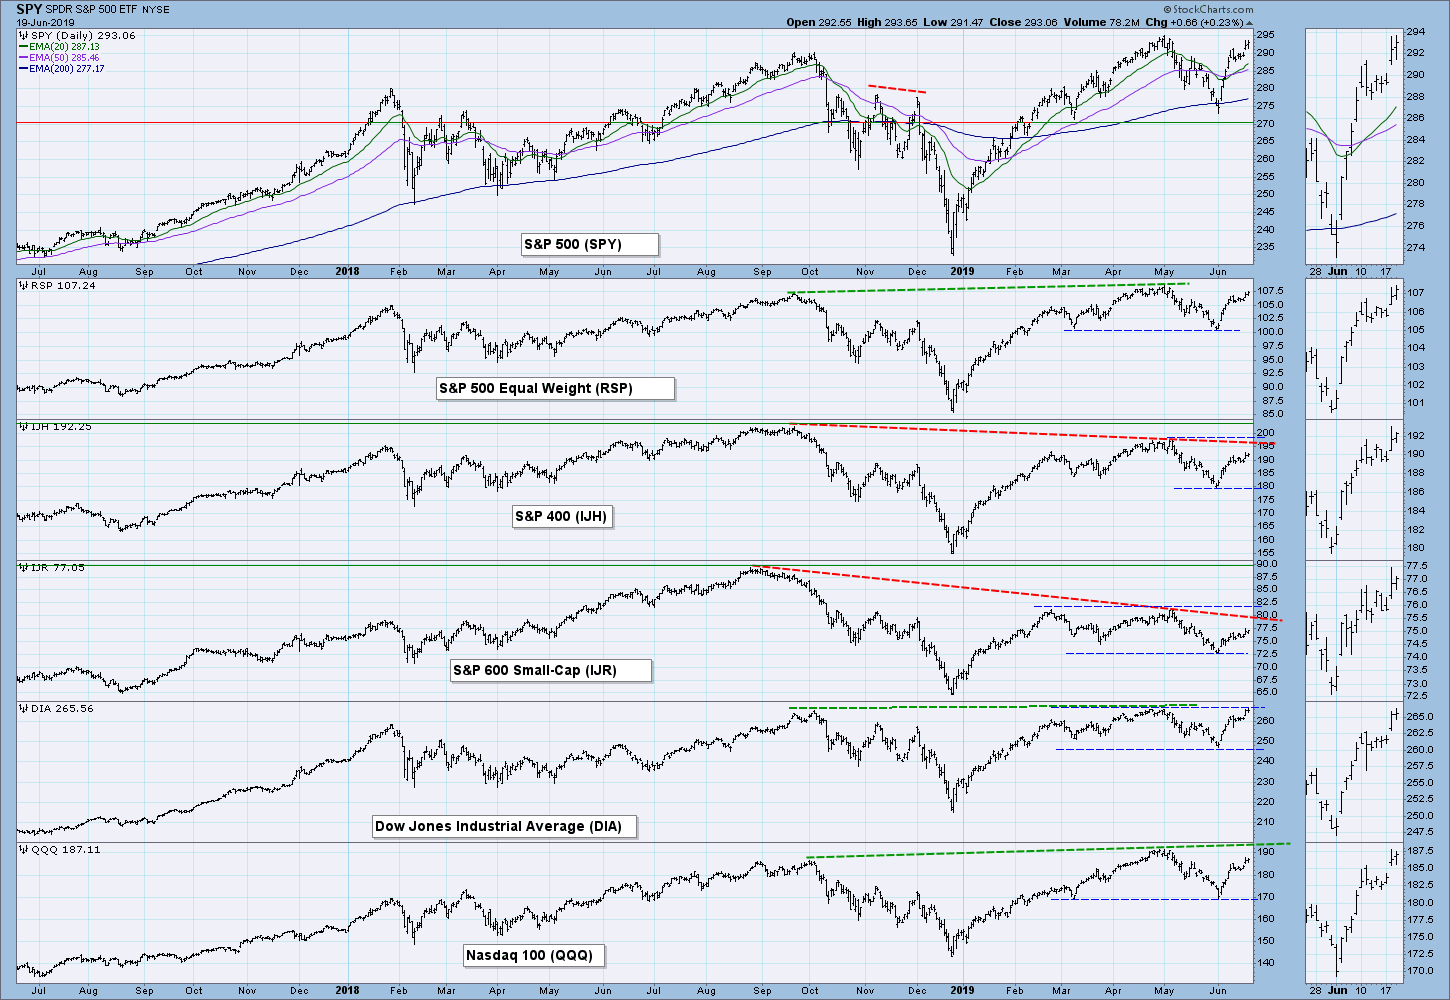
BROAD MARKET INDEXES
SECTORS
Each S&P 500 Index component stock is assigned to one, and only one, of eleven major sectors. This is a snapshot of the Intermediate-Term and Long-Term Trend Model signal status for those sectors.
STOCKS
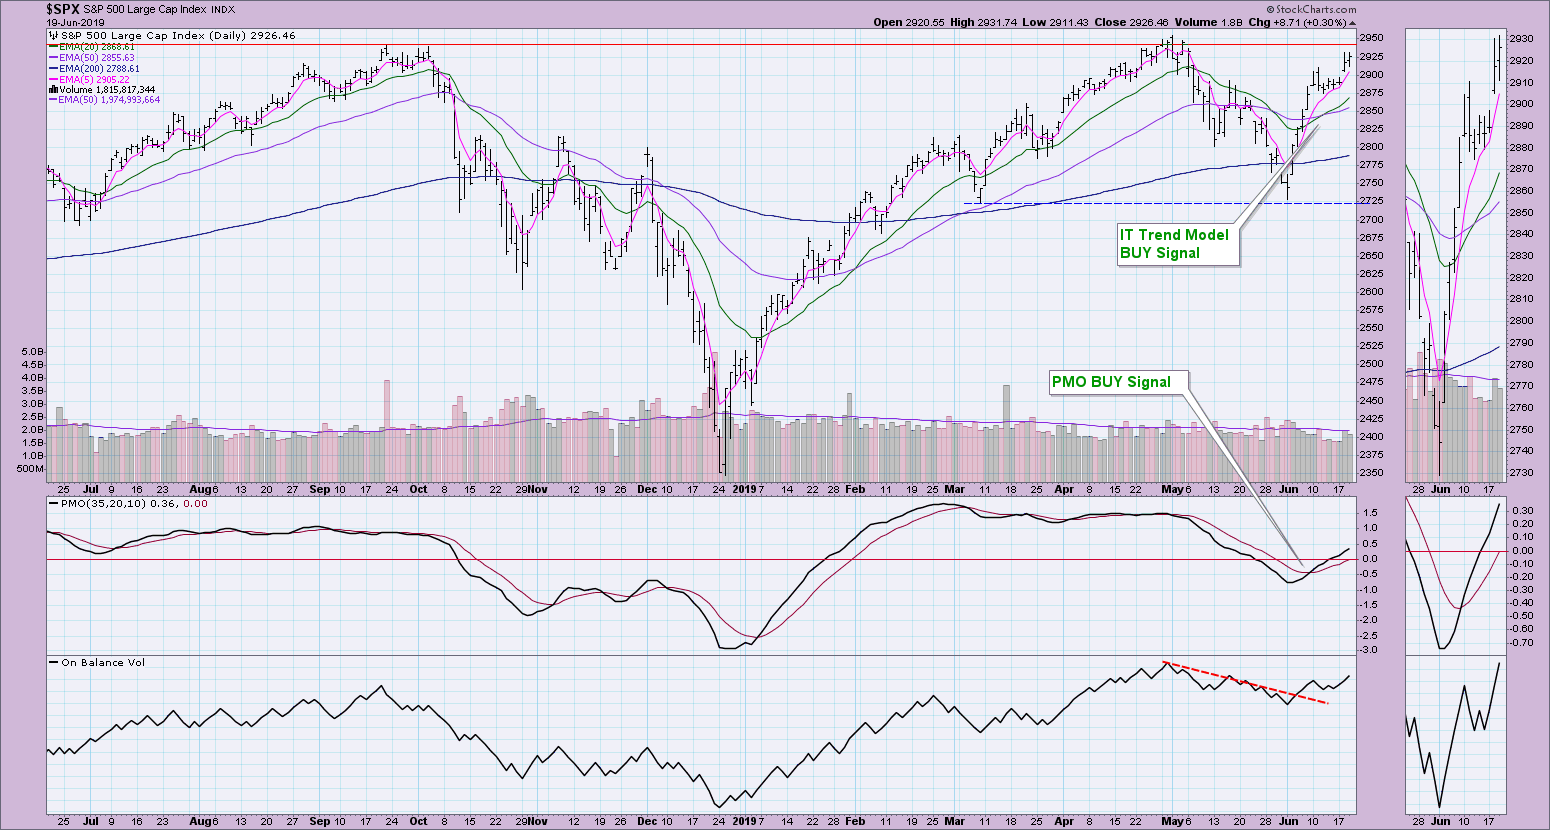
IT Trend Model: BUY as of 6/11/2019
LT Trend Model: BUY (SPY) as of 2/26/2019
SPY Daily Chart: Strong resistance is getting closer and closer at all-time highs. The PMO and OBV are both confirming the rally that picked up yesterday. The PMO is now above zero.
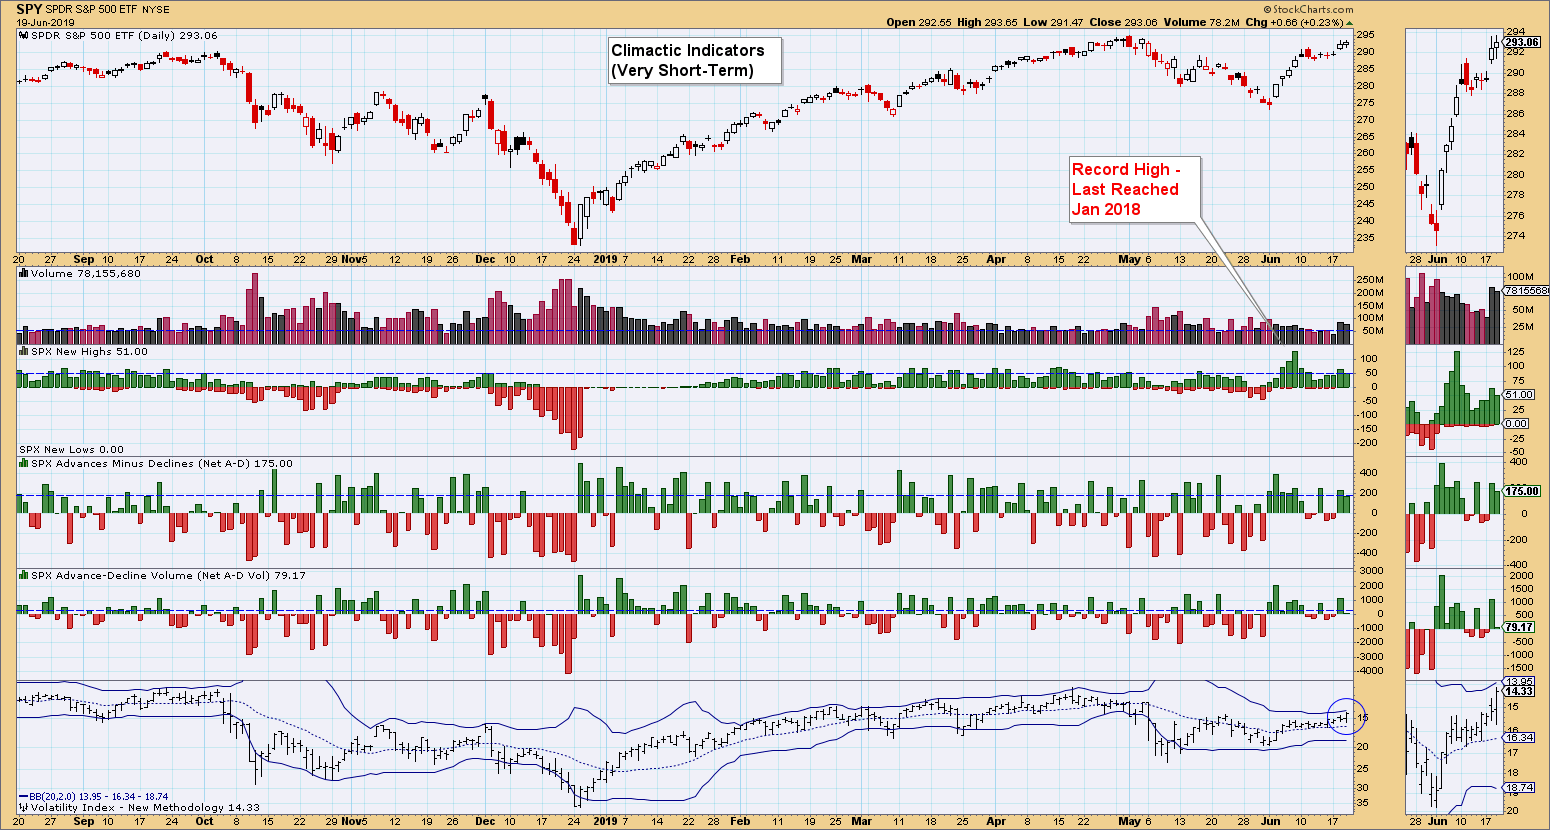
Climactic Market Indicators: The only indicator that currently gives me pause is the VIX, which is closing in on the upper Bollinger Band. Typically, that precedes a decline, and we are seeing bullish breadth pulling back a bit. It might be time to digest this rally - and what a perfect place to do that, right at the resistance of the all-time high.
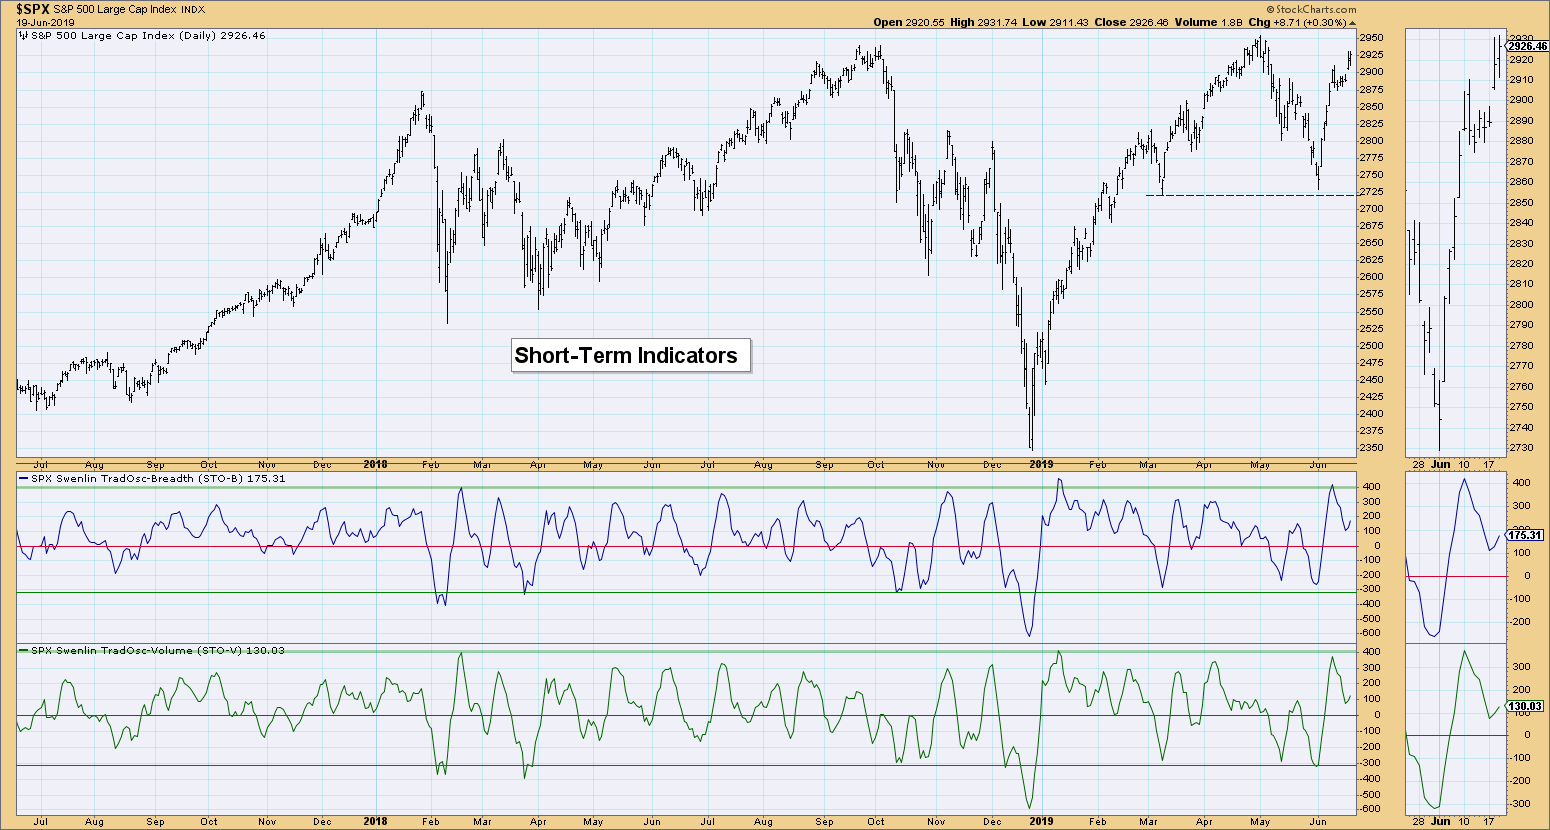
Short-Term Market Indicators: Both indicators have turned up above the zero line, which indicates good internal strength. They are also in neutral territory, leaving plenty of room to move higher.
Intermediate-Term Market Indicators: Both of these are rising nicely and are about to break above declining tops.
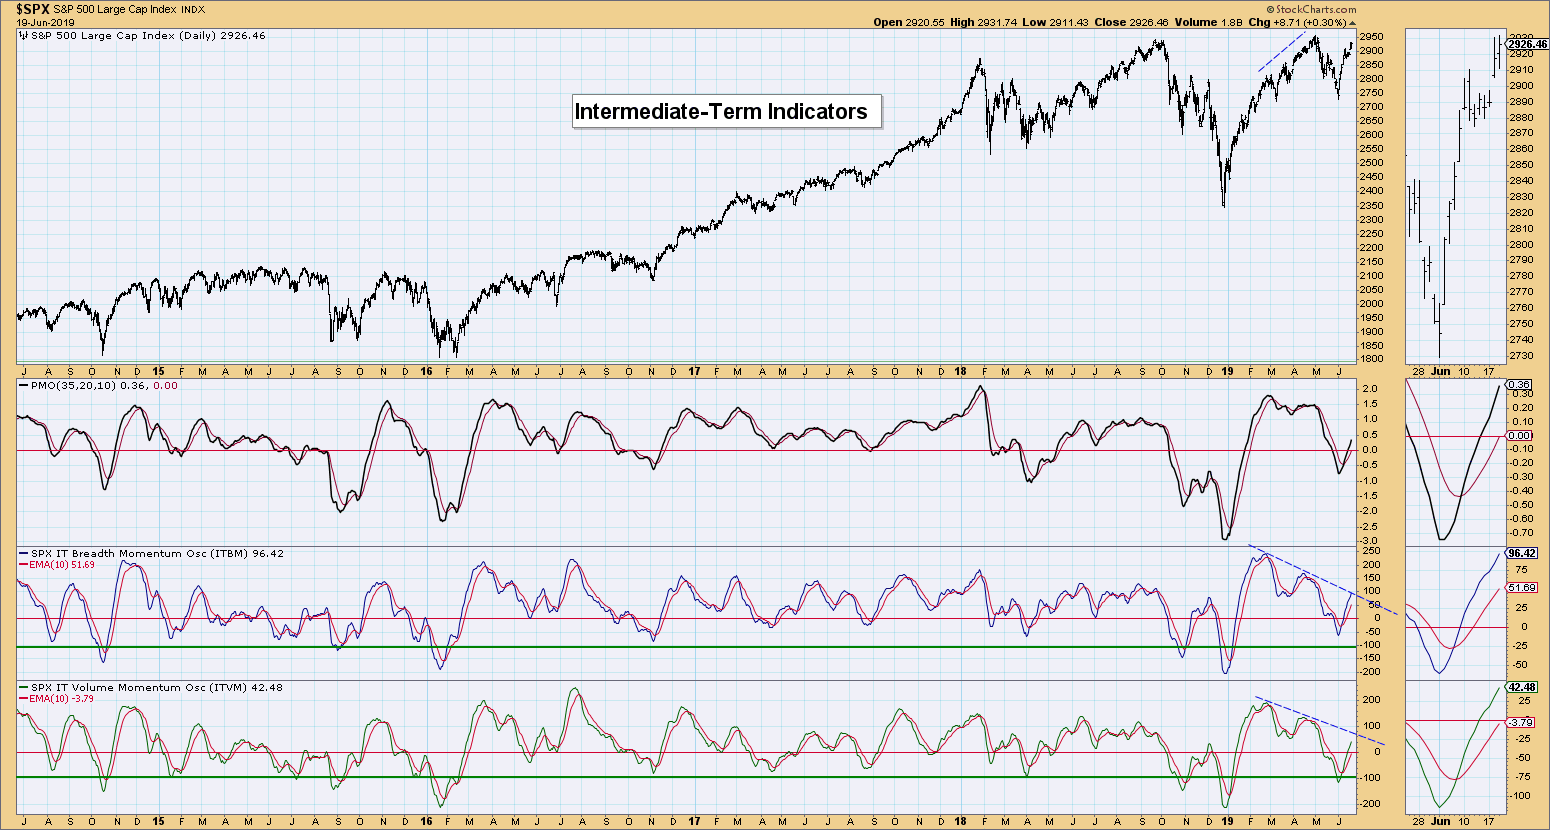
Conclusion: These charts look very bullish. I think the VIX is simply alerting us to a possible pause in the action.
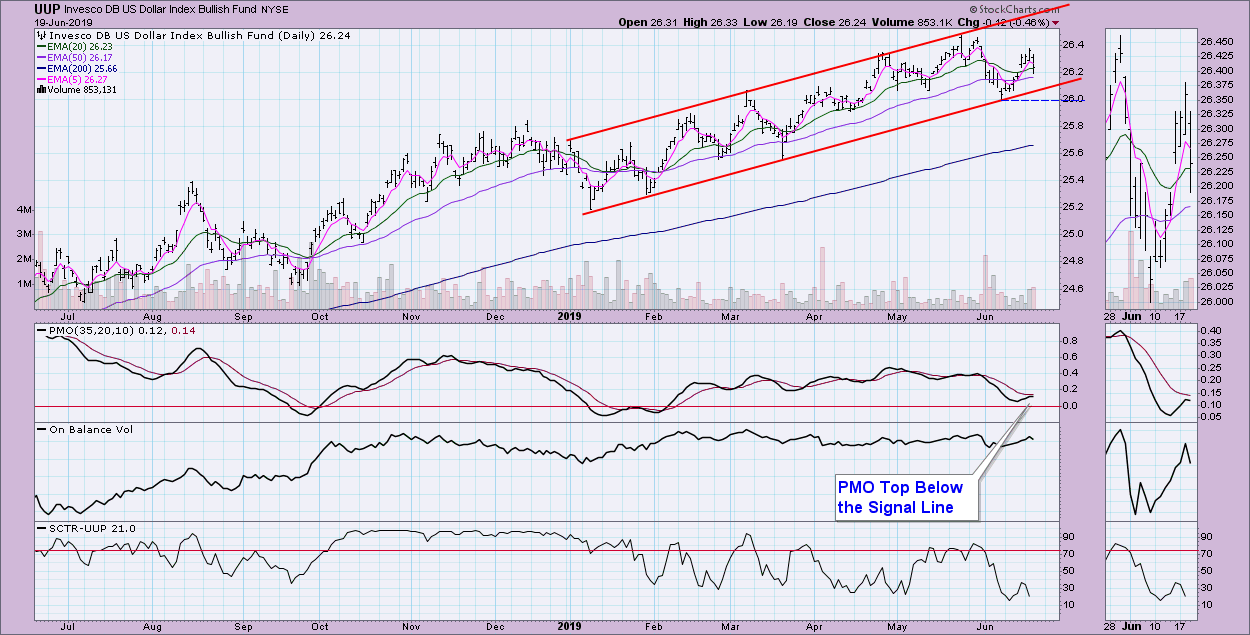
DOLLAR (UUP)
IT Trend Model: BUY as of 2/7/2019
LT Trend Model: BUY as of 5/25/2018
UUP Daily Chart: The Dollar was unable to test the top of the rising trend channel and began heading lower today. With this decline, the PMO has topped below its signal line. I'm looking at a breakdown from the channel and a test at $26 for UUP.
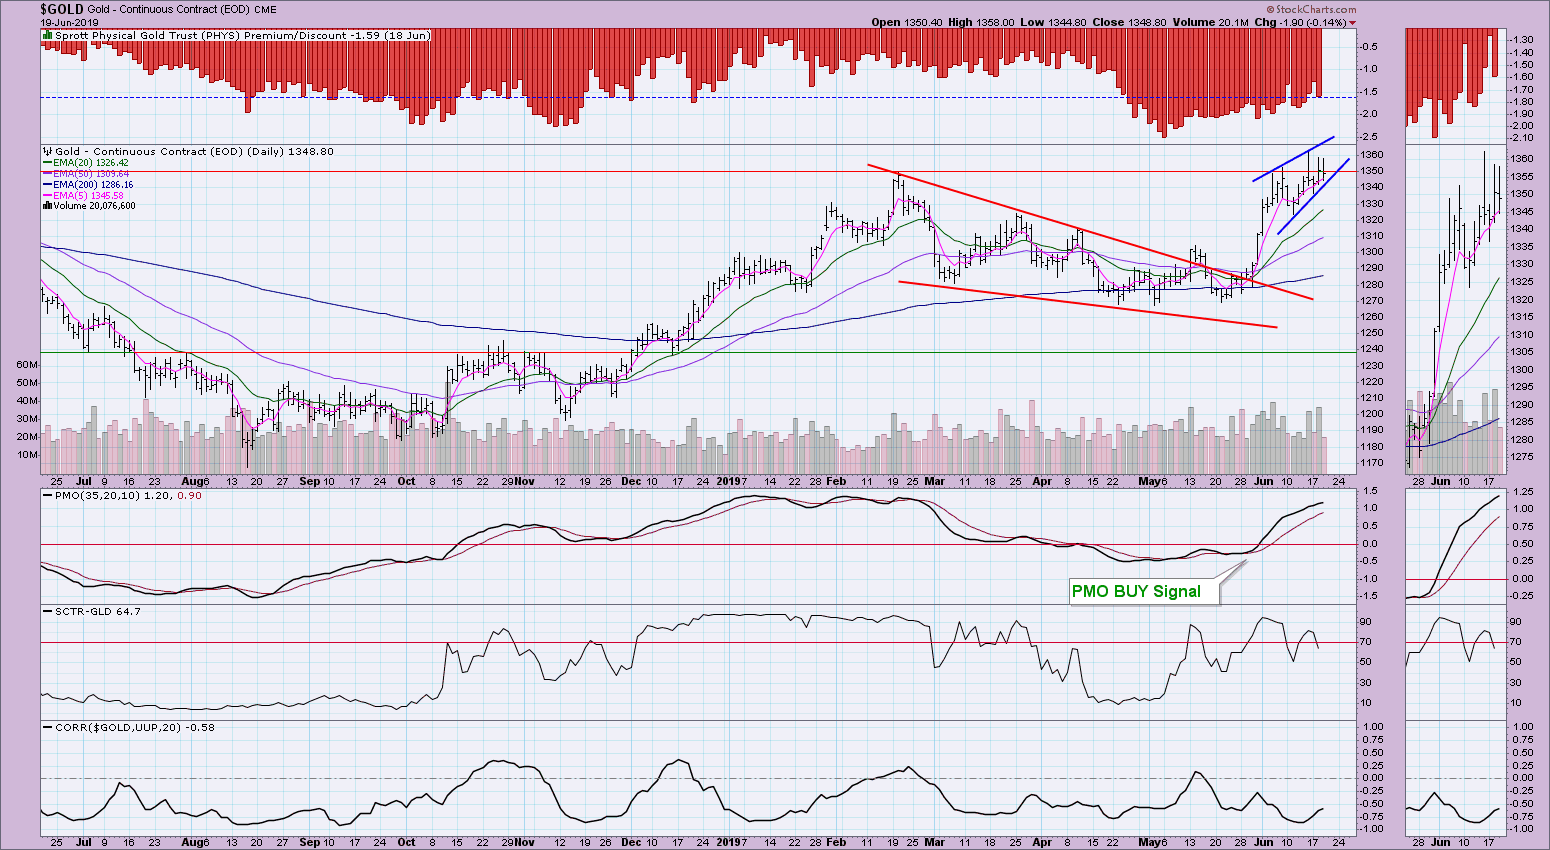
GOLD
IT Trend Model: BUY as of 6/3/2019
LT Trend Model: BUY as of 1/8/2019
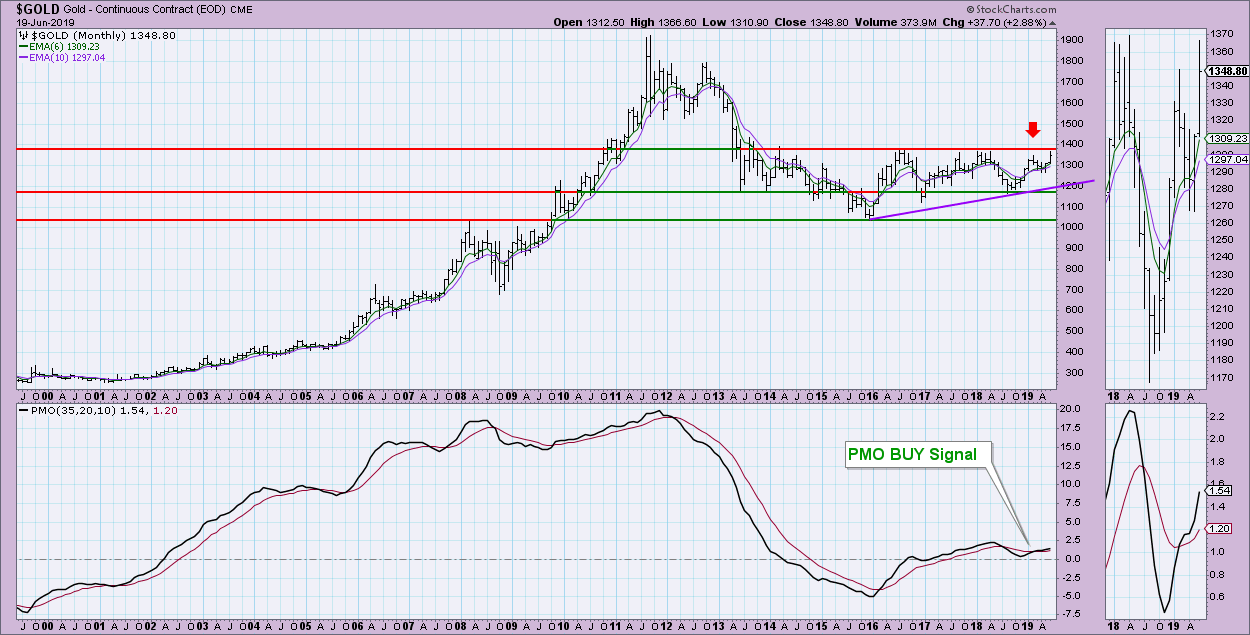
GOLD Daily Chart: The weakness I see in the Dollar should boost Gold further. My only concern right now would be the newly formed bearish rising wedge, which is appearing right at strong overhead resistance (1360).
The strength of that resistance line is very clear on a monthly chart. As with many of my peers, I agree that everything is set for a multi-year breakout.
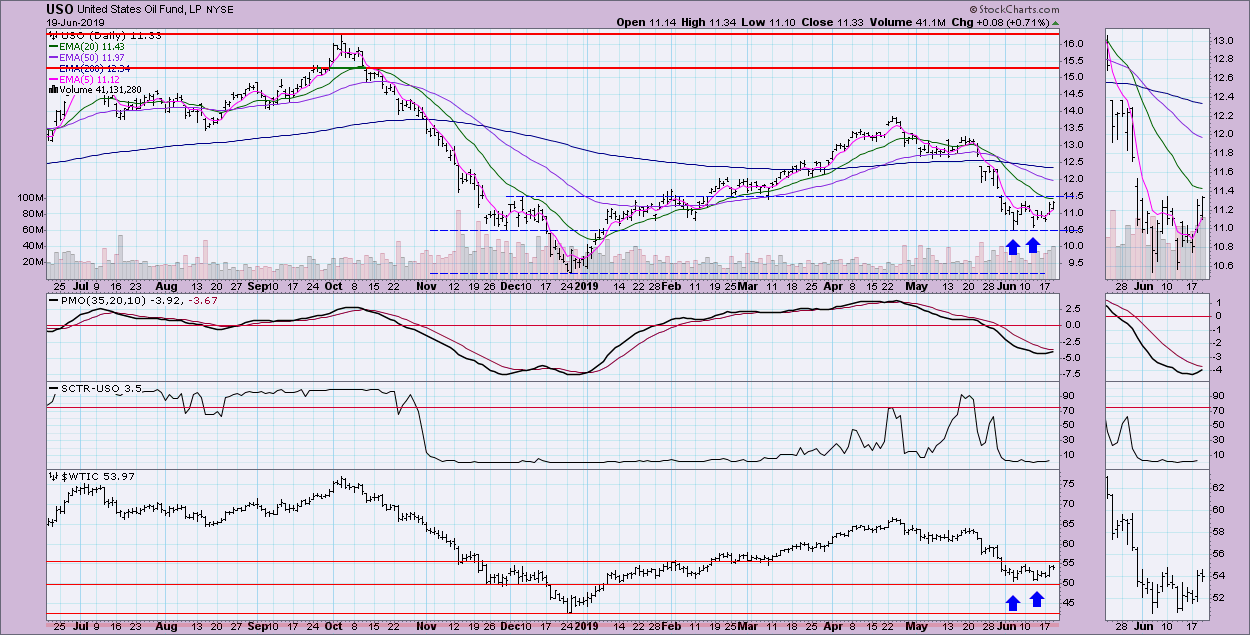
CRUDE OIL (USO)
IT Trend Model: Neutral as of 5/30/2019
LT Trend Model: SELL as of 6/4/2019
USO Daily Chart: Although oil recently began a small rally, it is already butting up against short-term resistance. I'm seeing short-term bullish double-bottom patterns on both $WTIC and USO. Resistance is the confirmation line around $11.35. If the pattern executes as the rising PMO suggests, the minimum upside target would be around $12.15.
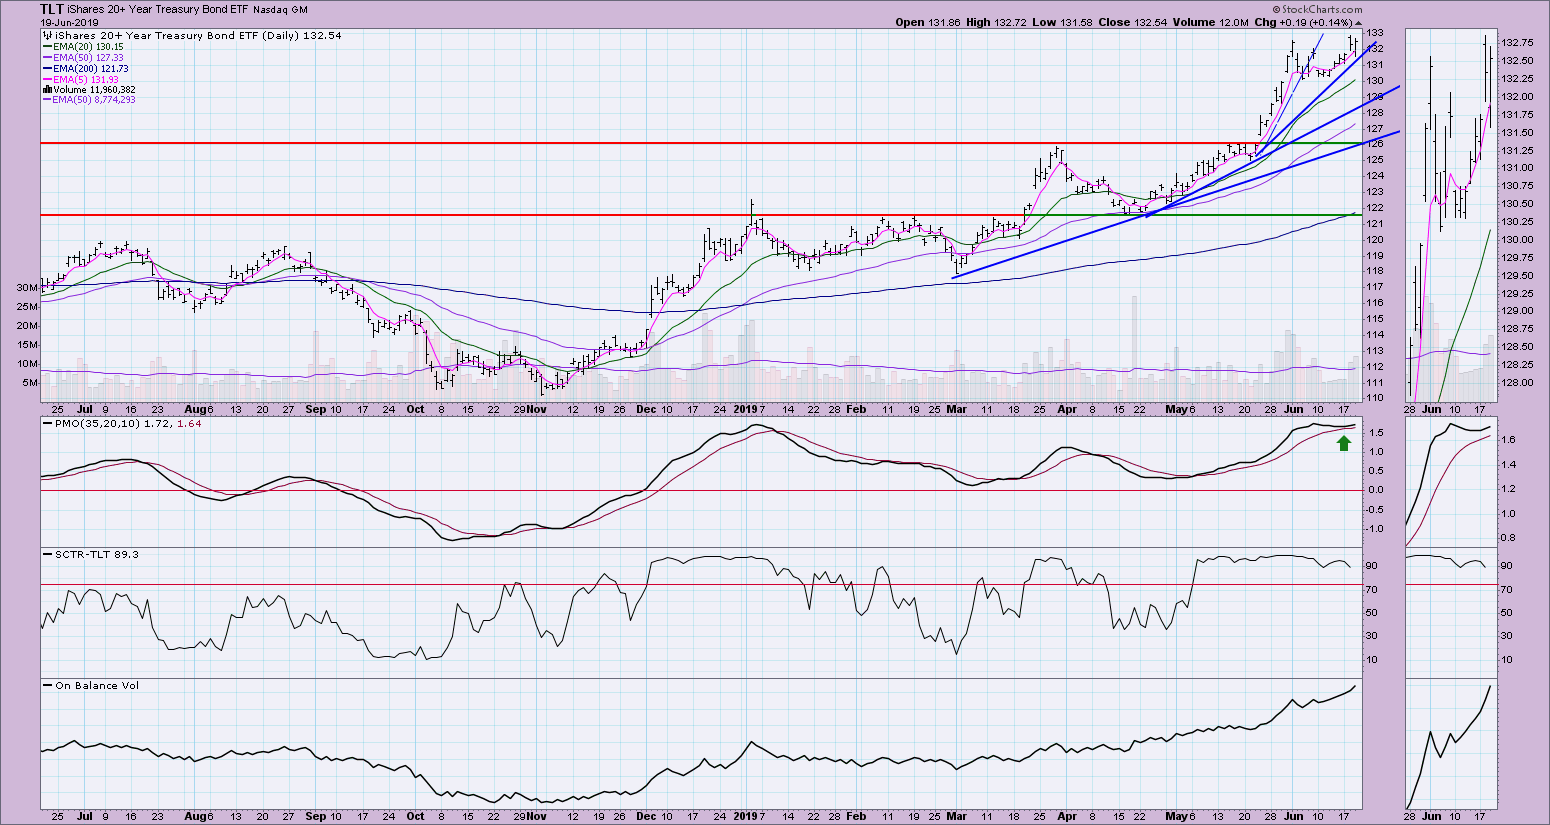
BONDS (TLT)
IT Trend Model: BUY as of 12/6/2018
LT Trend Model: BUY as of 1/2/2019
TLT Daily Chart: There was a franticness to the rally into June as rising trend lines moved steeper and steeper in a parabolic fashion. Price paused, but didn't really break down. The rising trend has flattened slightly, which could help it move higher. The PMO is very overbought, but it did turn up above the signal line.
Technical Analysis is a windsock, not a crystal ball.
Happy Charting!
- Erin
Email: erinh@stockcharts.com
**Don't miss any of the DecisionPoint commentaries! Go to the "Notify Me" box toward the end of this blog page to be notified as soon as they are published.**
NOTE: The signal status reported herein is based upon mechanical trading model signals, specifically, the DecisionPoint Trend Model. They define the implied bias of the price index based upon moving average relationships, but they do not necessarily call for a specific action. They are information flags that should prompt chart review. Further, they do not call for continuous buying or selling during the life of the signal. For example, a BUY signal will probably (but not necessarily) return the best results if action is taken soon after the signal is generated. Additional opportunities for buying may be found as price zigzags higher, but the trader must look for optimum entry points. Conversely, exit points to preserve gains (or minimize losses) may be evident before the model mechanically closes the signal.
Helpful DecisionPoint Links:
DecisionPoint Shared ChartList and DecisionPoint Chart Gallery
Price Momentum Oscillator (PMO)
Swenlin Trading Oscillators (STO-B and STO-V)
