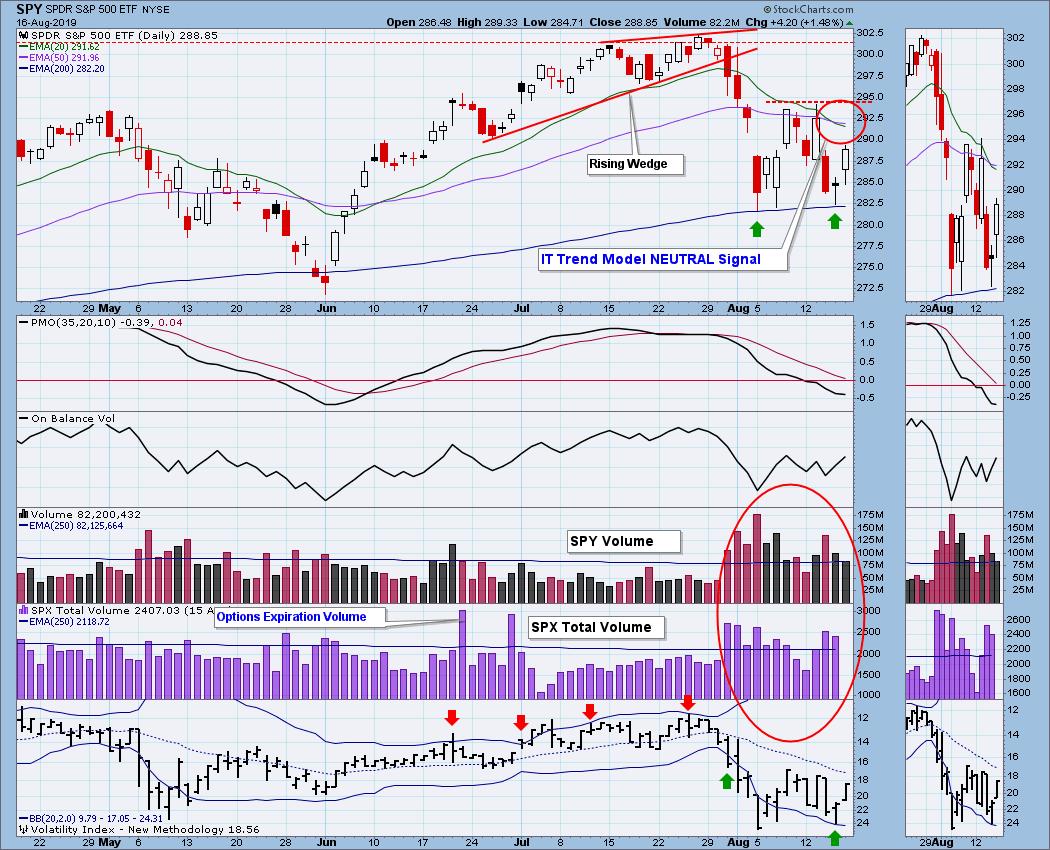
On the last trading day of July the market (SPY) resolved a rising wedge pattern with the expected breakdown, and that began what has turned out to be a very turbulent August. (Note how the volume for almost every day has exceeded the one-year average.) After an initial decline of almost -7%, the market has been chopping around in a four percent range, with this week giving us a +2% up day followed immediately by a -3% down day. For all that volatility, the market lost a mere -0.95% this week. Currently, we can see a short-term double bottom, which, if price can exceed this week's high, would imply a minimum rally to just above the July all-time high. But we're not there just yet.
The DecisionPoint Weekly Wrap presents an end-of-week assessment of the trend and condition of the stock market (S&P 500), the U.S. Dollar, Gold, Crude Oil, and Bonds.
Watch the latest episode of DecisionPoint on StockCharts TV's YouTube channel here!
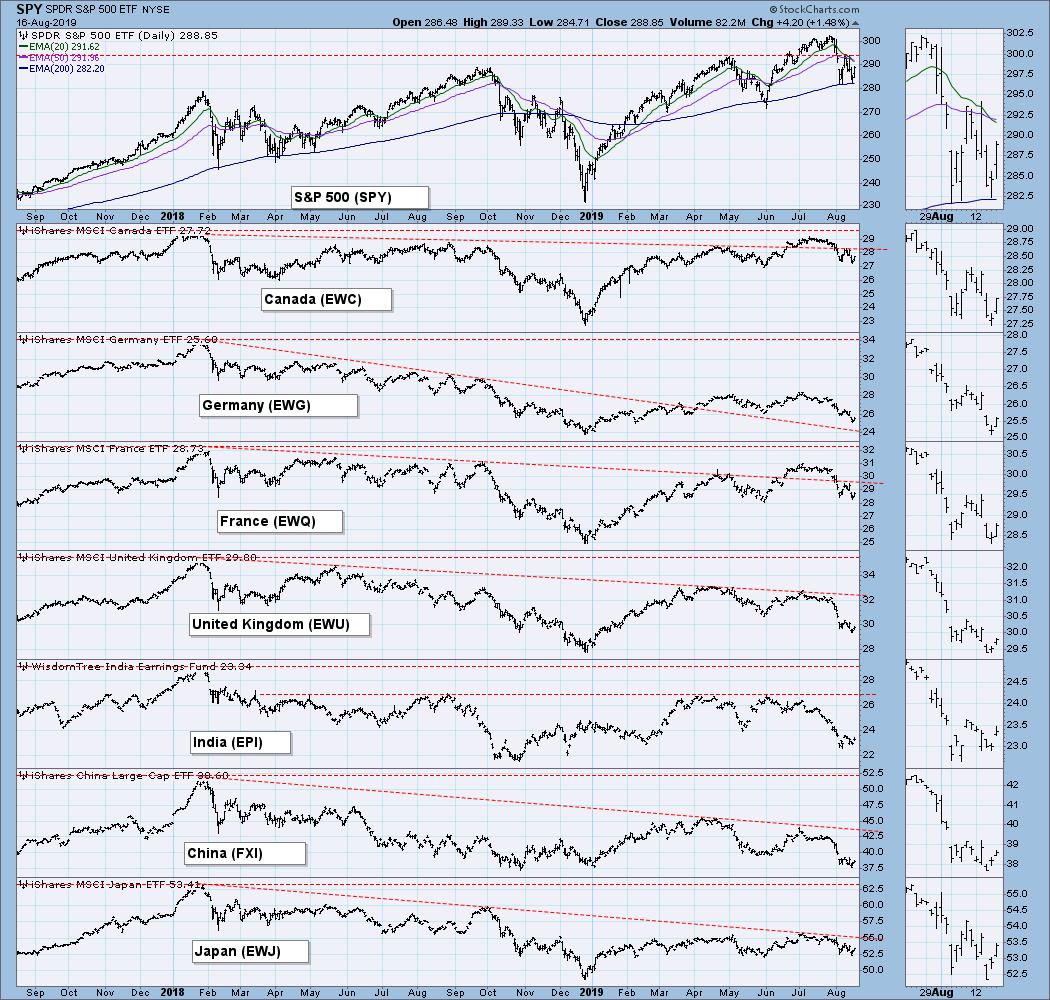
GLOBAL MARKETS
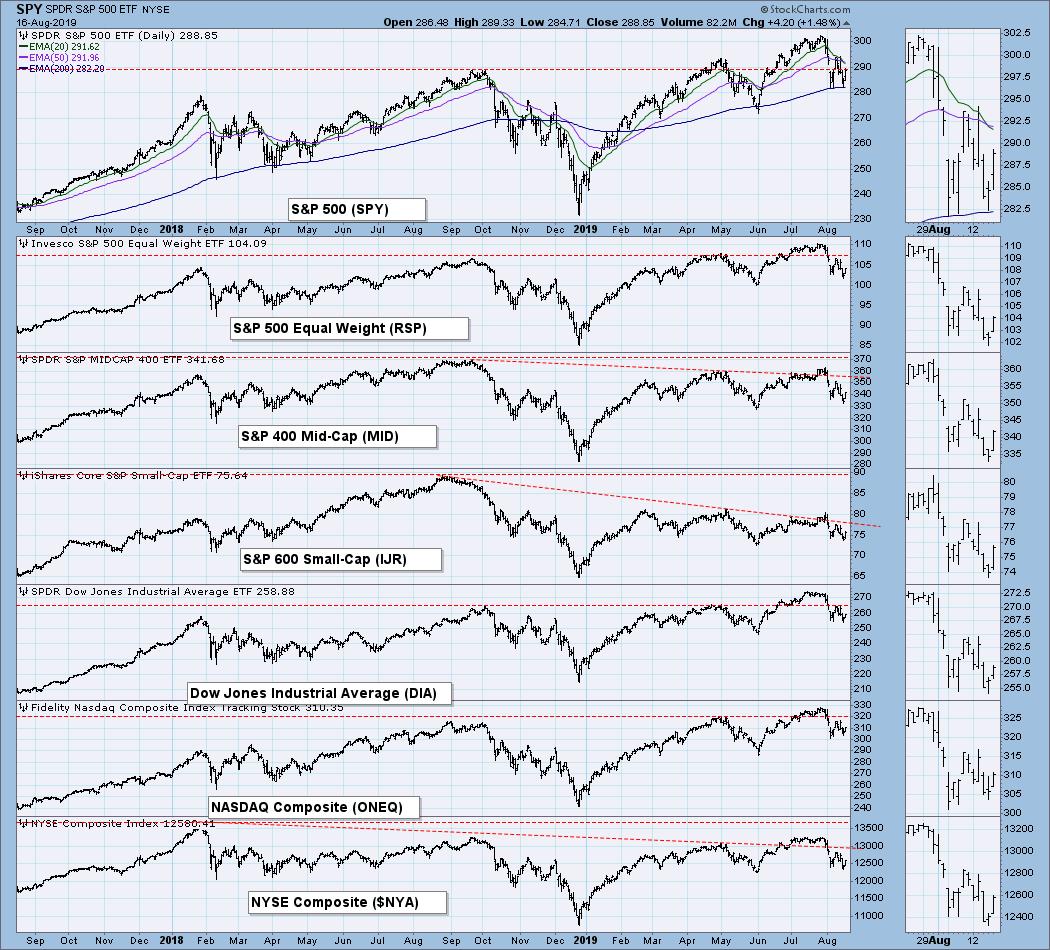
BROAD MARKET INDEXES
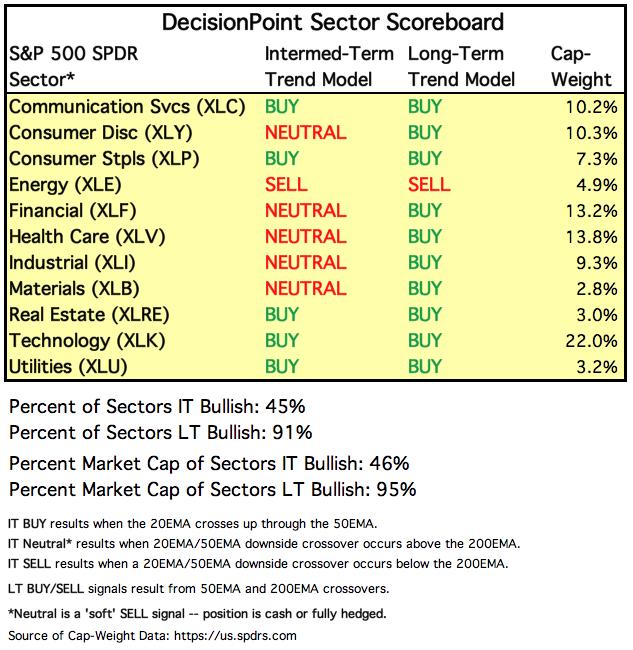
SECTORS
Each S&P 500 Index component stock is assigned to one, and only one, of 11 major sectors. This is a snapshot of the Intermediate-Term and Long-Term Trend Model signal status for those sectors.
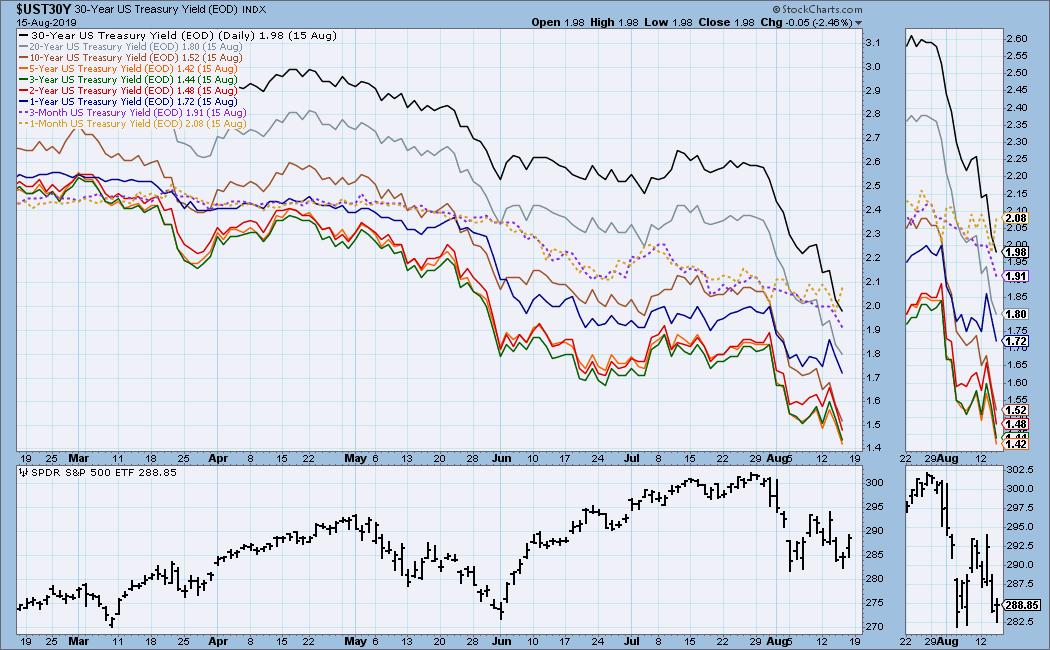
INTEREST RATES
There are some inversions. The 1-Month T-Bill yield is higher than everything, including the 30-Year Bond.
STOCKS
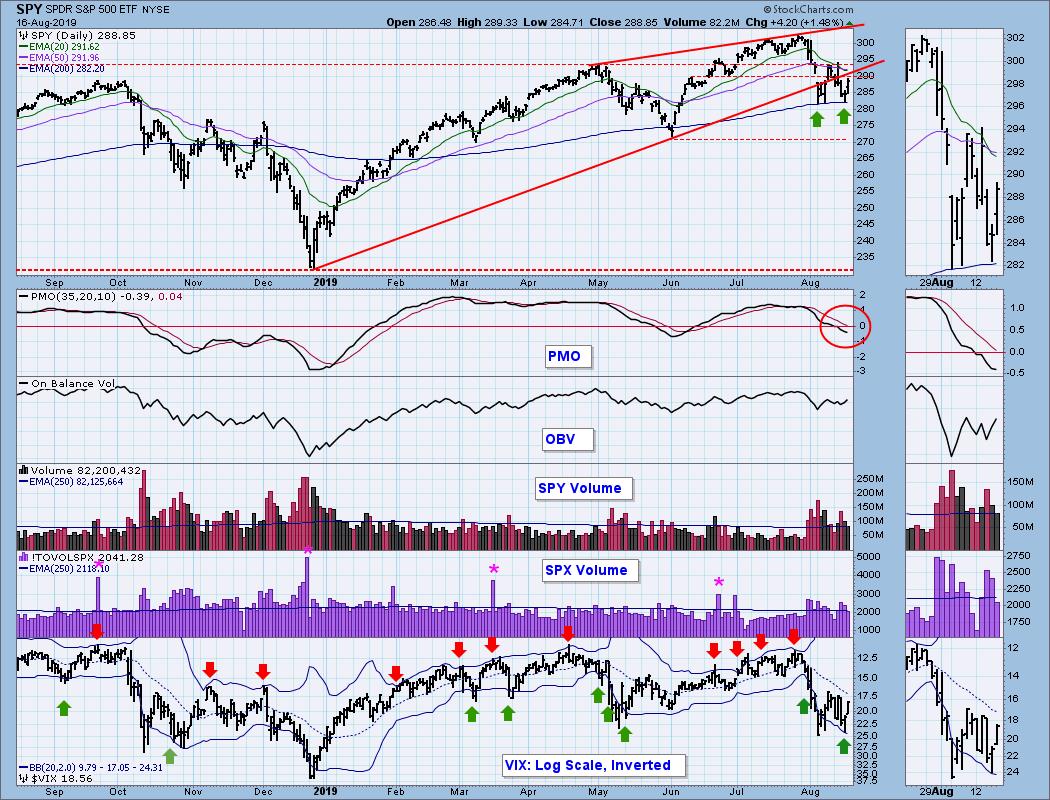
IT Trend Model: NEUTRAL as of 8/15/2019
LT Trend Model: BUY as of 2/26/2019
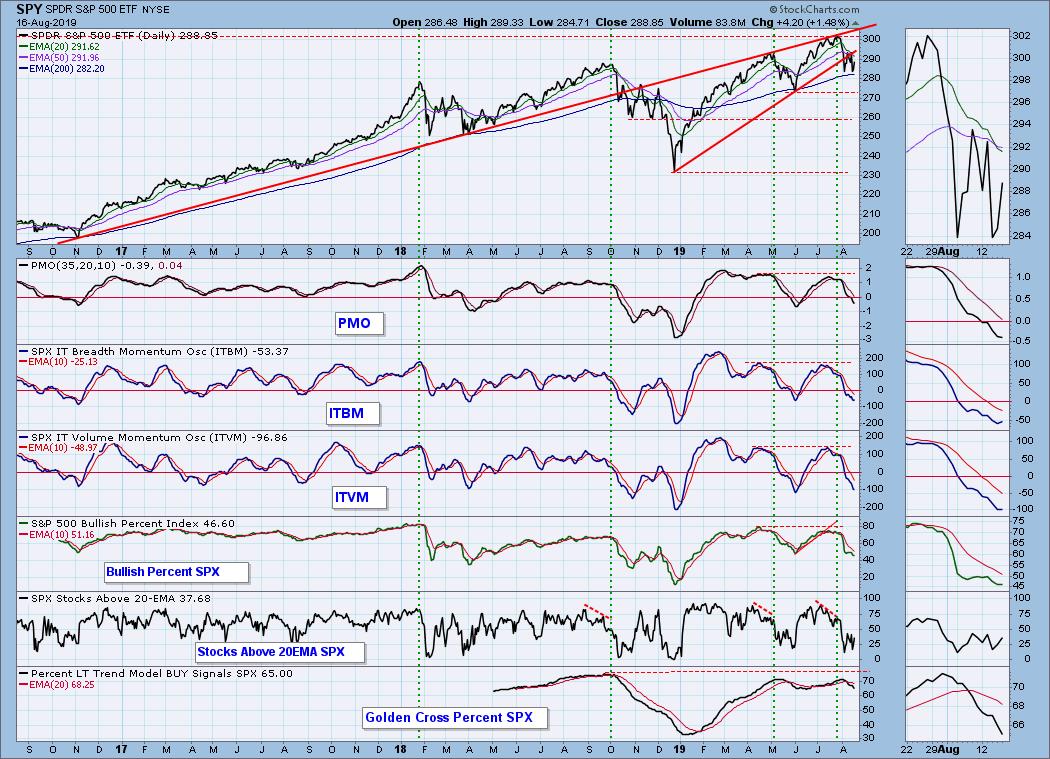
SPY Daily Chart: On Thursday the SPY 20EMA crossed down through the 50EMA, resulting in the IT Trend Model changing from BUY to NEUTRAL. With price largely moving sideways, it could be that we are in for another whipsaw like we saw in June. The rising wedge has resolved downward for the second time, and the double bottom may mean that the market is done with the decline.
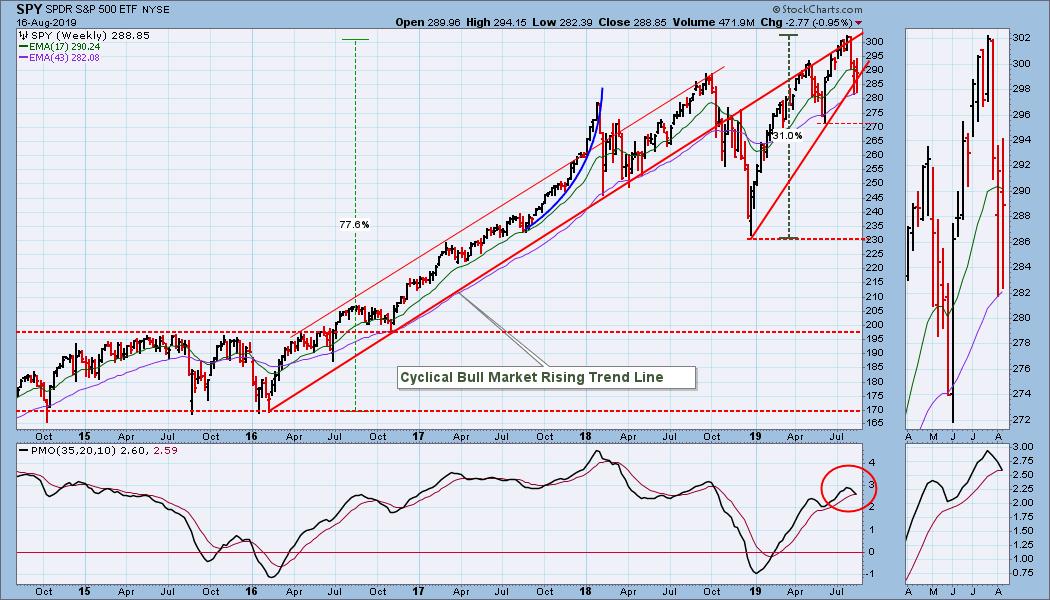
SPY Weekly Chart: The weekly PMO has crossed down through the signal line, which is bearish.
Climactic Market Indicators: In the last two weeks we have nine climax days in mixed directions. Unfortunately, that is too many climaxes in too short a time to make sense of. Friday was a climax day, based upon net advances-declines, and net A-D volume. (Total SPX volume is thinner than it should be for an options expiration day. It will be calculated a second time tonight, so that divergence could be erased.) Since the climax occurred off a double bottom of price, I'm calling it an initiation climax, which should be worth at least a couple days of upside next week.
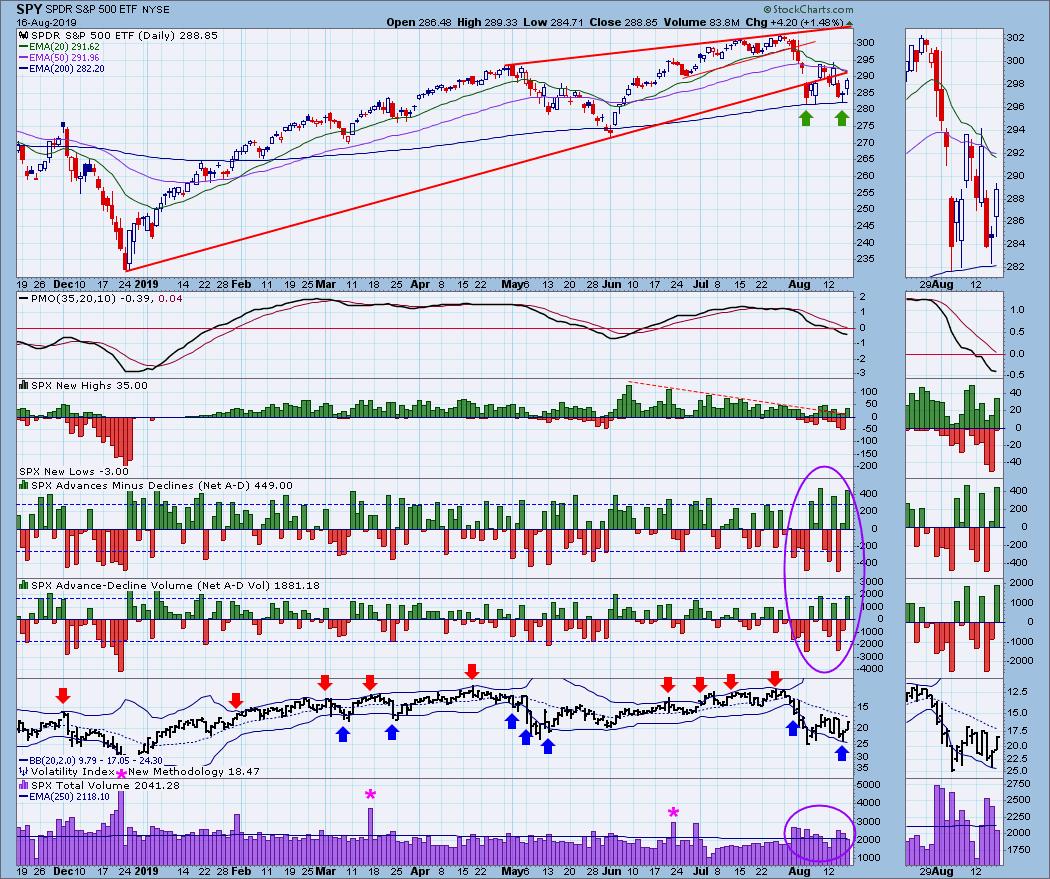
Short-Term Market Indicators: I have been looking for the STO-B and STO-V to double bottom in a manner similar to the double bottoms in May. I'll be keeping that thought for a few more days, but it's looking like we may have gotten the second bottom on Friday.
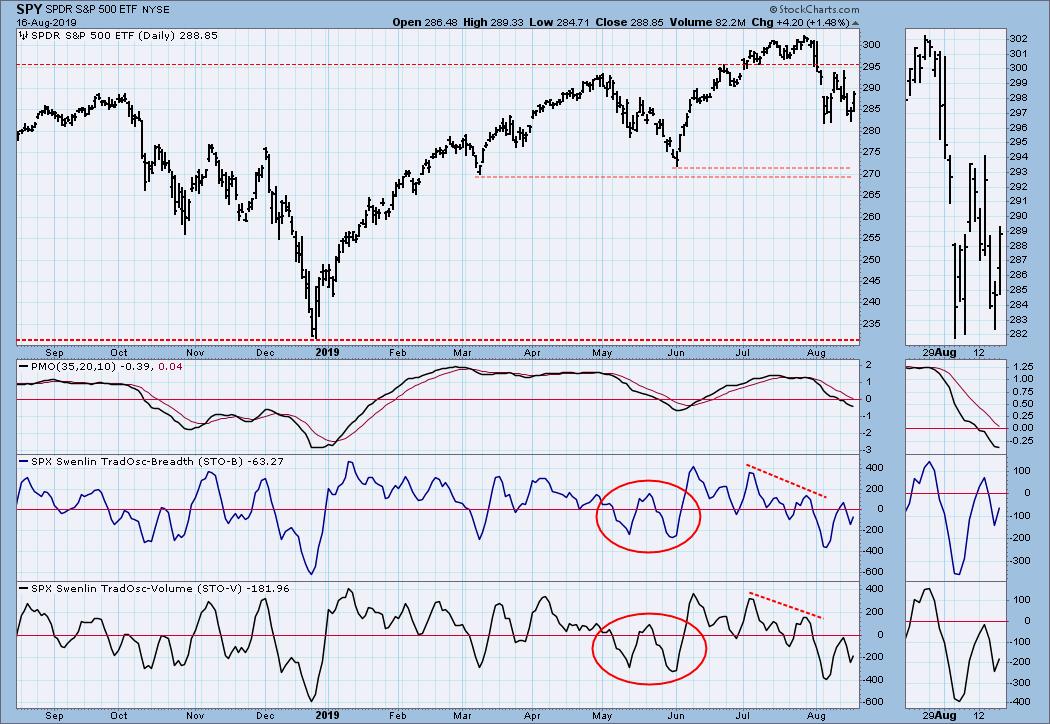
Intermediate-Term Market Indicators: These indicators are oversold if we're still in a bull market, and I have no concrete evidence that says we're not in a bull market.
CONCLUSION: Oversold intermediate-term indicators, combined with what looks like a pretty solid short-term double bottom in price, make me think there is a good case for believing that the decline is over. Nevertheless, we should be alert for a continuation of the rapid direction changes we have experienced this month. If that panicky indecision is still present next week, I wouldn't be buying anything.
There was much ado about the inverted yield curve this week, but this is only relevant as an indicator of the fundamental condition of the economy. It is not a timing tool. Still, it is not a happy condition.
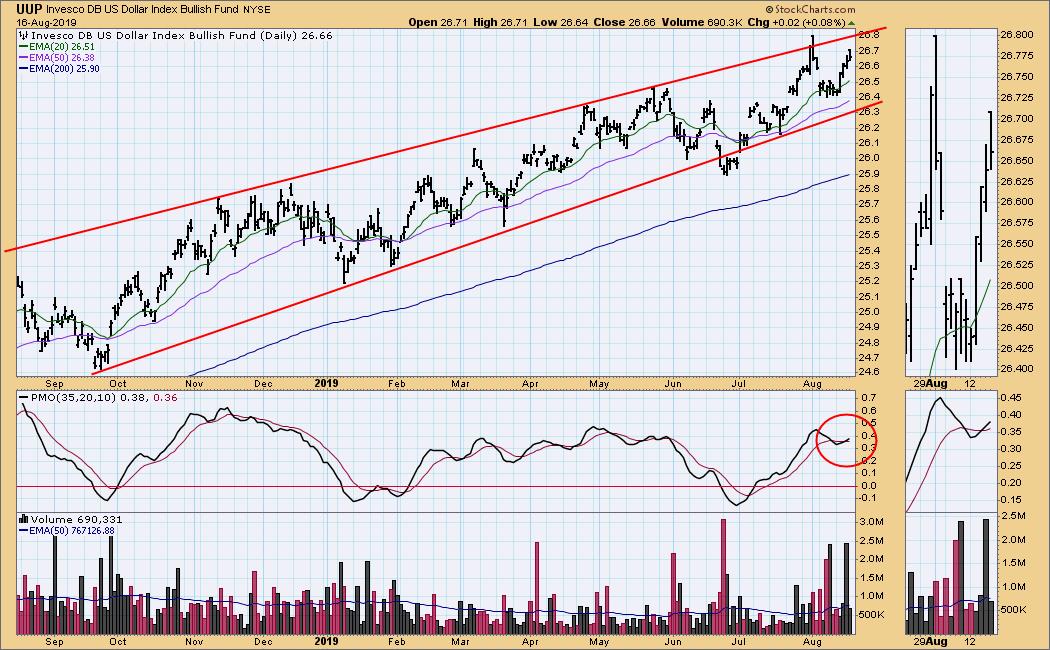
DOLLAR (UUP)
IT Trend Model: BUY as of 7/5/2019
LT Trend Model: BUY as of 5/25/2018
UUP Daily Chart: A rising wedge dominates the daily chart. It is not very tight, but we do expect it to resolve downward.
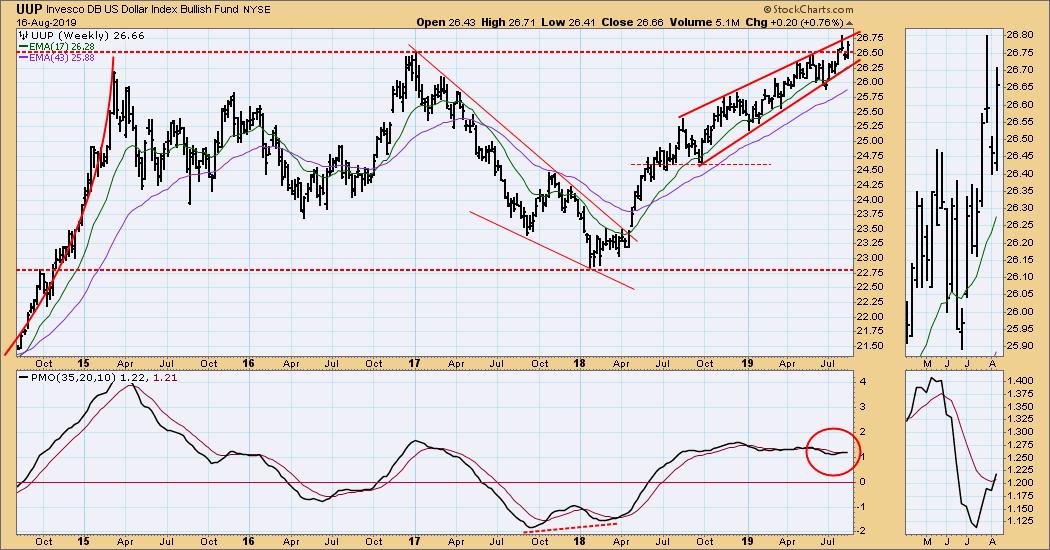
UUP Weekly Chart: UUP is still struggling with long-term resistance that goes back the 2008. That resistance could eventually cause the breakdown of the rising wedge.
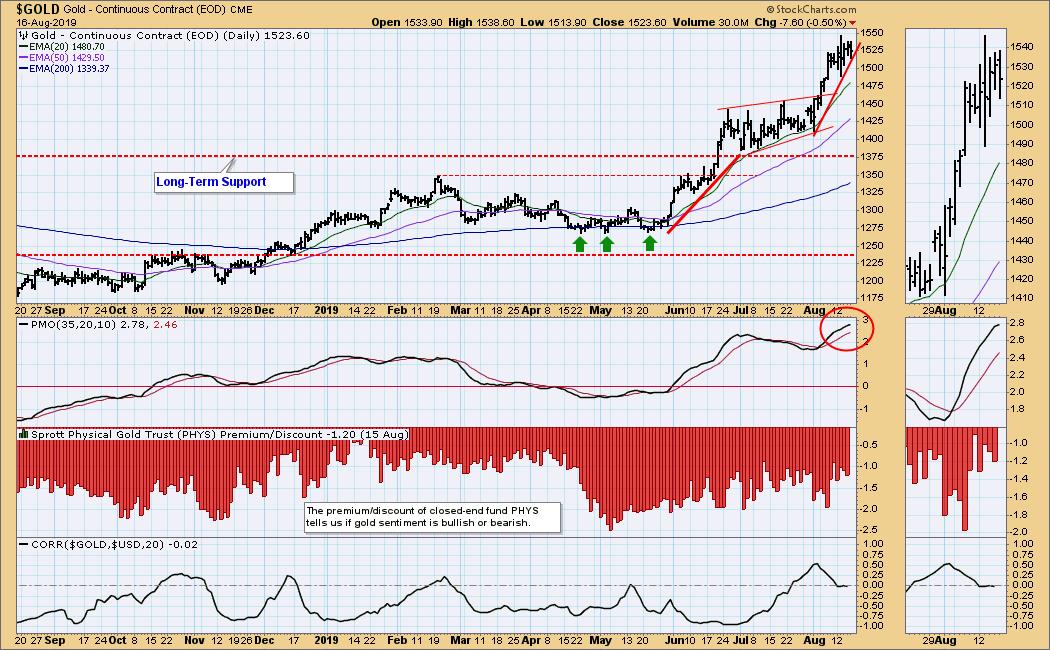
GOLD
IT Trend Model: BUY as of 6/3/2019
LT Trend Model: BUY as of 1/8/2019
GOLD Daily Chart: Gold has rallied about +20% since May, but amazingly, sentiment remains negative.
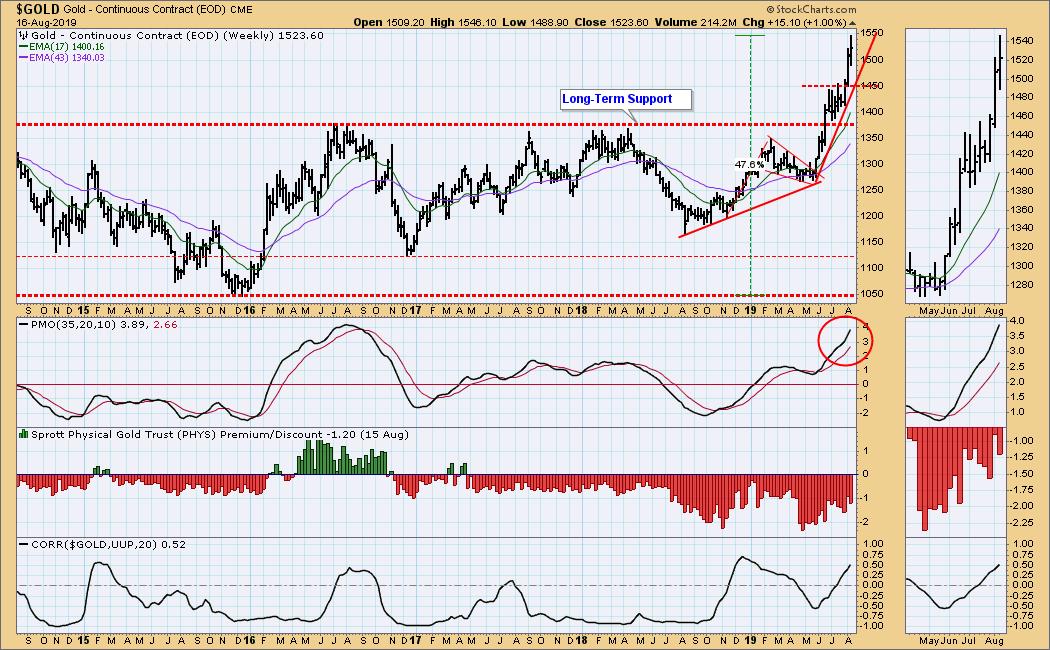
GOLD Weekly Chart: Since its bear market low around 1050, gold has advanced almost +50%. The advance from the May lows has been quite steep, so a pullback is likely.
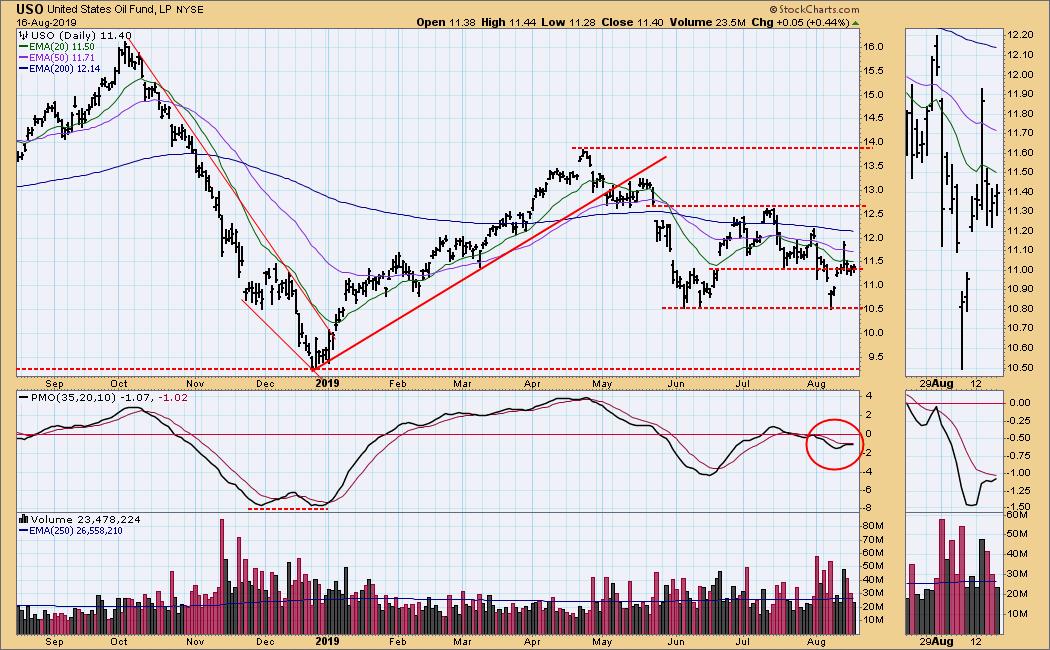
CRUDE OIL (USO)
IT Trend Model: NEUTRAL as of 5/30/2019
LT Trend Model: SELL as of 6/4/2019
USO Daily Chart: A breakout on Tuesday amounted to nothing.
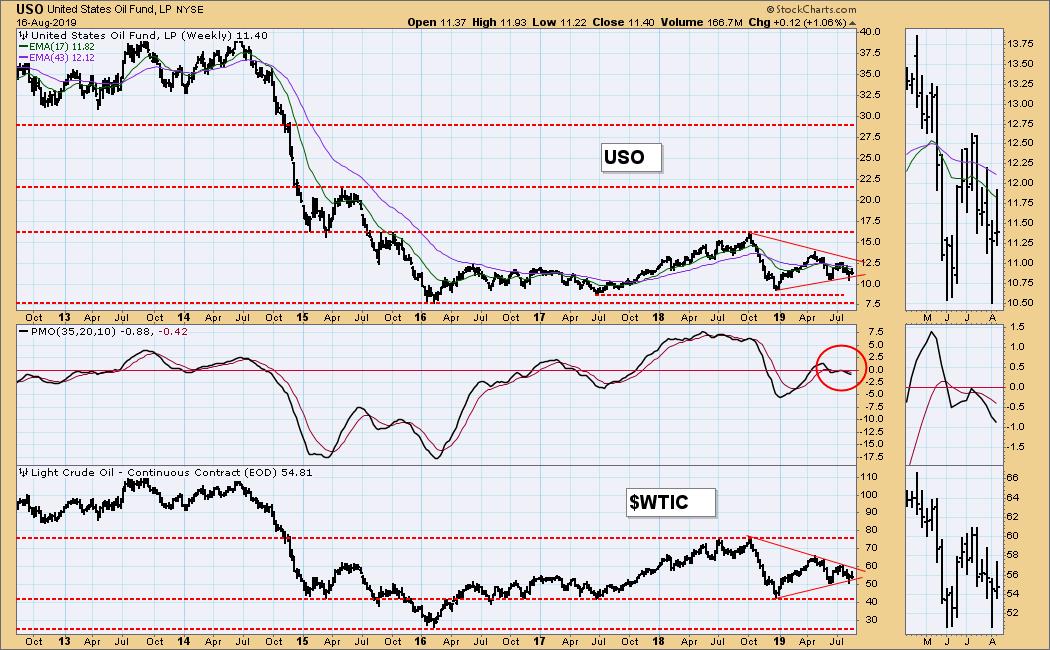
USO Weekly Chart: Price for USO and WTIC are being squeezed into a triangle formation, but I don't think that resolution of those triangles will prove to be important in the context of the horizontal trading range (42 to 76 for WTIC), which I believe will contain price for some time to come. Nevertheless, this is a huge range, which will allow for a lot of volatility.
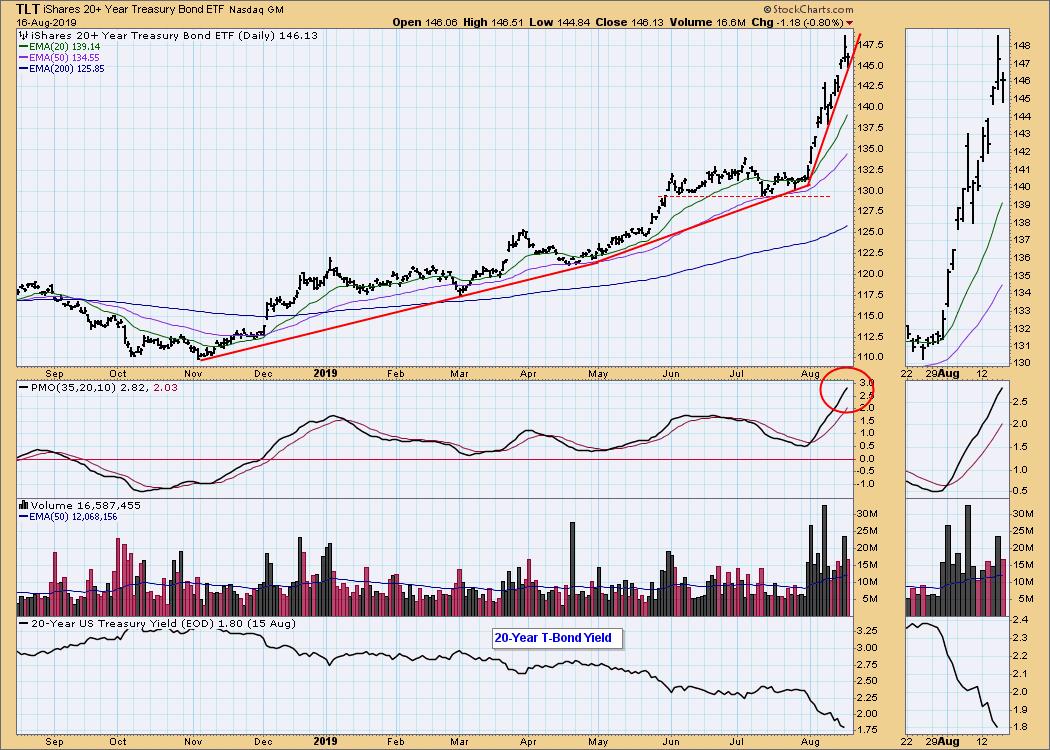
BONDS (TLT)
IT Trend Model: BUY as of 12/6/2018
LT Trend Model: BUY as of 1/2/2019
TLT Daily Chart: I think TLT looks very overbought in this time frame. Watch the steep rising trend line.
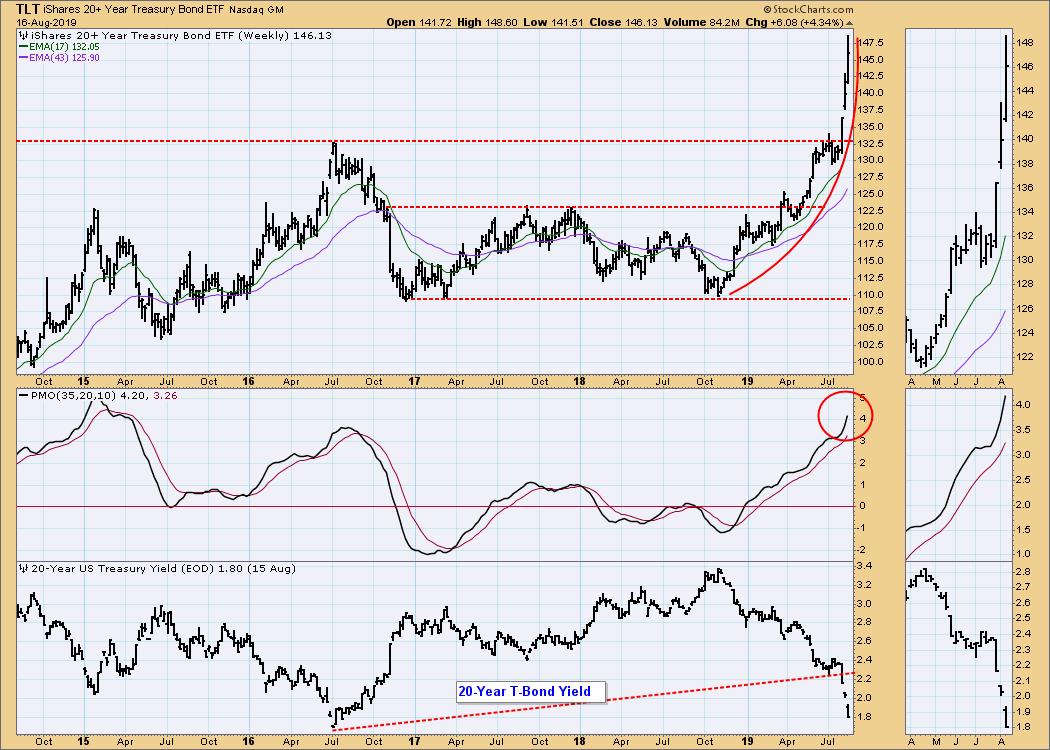
TLT Weekly Chart: Bonds have been rising sharply for three weeks, and the 20-Year Bond yield has been falling. We can see that TLT's advance has become parabolic, and a sharp pullback is most likely in the cards soon.
**Don't miss any of the DecisionPoint commentaries! Go to the "Notify Me" box toward the end of this blog page to be notified as soon as they are published.**
Technical Analysis is a windsock, not a crystal ball.
Happy Charting! - Carl
NOTE: The signal status reported herein is based upon mechanical trading model signals, specifically, the DecisionPoint Trend Model. They define the implied bias of the price index based upon moving average relationships, but they do not necessarily call for a specific action. They are information flags that should prompt chart review. Further, they do not call for continuous buying or selling during the life of the signal. For example, a BUY signal will probably (but not necessarily) return the best results if action is taken soon after the signal is generated. Additional opportunities for buying may be found as price zigzags higher, but the trader must look for optimum entry points. Conversely, exit points to preserve gains (or minimize losses) may be evident before the model mechanically closes the signal.
Helpful DecisionPoint Links:
DecisionPoint Shared ChartList and DecisionPoint Chart Gallery
Price Momentum Oscillator (PMO)
Swenlin Trading Oscillators (STO-B and STO-V)
