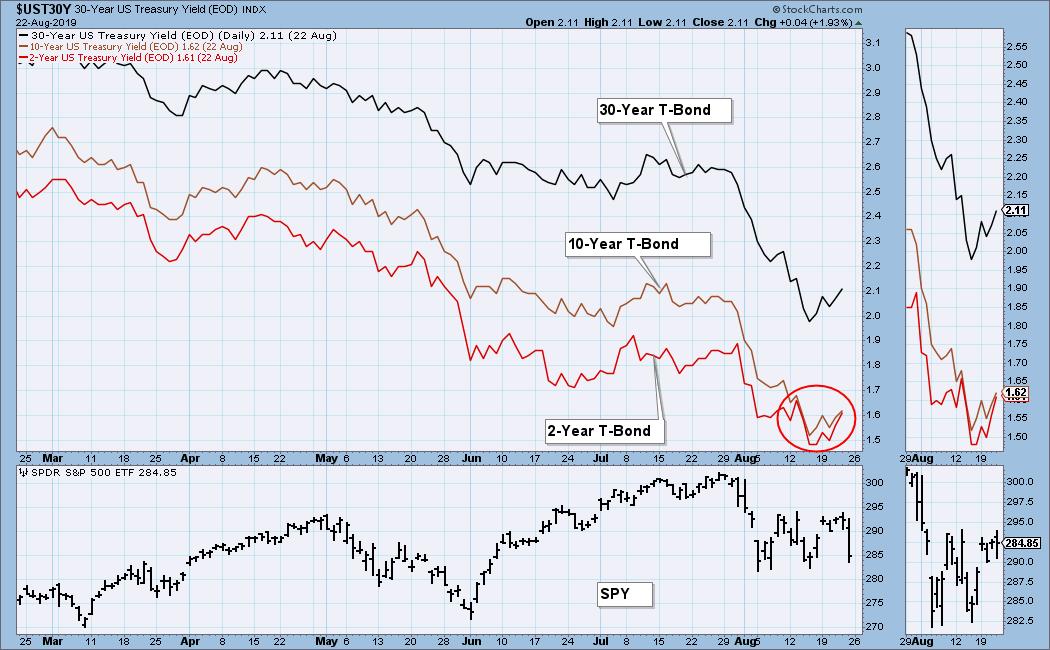
The oft-referenced "yield curve" refers to the relationship between the yield of the 10-Year T-Bond and the 2-Year T-Bond. Logically, the longer-term instrument should have the higher yield, but this week the 2-Year yield popped slightly above the 10-Year yield on a few occasions intraday. As could be expected, media outlets became immediately obsessed with these inversions, and started watching them with the intensity they would give The Kentucky Derby. Puh-lease! The inversion is not like a light switch that will immediately plunge the financial world into total darkness. Rather it is a sign that there is a problem that will work against the welfare of the market in general. The fact that these rates are so close together is as much a concern as an actual inversion.
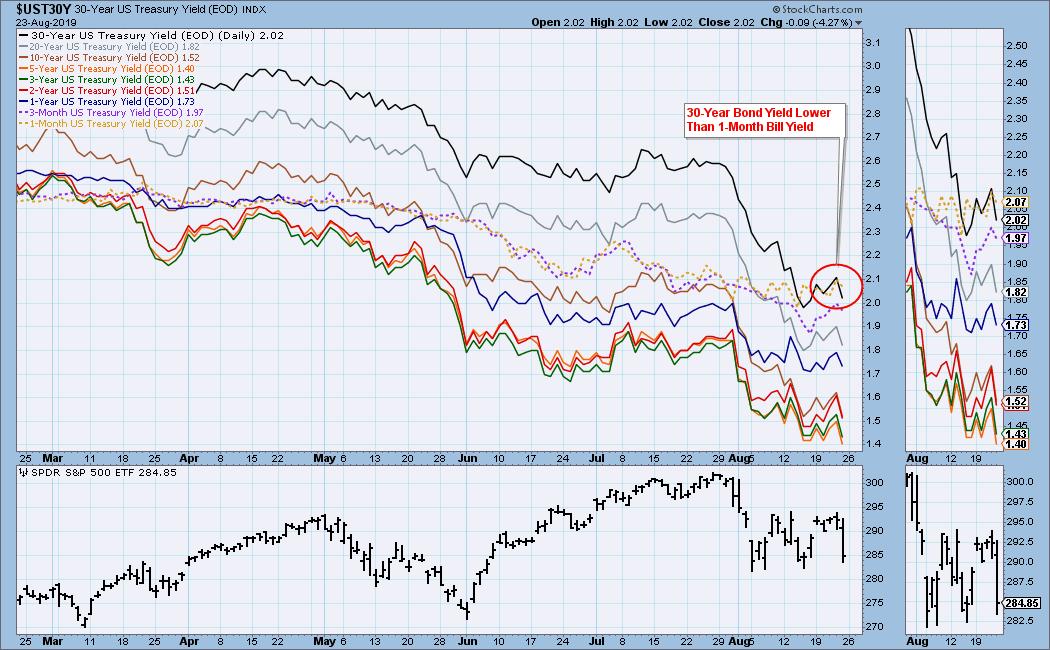
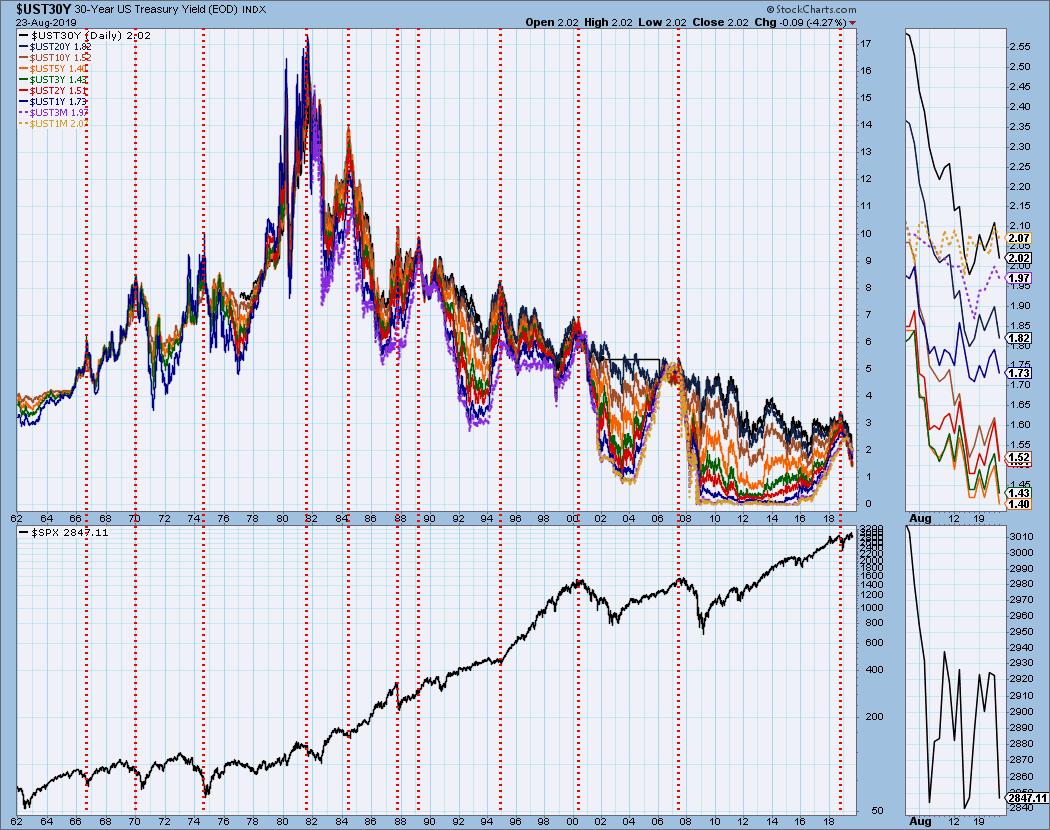
Let's look across the spectrum from the 1-Month T-Bill to the 30-Year T-Bond. It's hard to see, but all instruments shorter that the 5-Year T-Bond have a higher yield. More amazing, the 1-Month Bill has a higher yield that the mighty 30-Year Bond.
The DecisionPoint Weekly Wrap presents an end-of-week assessment of the trend and condition of the stock market (S&P 500), the U.S. Dollar, Gold, Crude Oil, and Bonds.
Watch the latest episode of DecisionPoint on StockCharts TV's YouTube channel here!
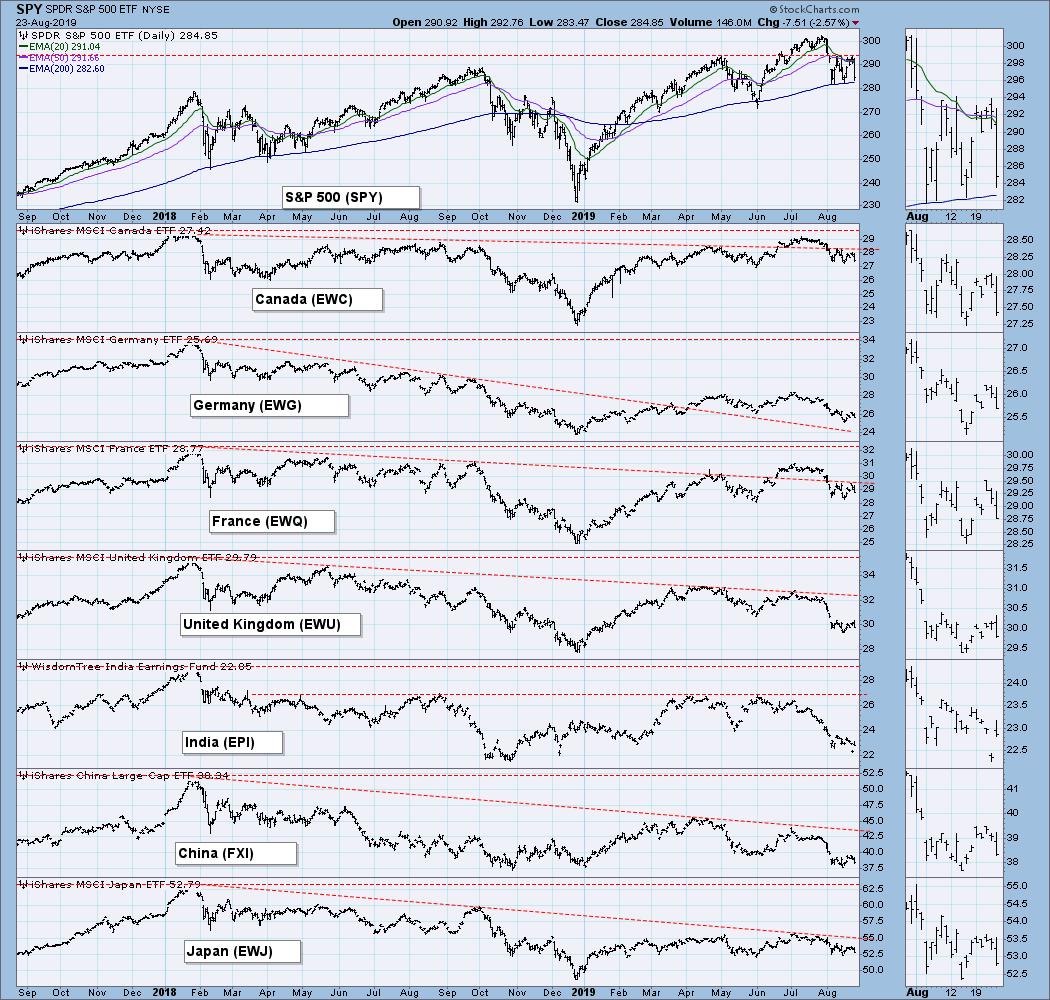
GLOBAL MARKETS
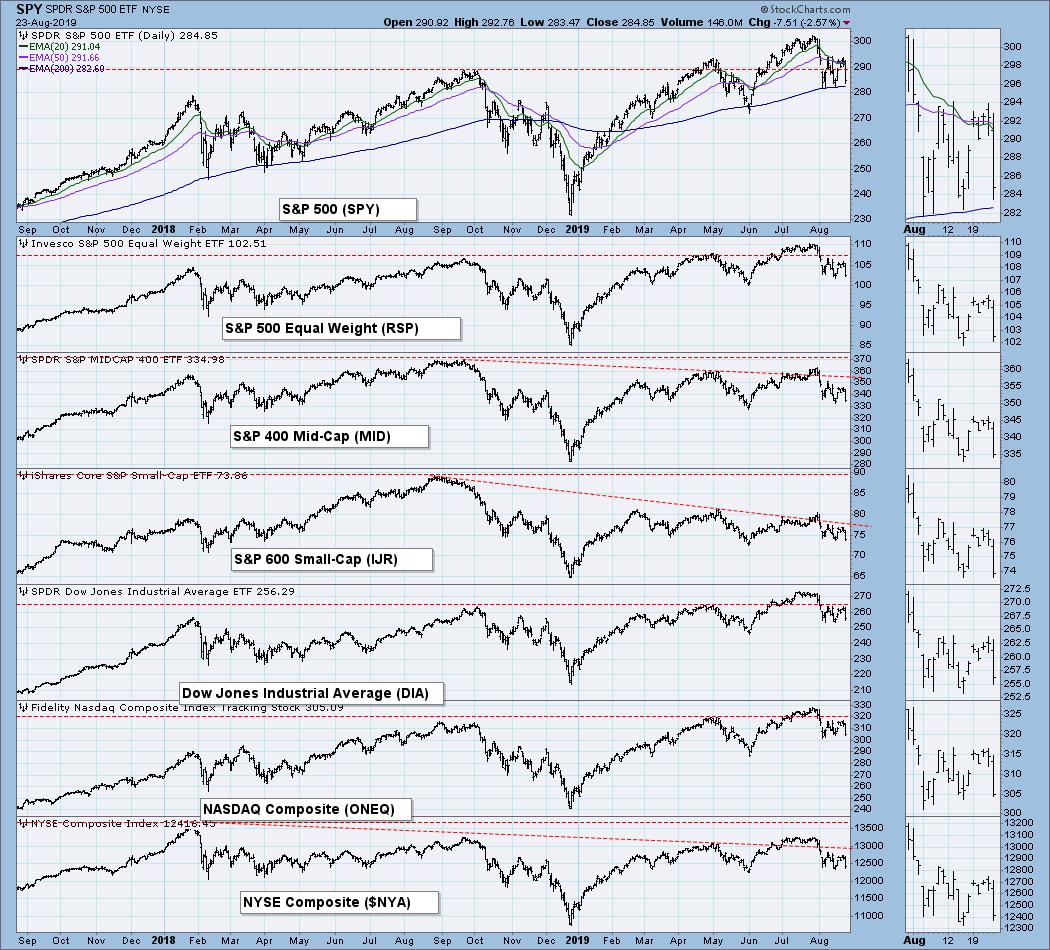
BROAD MARKET INDEXES
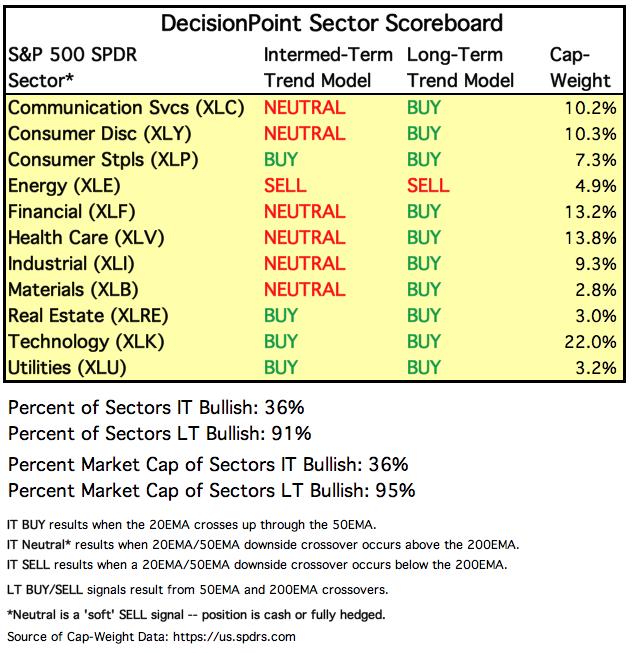
SECTORS
Each S&P 500 Index component stock is assigned to one, and only one, of 11 major sectors. This is a snapshot of the Intermediate-Term and Long-Term Trend Model signal status for those sectors.
INTEREST RATES
Because some interest rates are currently inverted, I will be including a chart so we can monitor the situation. In normal circumstances the longer money is borrowed the higher the interest rate that must be paid. When rates are inverted, the reverse is true. It is generally believed that rate inversions result from "a flight to safety." On the chart below, the one-month and three month T-Bills (dotted lines) pay a higher interest rate than the one year through the 20-year T-Bonds. This is a serious problem for the stock market.
STOCKS
IT Trend Model: NEUTRAL as of 8/15/2019
LT Trend Model: BUY as of 2/26/2019
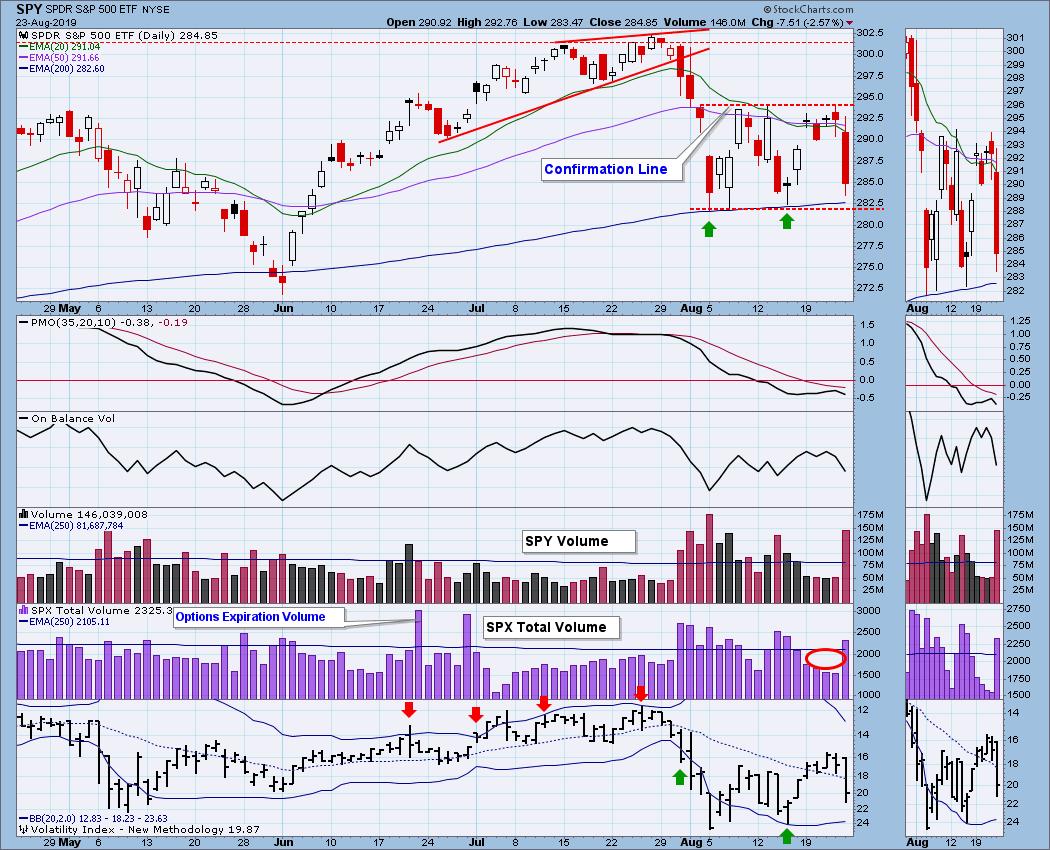
SPY Daily Chart: Last Friday the market (SPY) was strongly coming off a double bottom. On Monday price gapped up, continuing the advance, but that ended it. SPY spent the rest of the week stalled below the confirmation line on low volume, and on Friday, thanks to Fed and trade news, it headed sharply back toward the bottom of the trading range on high volume. The daily PMO turned down below the signal line, a very negative configuration.
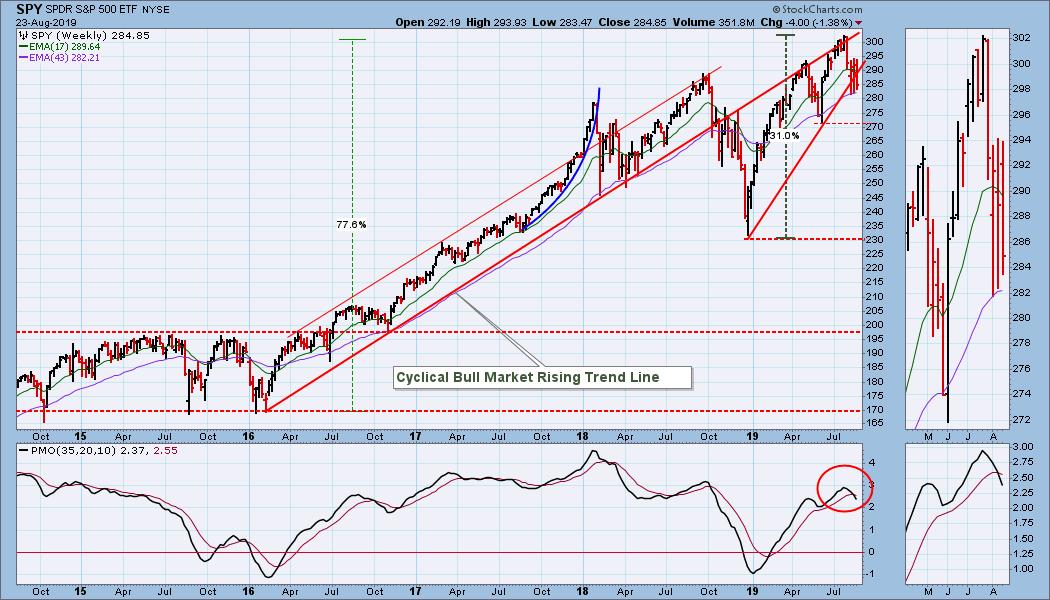
SPY Weekly Chart: It was quiet in the middle of the week but dramatic on the first and last day. Still, the net change was about -1.4%. The weekly PMO has dropped well below the signal line, giving a very negative long-term sign.
Climactic Market Indicators: Climactic activity has abounded for nearly three weeks, but the readings were reversing almost daily, and it was hard to get a fix on what the readings meant. Friday was a climax day, and at this point I am calling it an initiation climax, meaning that I think price will go lower.
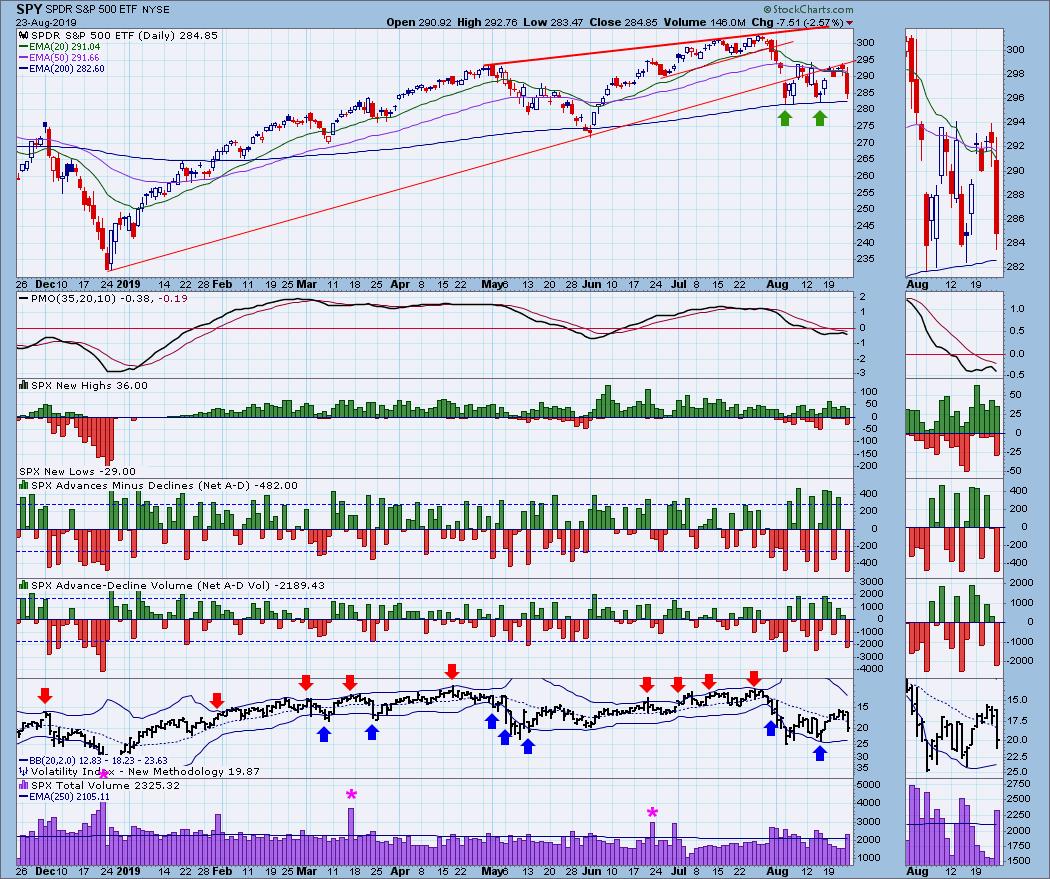
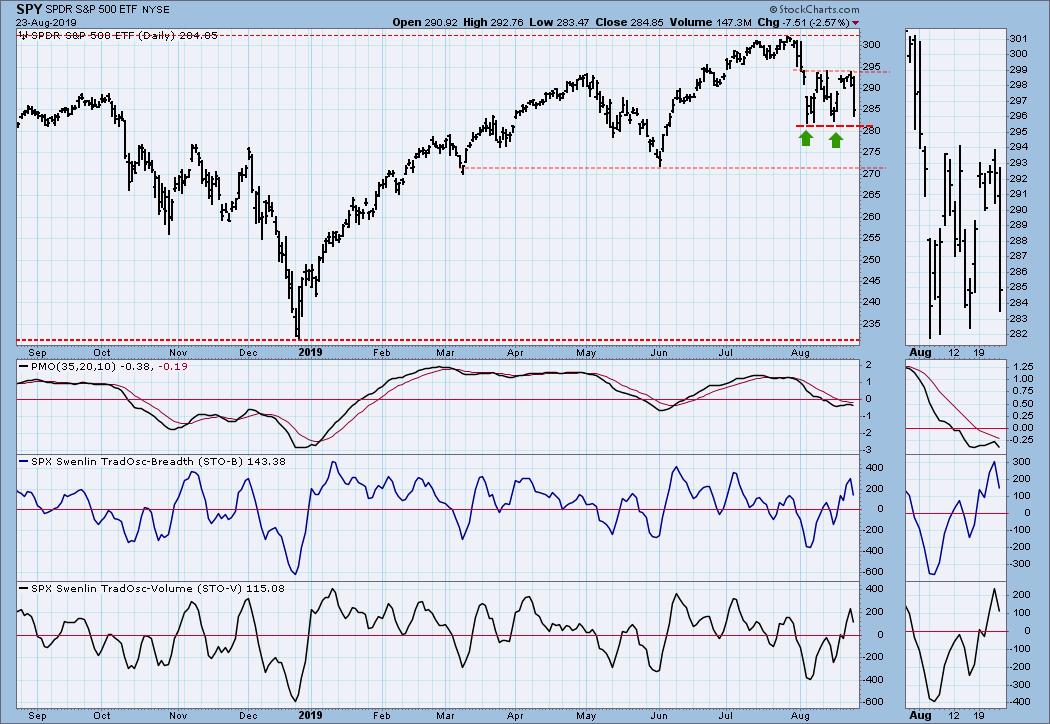
Short-Term Market Indicators: The STO-B and STO-V managed to make it to overbought levels by Thursday, so the Friday price reversal was not a total surprise.
Intermediate-Term Market Indicators: While these indicators appeared to have found a bottom last week, it now seems possible that they will reach more oversold readings before the negativity is exhausted.
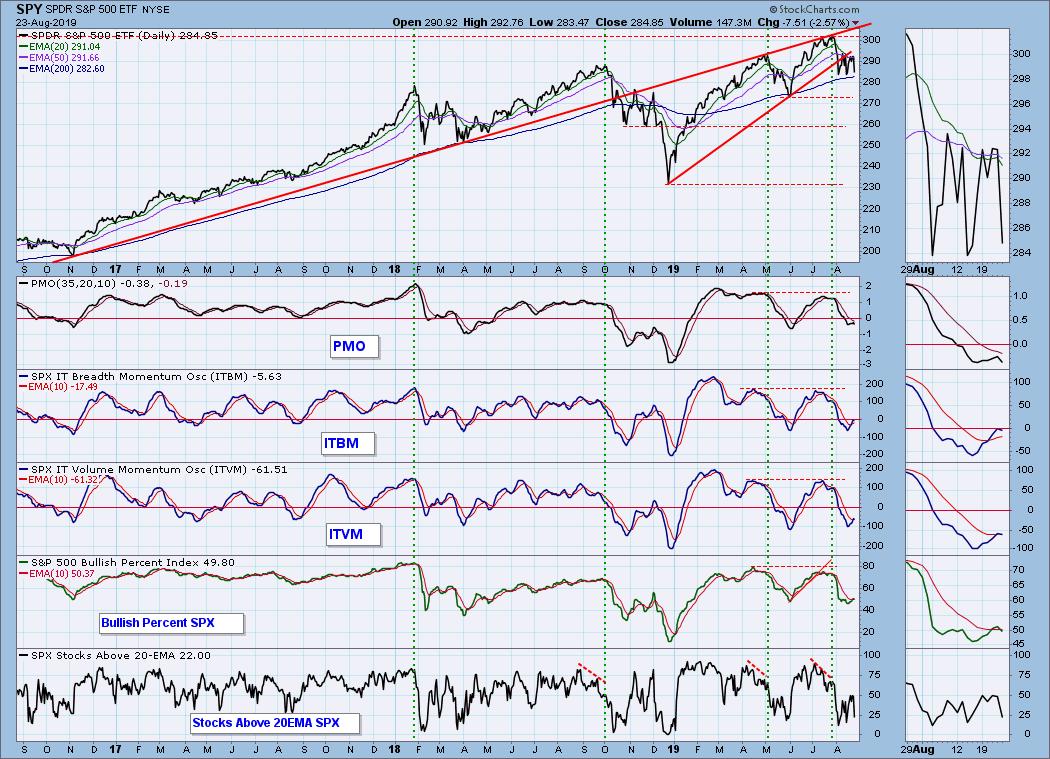
CONCLUSION: The market is coming down off a short-term overbought condition, and it will take several days to swing down to oversold conditions. This could cause price to break below the bottom of the August trading range. Intermediate-term indicators turned down on Friday, but they are bull-market-oversold, and still offer hope that the trading range will hold. I think the tie-breaker for me is the weekly PMO, which is below the signal line and falling. That forecasts lower prices ahead.
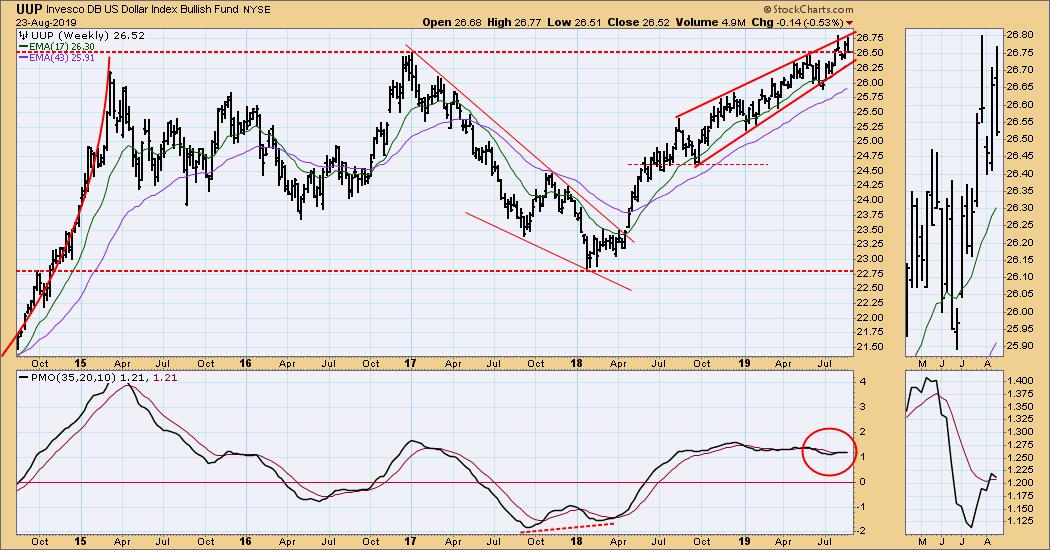
DOLLAR (UUP)
IT Trend Model: BUY as of 7/5/2019
LT Trend Model: BUY as of 5/25/2018
UUP Daily Chart: The dollar had quite a range on Friday, rallying, then crashing on news. The daily PMO has crossed down through the signal line, so we may finally see UUP depart the rising wedge to the downside.
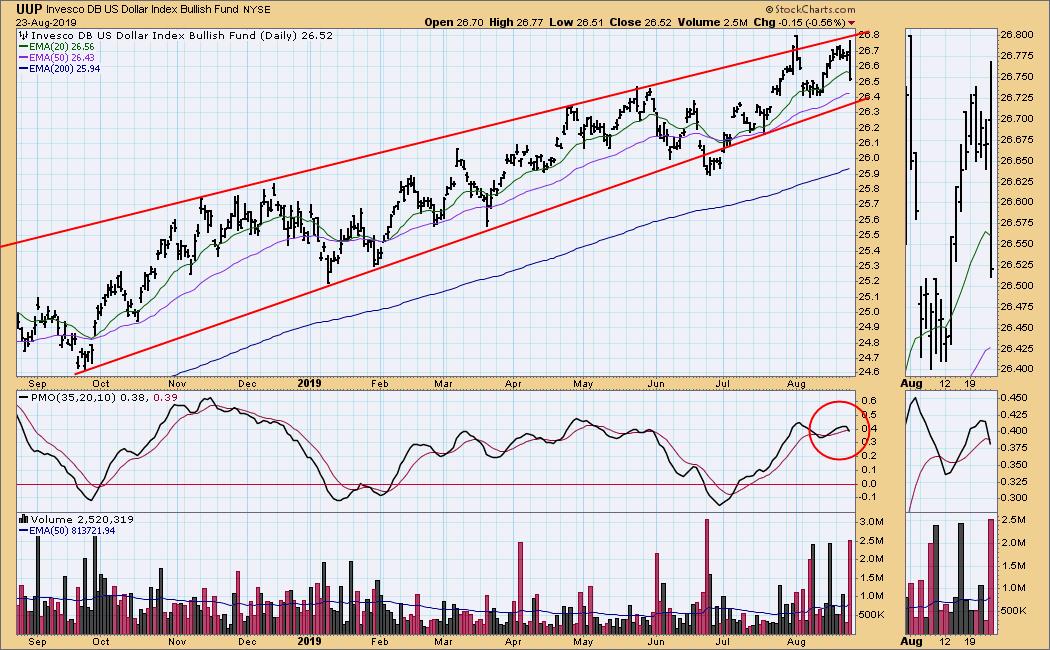
UUP Weekly Chart: Price is struggling with long-term resistance, but I don't see any sign of resolution on this chart so far.
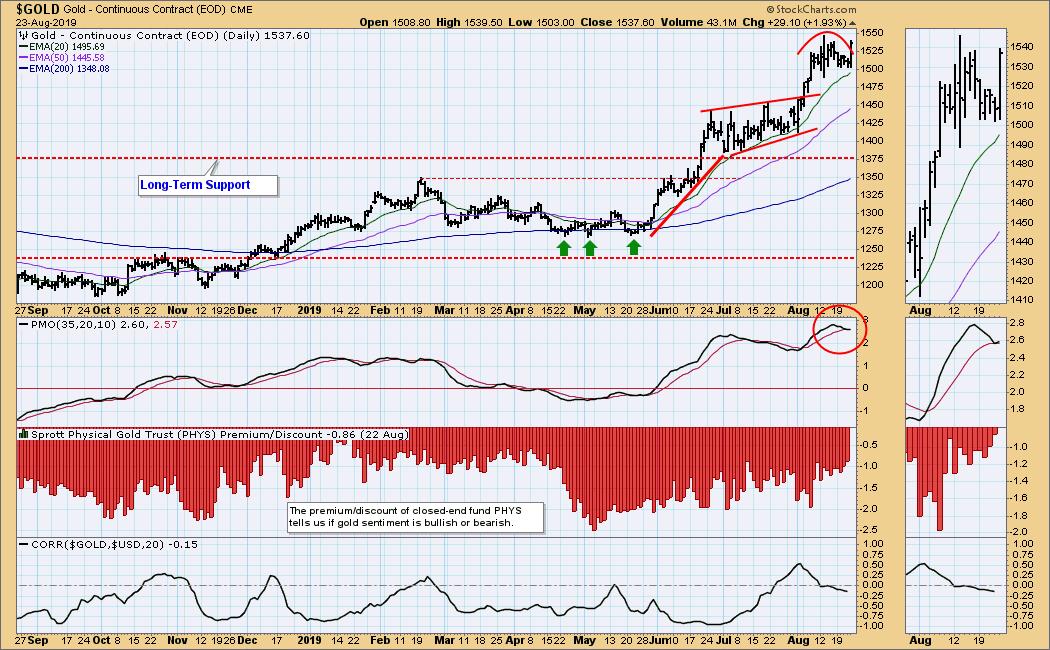
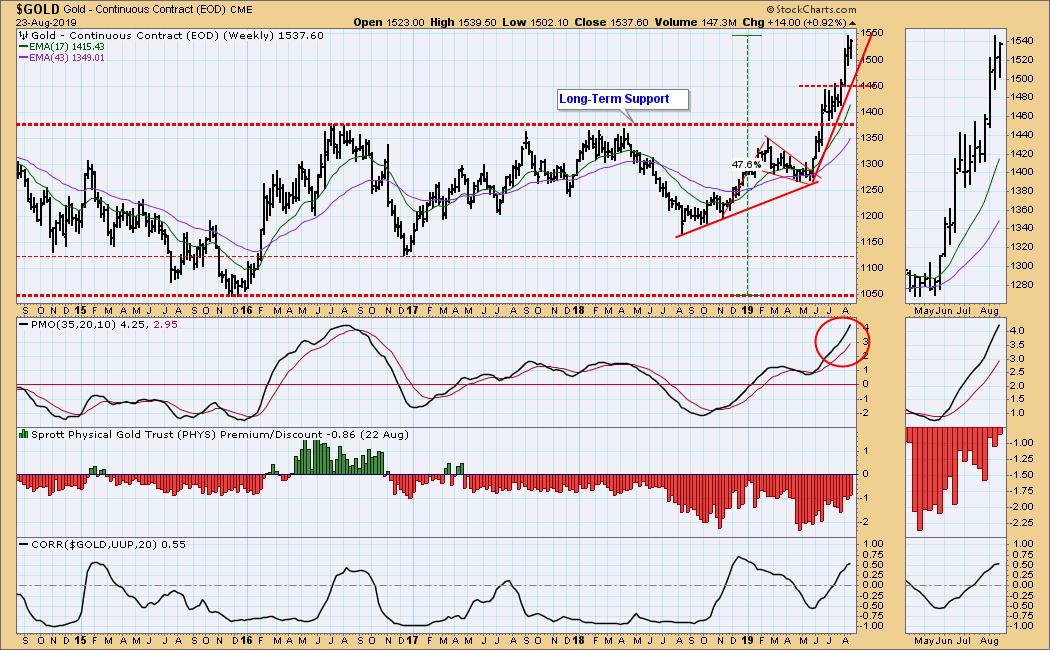
GOLD
IT Trend Model: BUY as of 6/3/2019
LT Trend Model: BUY as of 1/8/2019
GOLD Daily Chart: I was expecting the short-term rounded top to lead to a small correction, but my guess is that negative trade news led to a gold rally on Friday, and the rounded top is no longer relevant. The Daily PMO is overbought.
GOLD Weekly Chart: The weekly PMO is also overbought, but I think that gold is solidly in a bull market. Corrections will come, but the overall trend is up.
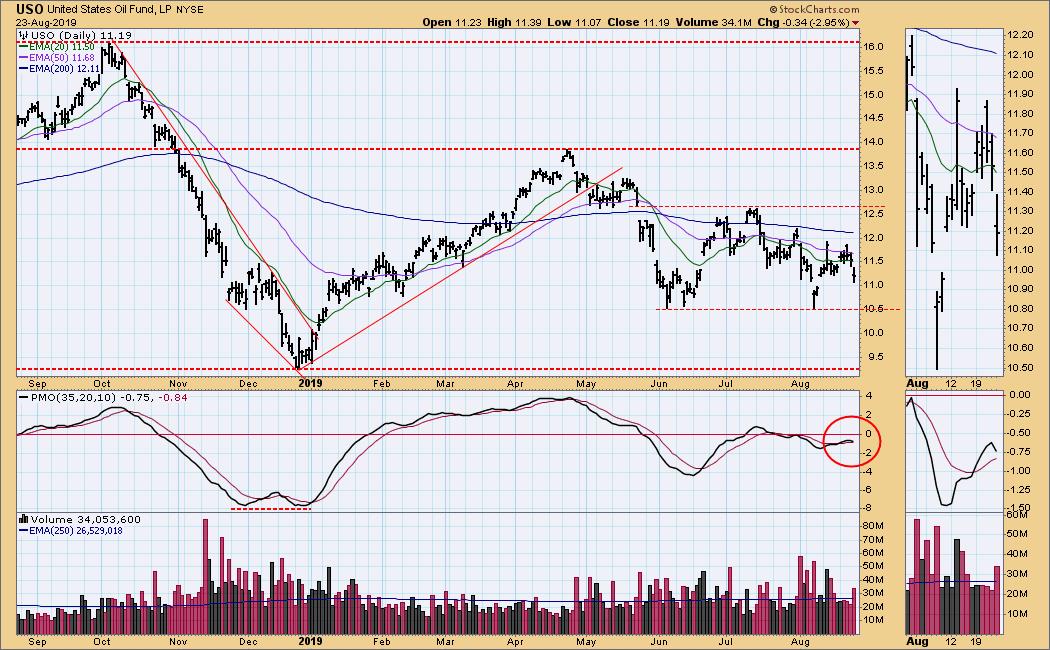
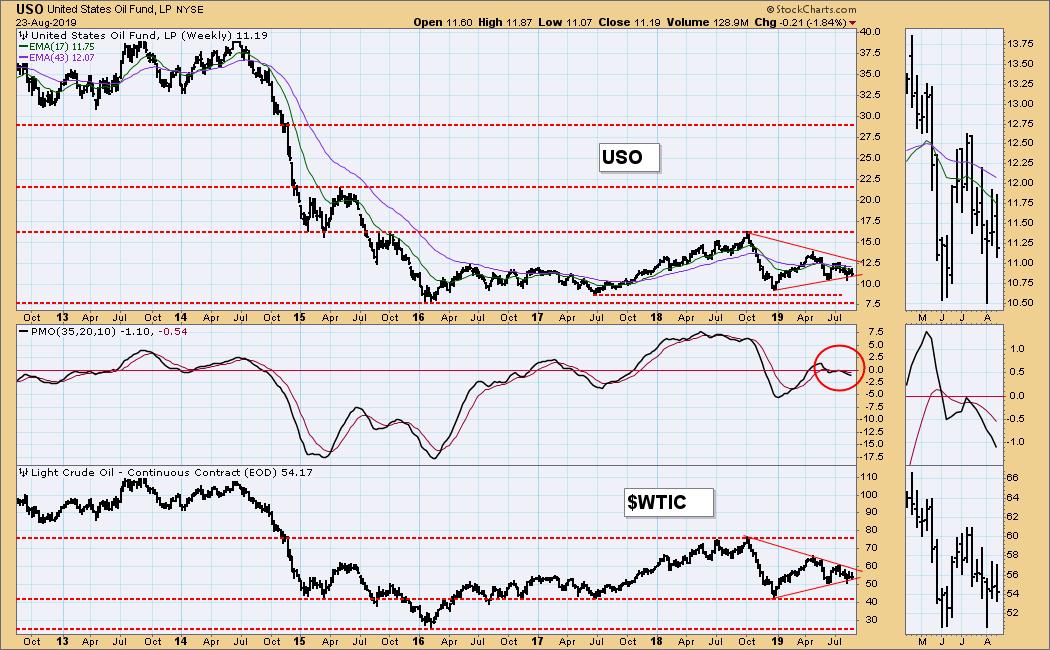
CRUDE OIL (USO)
IT Trend Model: NEUTRAL as of 5/30/2019
LT Trend Model: SELL as of 6/4/2019
USO Daily Chart: USO broke down on Friday, and it appears that the support at 10.50 will be tested.
USO Weekly Chart: While crude prices are holding fairly well, I'm expecting support levels to be tested eventually. That could take USO down to 7.50 and WTIC to 26.00. Be that as it may, the chart is neutral at this time.
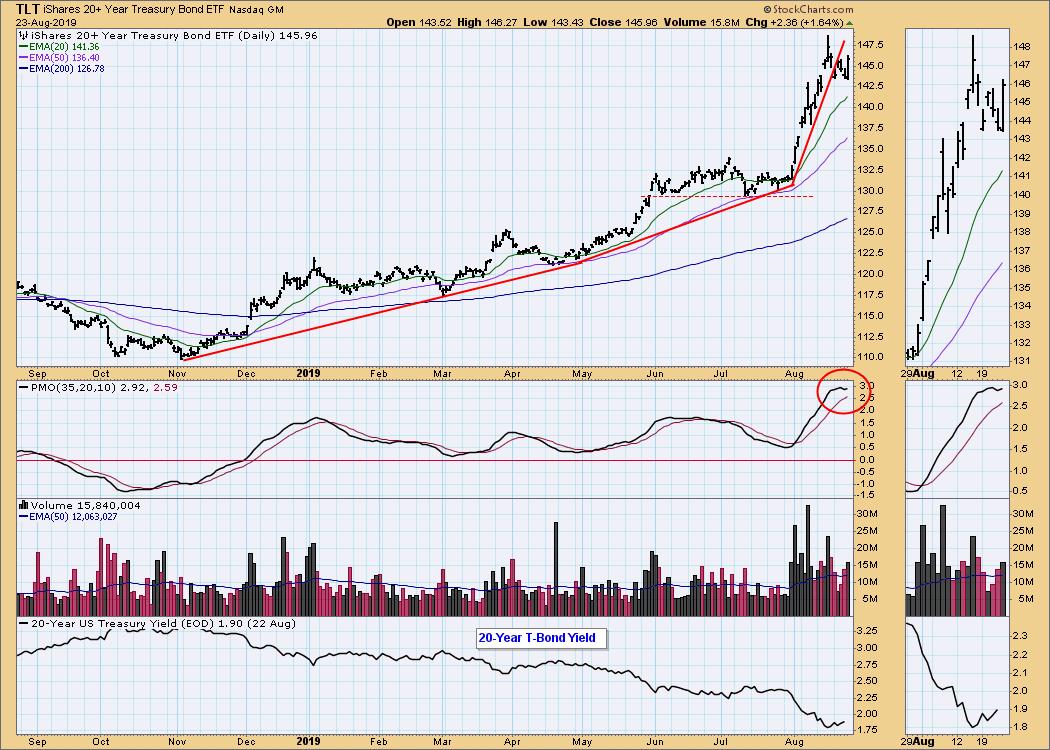
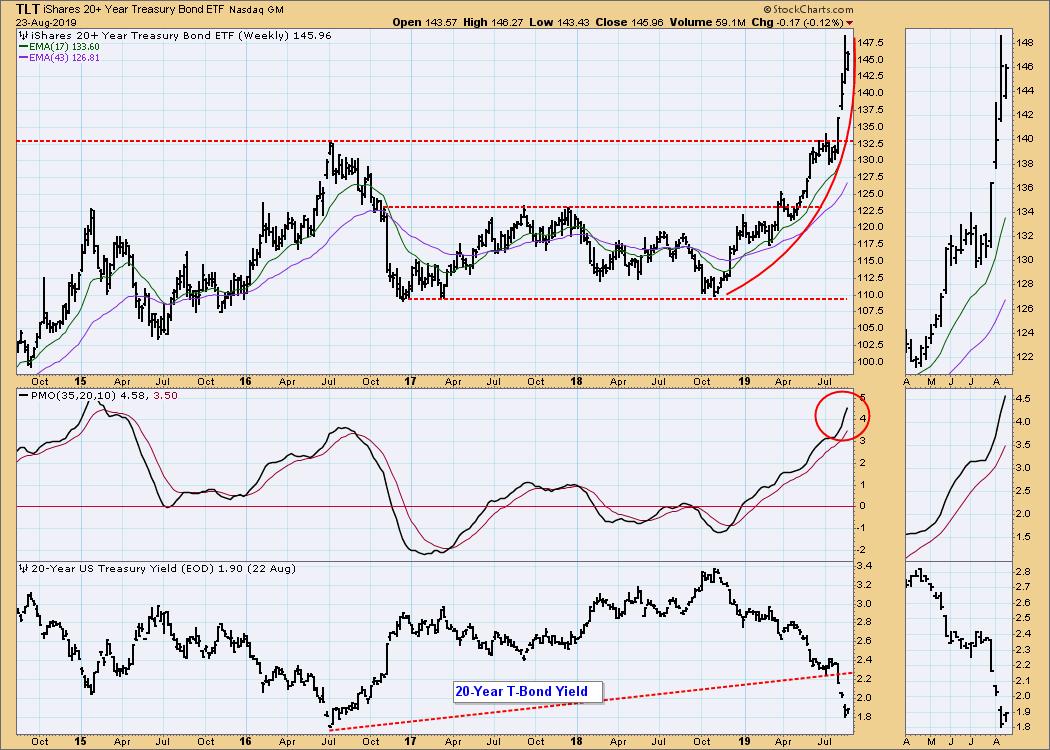
BONDS (TLT)
IT Trend Model: BUY as of 12/6/2018
LT Trend Model: BUY as of 1/2/2019
TLT Daily Chart: Bonds seemed to be headed for a short-term correction, but Friday's news postponed that possibility. I don't think the advance will be continued unless there is more news.
TLT Weekly Chart: In this time frame, a parabolic advance makes correction necessary sooner rather than later. TLT is overbought in every way.
**Don't miss any of the DecisionPoint commentaries! Go to the "Notify Me" box toward the end of this blog page to be notified as soon as they are published.**
Technical Analysis is a windsock, not a crystal ball.
Happy Charting! - Carl
NOTE: The signal status reported herein is based upon mechanical trading model signals, specifically, the DecisionPoint Trend Model. They define the implied bias of the price index based upon moving average relationships, but they do not necessarily call for a specific action. They are information flags that should prompt chart review. Further, they do not call for continuous buying or selling during the life of the signal. For example, a BUY signal will probably (but not necessarily) return the best results if action is taken soon after the signal is generated. Additional opportunities for buying may be found as price zigzags higher, but the trader must look for optimum entry points. Conversely, exit points to preserve gains (or minimize losses) may be evident before the model mechanically closes the signal.
Helpful DecisionPoint Links:
DecisionPoint Shared ChartList and DecisionPoint Chart Gallery
Price Momentum Oscillator (PMO)
Swenlin Trading Oscillators (STO-B and STO-V)
