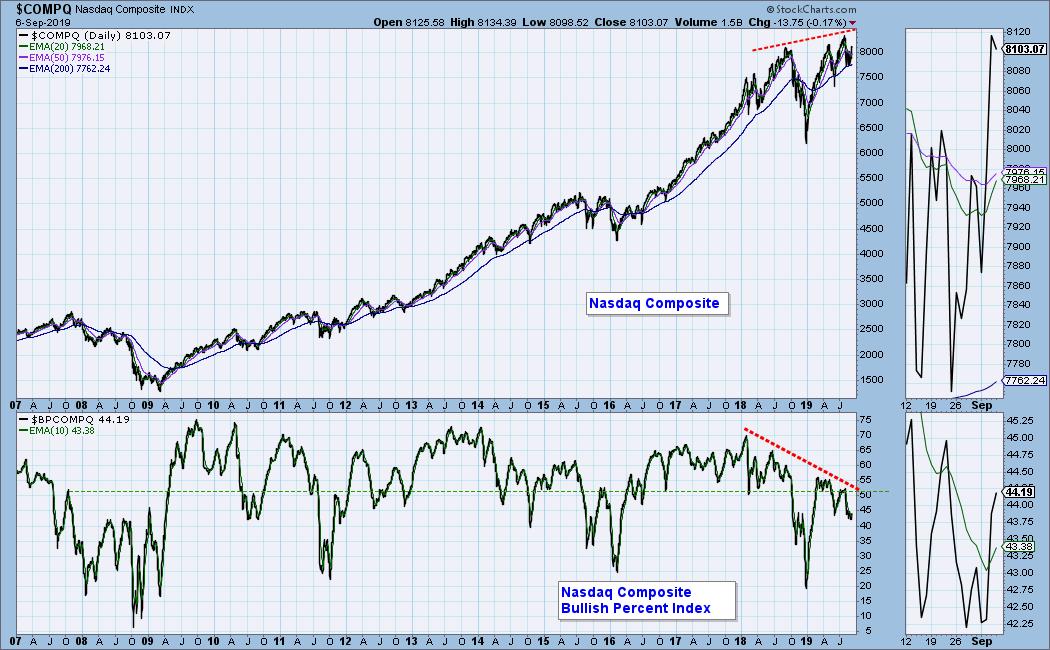
The Nasdaq Composite Index is about 2.5% below its all-time high of earlier this year, but its Bullish Percent Index (BPI), which is the percentage of Nasdaq component stocks with point and figure BUY signals, stands at only 44%. This is about -15% below the BPI reading at the 2007 market top, and about -45% below the all-time BPI of 78% in 2004 (not shown). There is a simple explanation for this gross negative divergence: The large-cap stocks in the index are carrying the index, while the small-cap dogs and cats are in trouble.
Charts of the S&P 500 and NYSE Composite BPIs show weakness similar to the Nasdaq; although the large-cap S&P 500 confirms large-cap leadership.
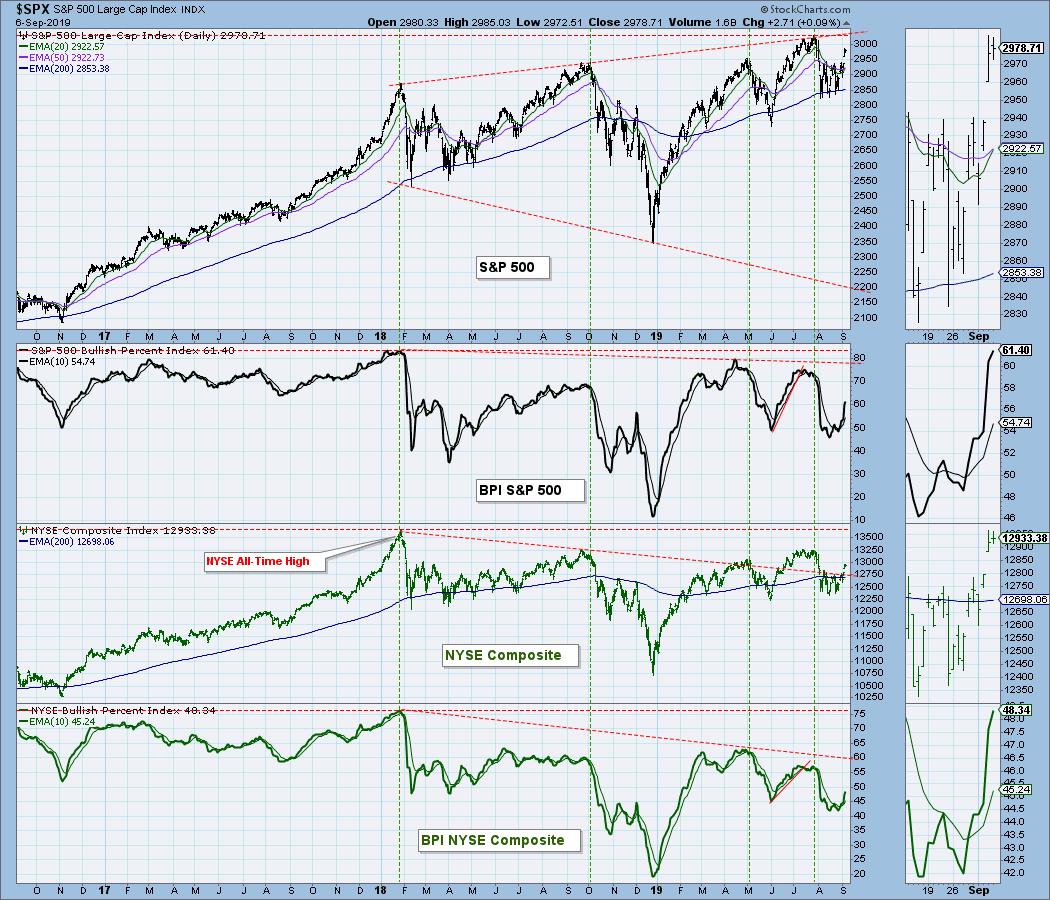
Conclusion: In spite of the broad market being near all-time highs, a substantial number of stocks are not participating in the advance. This is not healthy.
The DecisionPoint Weekly Wrap presents an end-of-week assessment of the trend and condition of the stock market (S&P 500), the U.S. Dollar, Gold, Crude Oil, and Bonds.
Watch the latest episode of DecisionPoint on StockCharts TV's YouTube channel here!
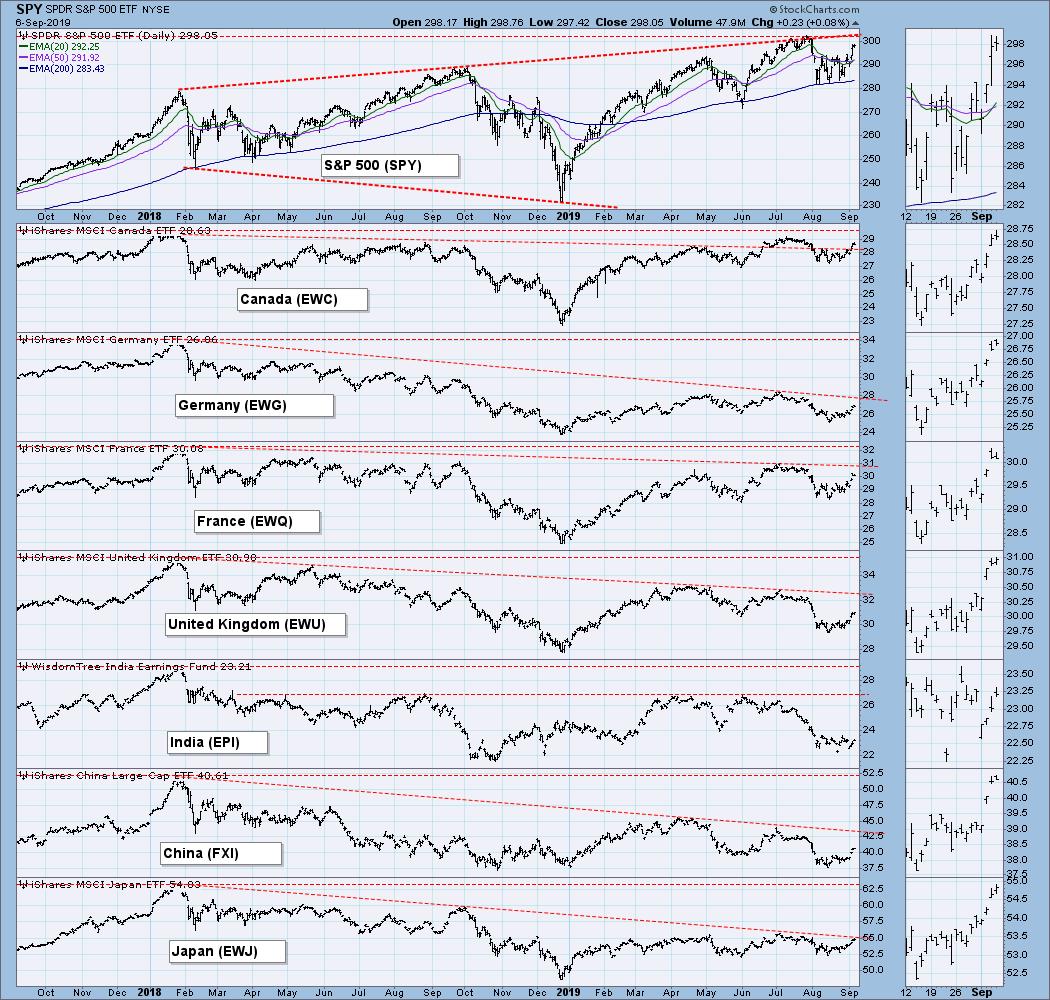
GLOBAL MARKETS
These charts and the Broad Market Indexes charts below are included in this report because I think, for background, we need to be generally aware of what these indexes are doing, but on a deeper level, I don't really care enough to get into a tedious analysis of them. Look at the charts, get a general impression, and move on. A picture is worth a thousand words. Look at the picture and think.
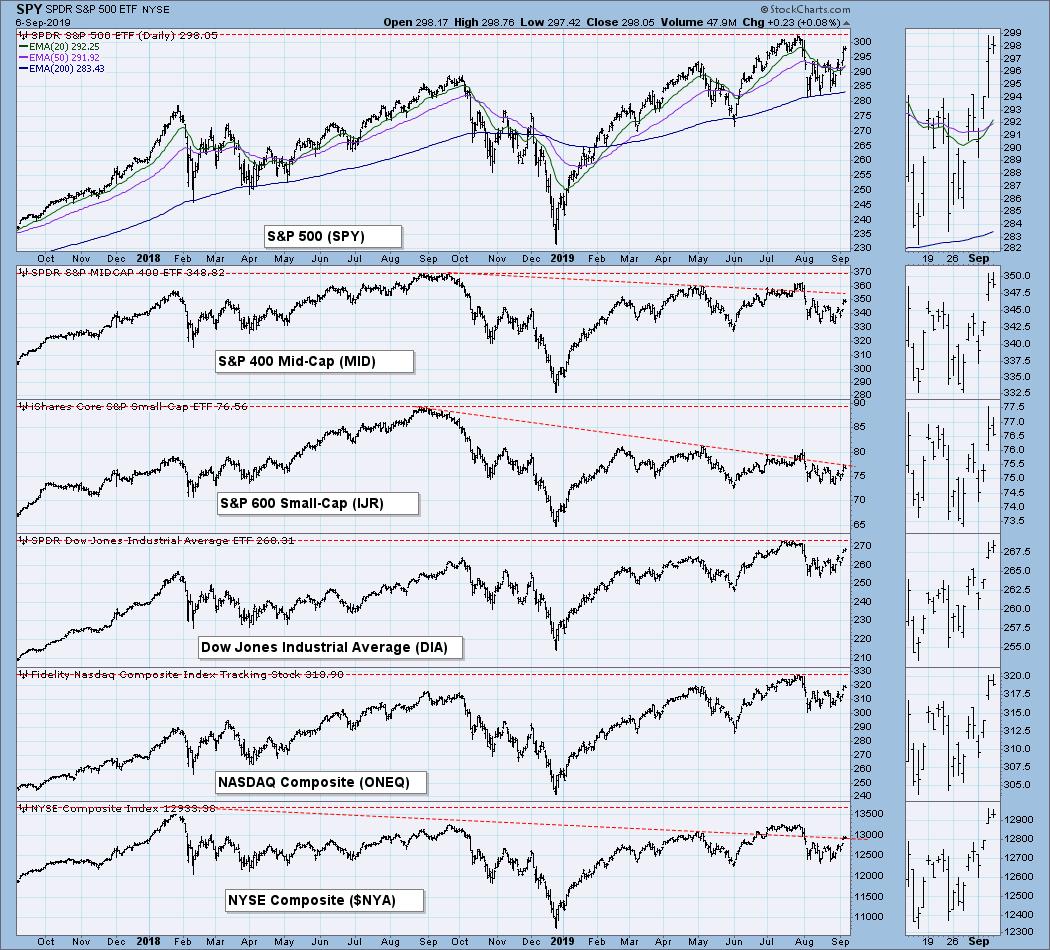
BROAD MARKET INDEXES
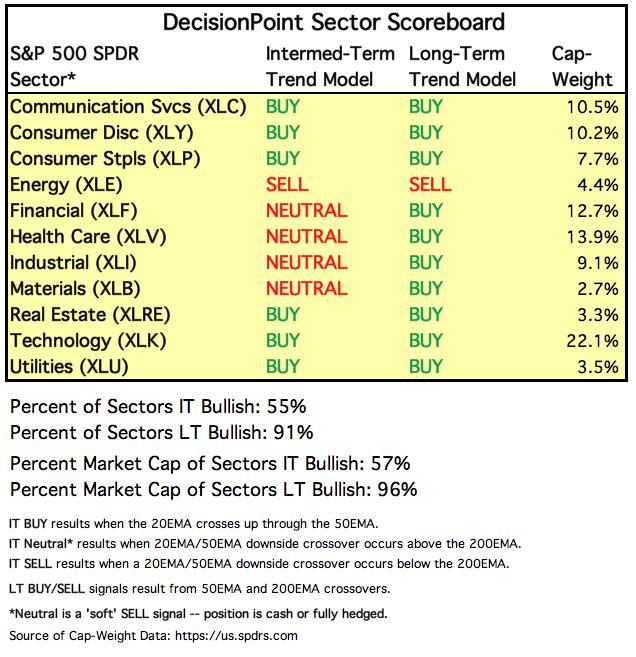
SECTORS
Each S&P 500 Index component stock is assigned to one, and only one, of 11 major sectors. This is a snapshot of the Intermediate-Term and Long-Term Trend Model signal status for those sectors.
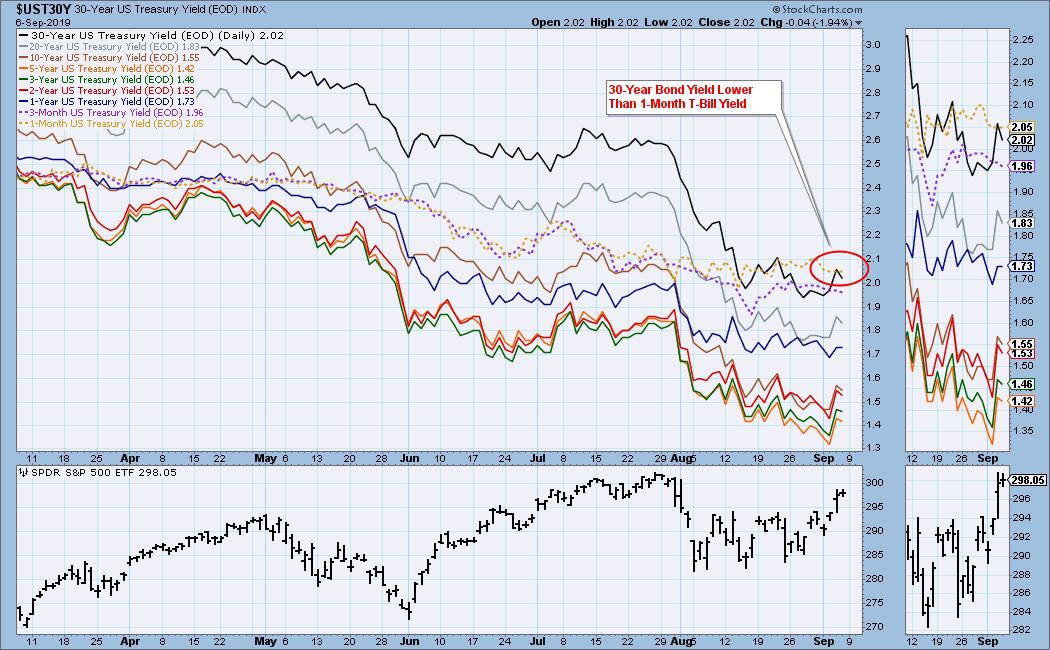
INTEREST RATES
Because some interest rates are currently inverted, I include this chart so we can monitor the situation. In normal circumstances the longer money is borrowed the higher the interest rate that must be paid. When rates are inverted, the reverse is true. It is generally believed that rate inversions result from "a flight to safety."
STOCKS
IT Trend Model: BUY as of 9/6/2019
LT Trend Model: BUY as of 2/26/2019
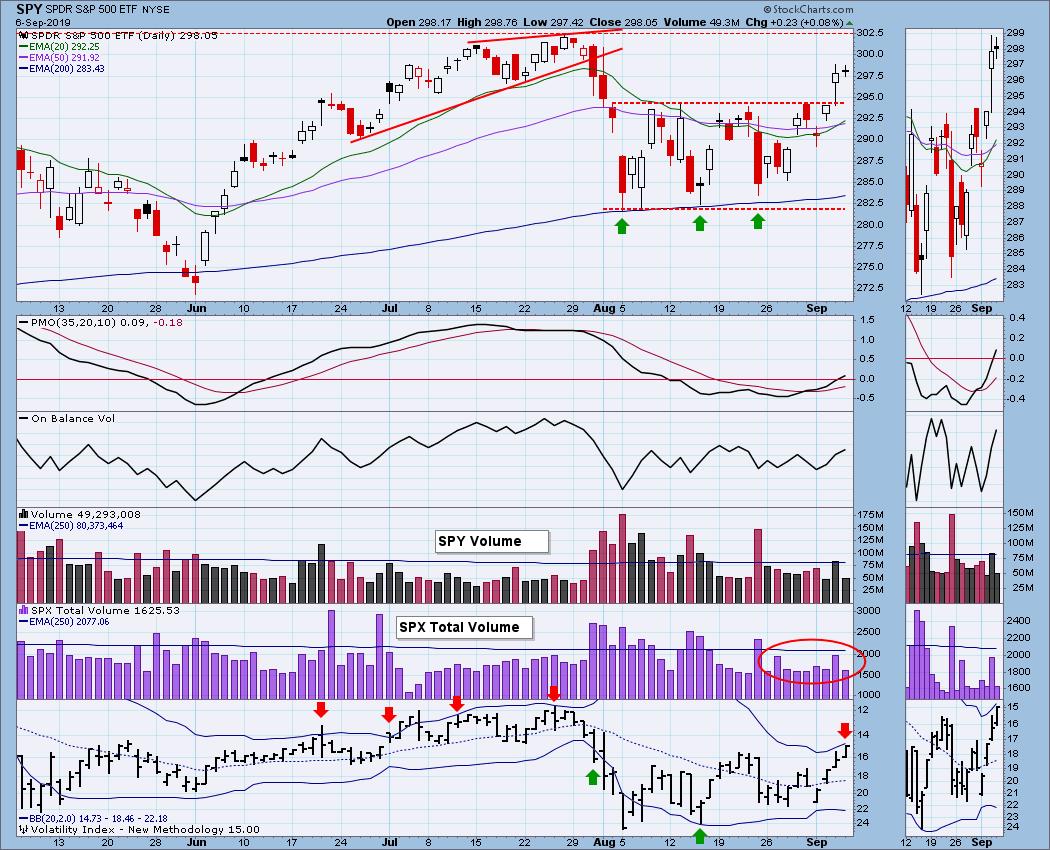
SPY Daily Chart: On Thursday the market managed to break out of the August trading range. There was no follow through on Friday, and Total SPX Volume continued to be thin. The VIX almost made it to the top Bollinger Band, and in this case close gets a cigar (red down arrow), because, for now, it is close enough to remind us that a short-term price top is probably days away. As bad luck would have it, the 20EMA crossed up through the 50EMA, and the IT Trend Model changed from NEUTRAL to BUY. I say "bad luck" because think the model will be whipsawed.
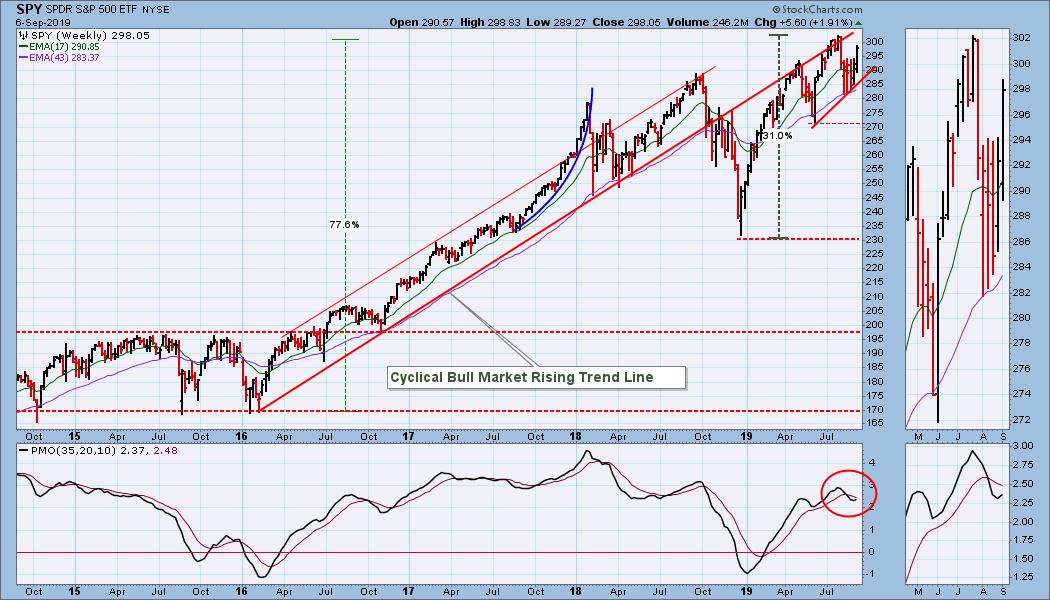
SPY Weekly Chart: We've still got a rising wedge in this time frame (bearish), but the weekly PMO turned up (bullish).
Climactic Market Indicators: We got climactic volume and breadth readings on Wednesday and Thursday, and the VIX is now overbought. New Highs contracted on Thursday and Friday. I'm thinking this is a setup for a short-term top.
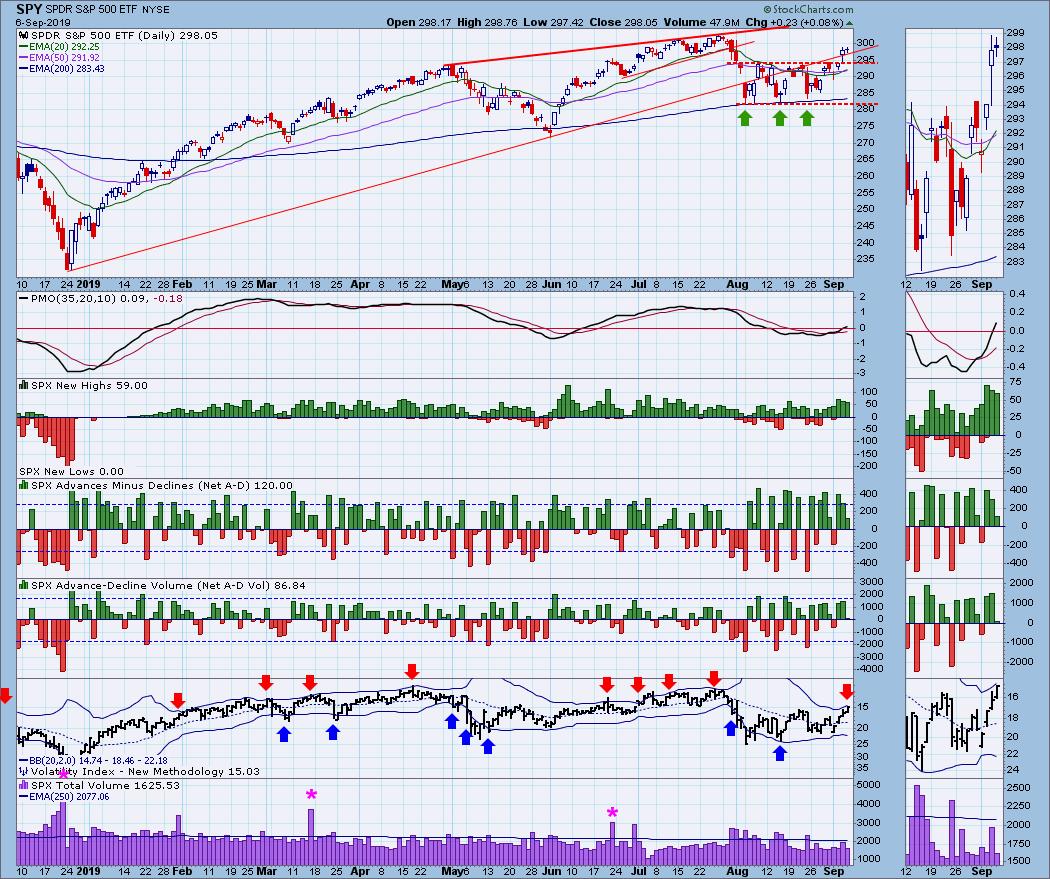
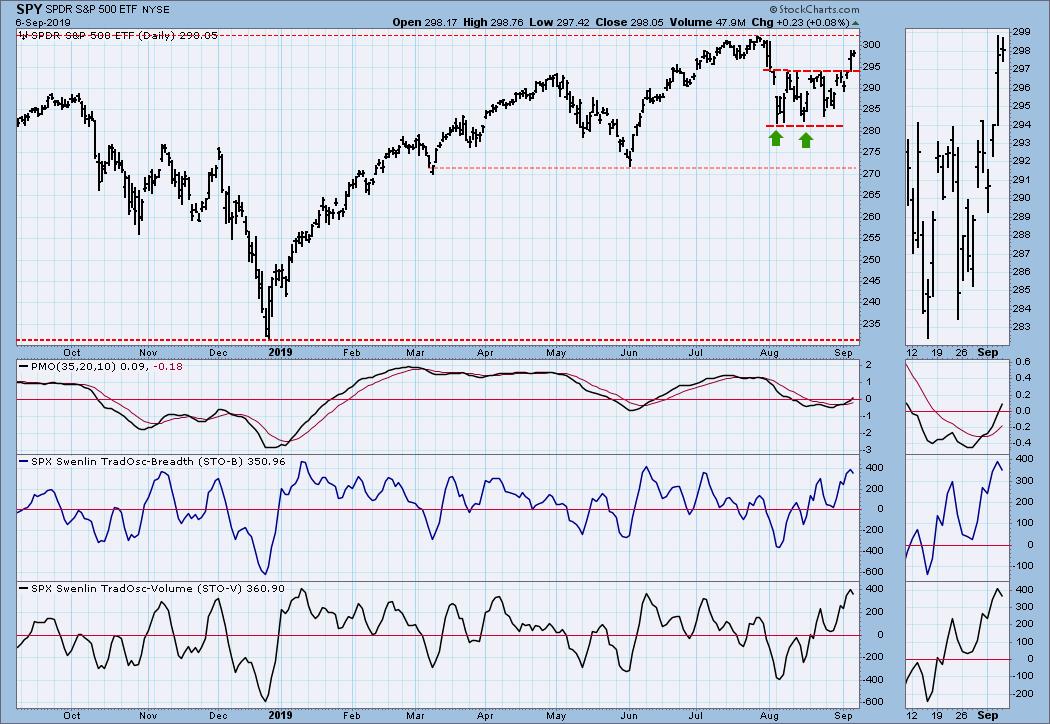
Short-Term Market Indicators: The STO-B and STO-V are overbought and they topped Friday -- a greart setup for a short-term pullback.
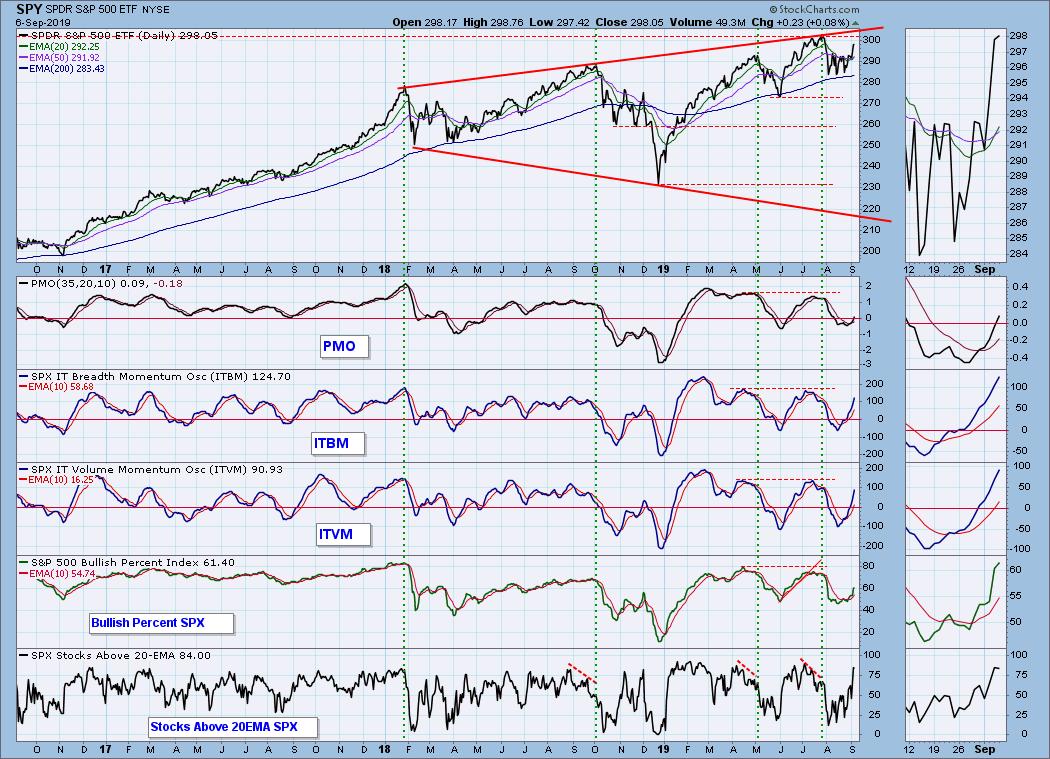
Intermediate-Term Market Indicators: The ITBM, ITVM, and Stocks Above 20EMA are all overbought, making the market vulnerable in this time frame.
CONCLUSION: On Wednesday and Thursday we got favorable trade news, and the market rallied strongly; however, none of the news had any substance. Okay, the Chinese offered to reopen negotiations in October, but there is no indication that they will acquiesce on key issues. To put it politely, I think they are just jerking us around and running out the clock until the 2020 election. Until then, we can expect more news-driven chop and baloney.
It appears that the Fed will lower interest rates a quarter point on the 18th. In my opinion, that is already baked into the market and won't have much effect. A larger cut will probably give the market a boost.
While the market is in a rising trend short- and intermediate-term, it is also overbought and vulnerable for a correction. Also, my earlier discussion regarding the BPI for the major market indexes shows how beaten down participation has become. We may be close to all-time highs, but internal support is thin, and a pullback could easily turn into a rout.
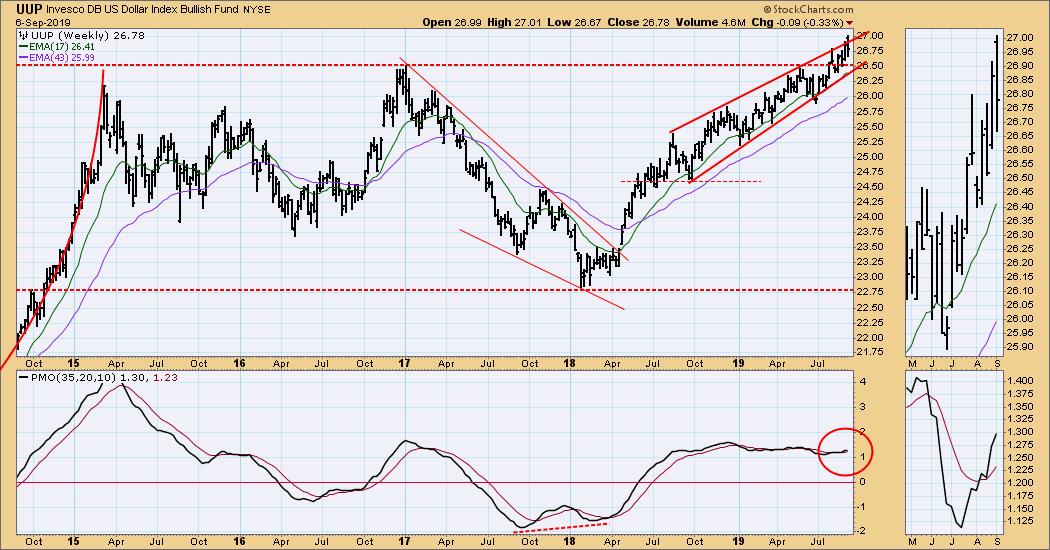
DOLLAR (UUP)
IT Trend Model: BUY as of 7/5/2019
LT Trend Model: BUY as of 5/25/2018
UUP Daily Chart: Price has dropped back into the extended rising wedge following some pretty choppy movement this week.
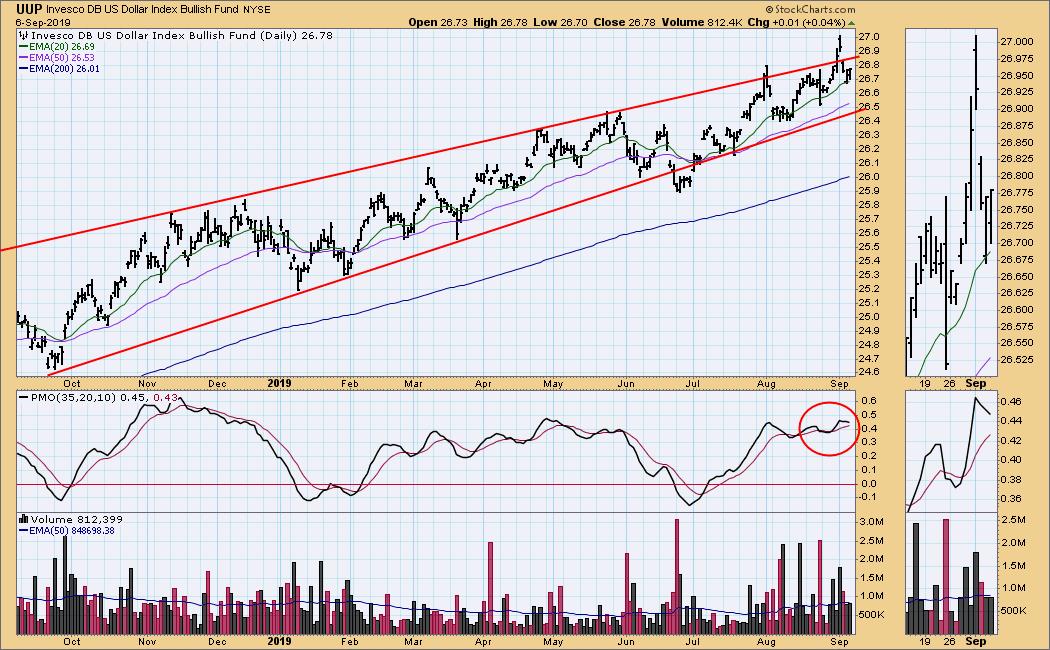
UUP Weekly Chart: While the rising wedge dominates the daily chart, in this time frame the long-term line of resistance is center stage. The flat and positive weekly PMO emphasizes the steady one-year price advance, and implies that it could continue.
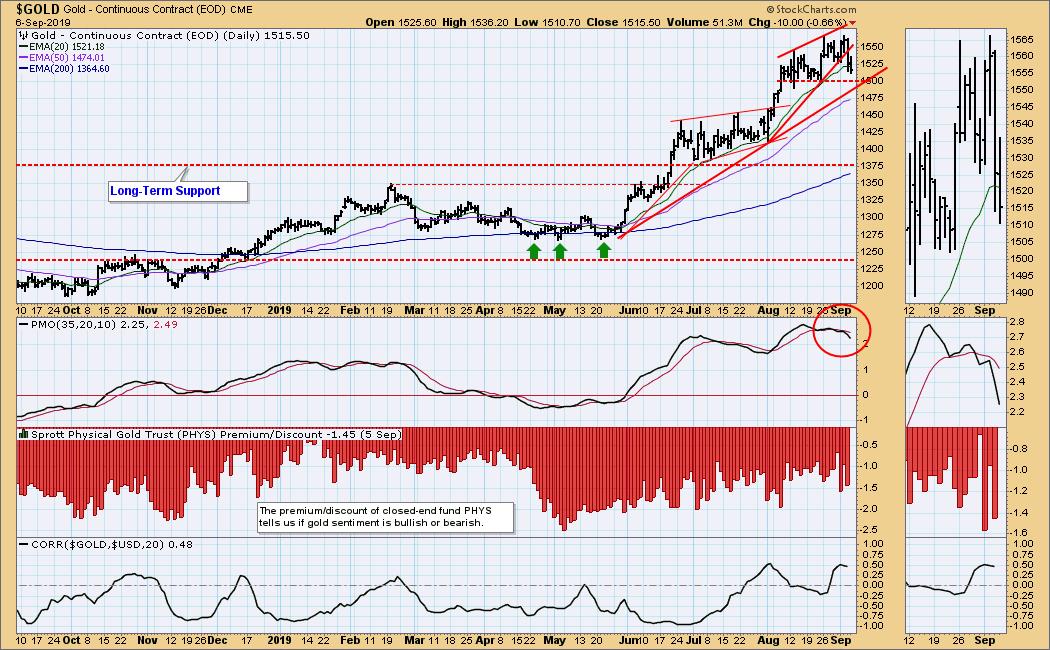
GOLD
IT Trend Model: BUY as of 6/3/2019
LT Trend Model: BUY as of 1/8/2019
GOLD Daily Chart: Gold broke down from the rising wedge this week, which was the technical expectation. the first obvious level of support is at 1500, which would also coincide with the rising trend line drawn from the May lows.
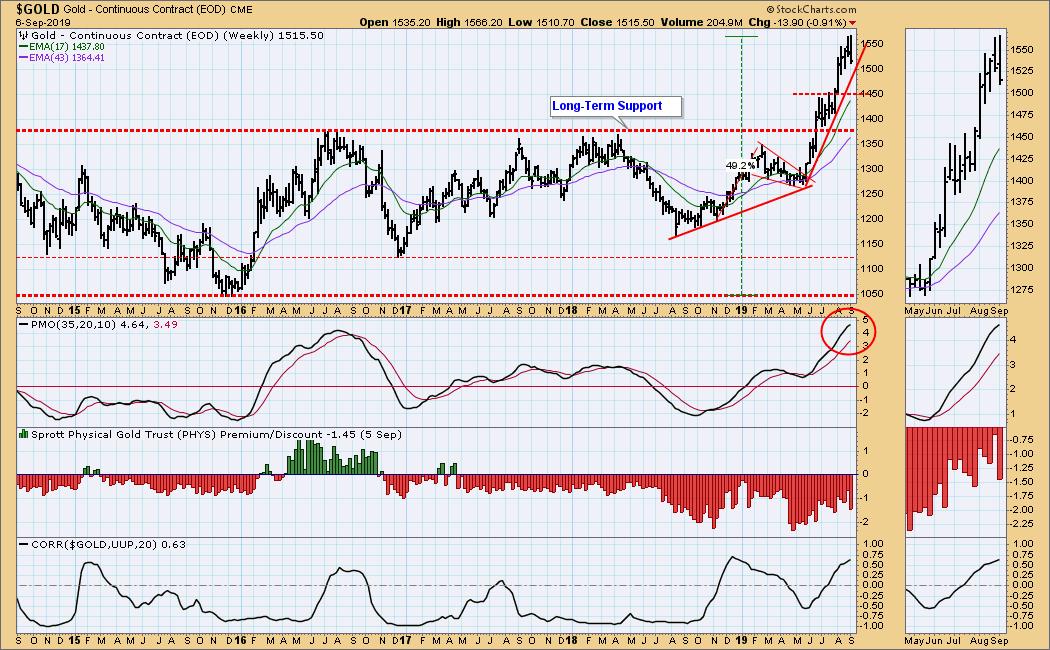
GOLD Weekly Chart: I don't know how extreme this correction will be, but 1375 is a critical level of support. My guess is that we won't see a decline anywhere close to that.
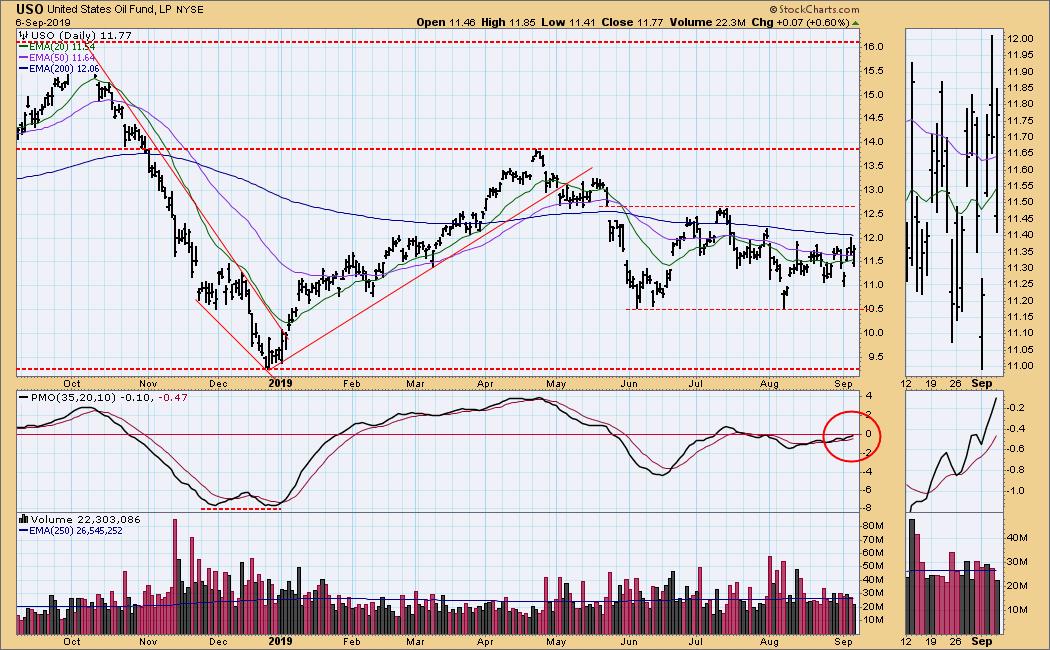
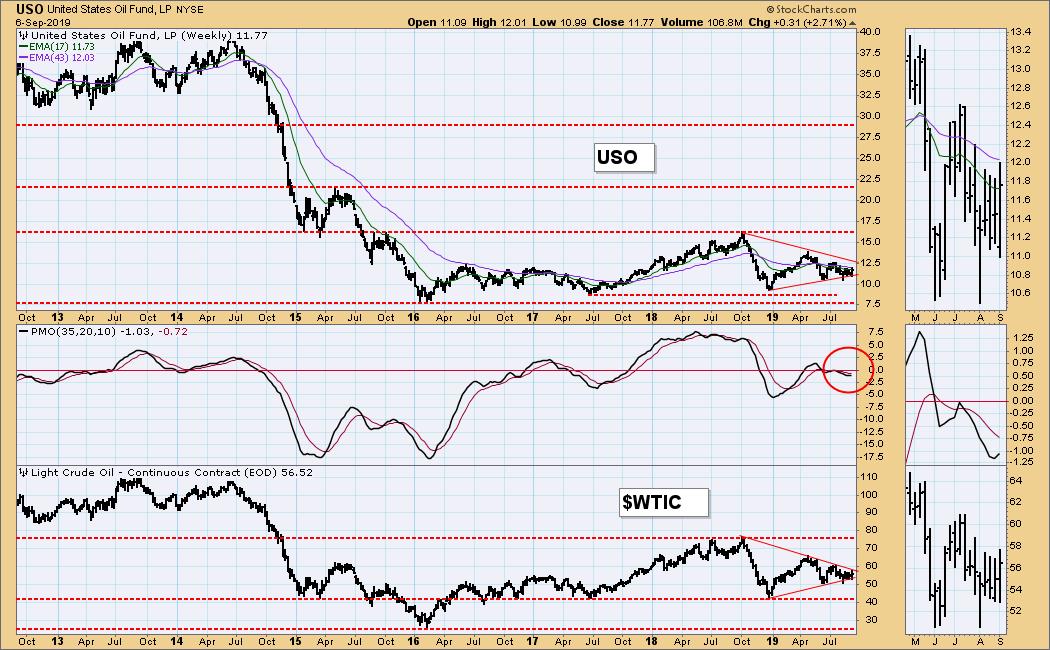
CRUDE OIL (USO)
IT Trend Model: NEUTRAL as of 5/30/2019
LT Trend Model: SELL as of 6/4/2019
USO Daily Chart: Crude seems to be going nowhere in a not very interesting way.
USO Weekly Chart: I'm still looking at a range for WTIC of 42 to 76, snd I think we'll see the bottom of that range sooner than the top.
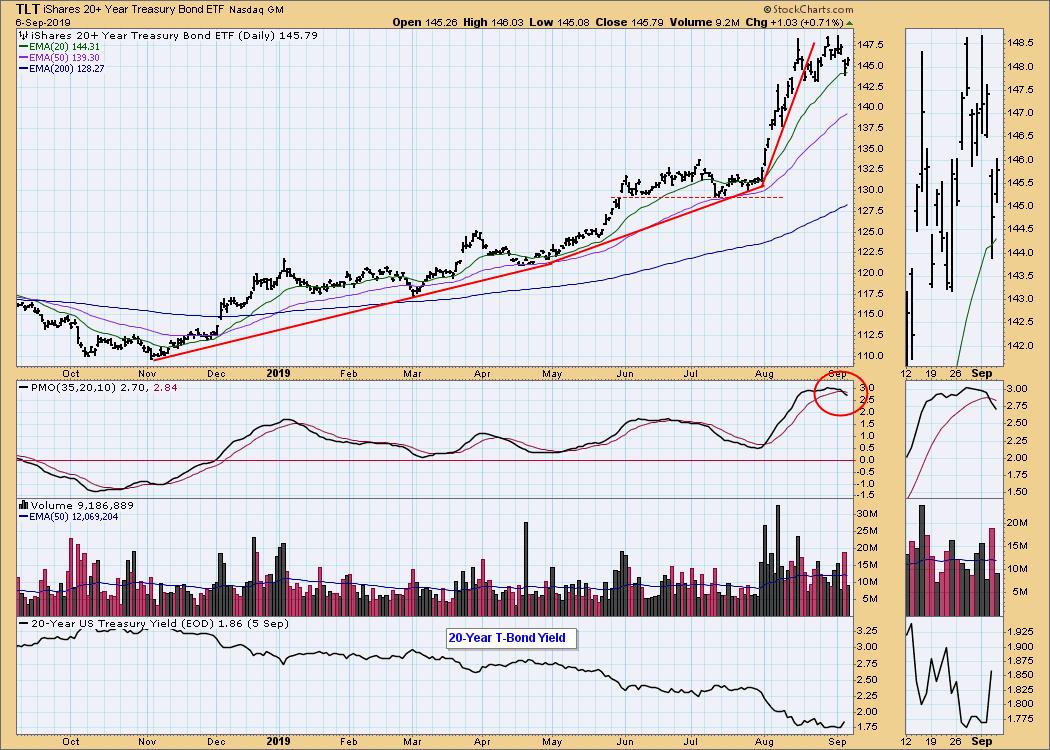
BONDS (TLT)
IT Trend Model: BUY as of 12/6/2018
LT Trend Model: BUY as of 1/2/2019
TLT Daily Chart: We seem to have reached the upper limit of the current advance in bond prices. I'll be looking for prices to consolidate or pull back to digest the recent advance. On September 18 there will be an FOMC announcement regarding their interest rate decision. Currently, expectations are for a cut of a quarter percentage point, but there is also hope for a half percent.
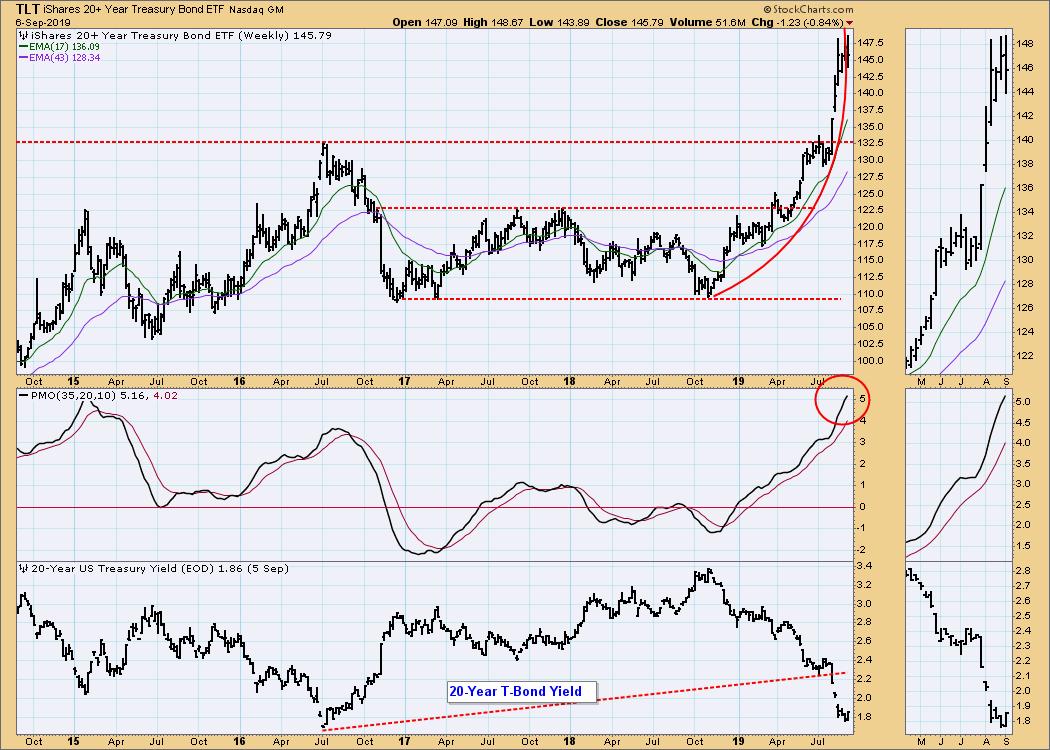
TLT Weekly Chart: The price advance from last year's low has been parabolic, and some correction is necessary. If the Fed only cuts a quarter point, that may be small enough to allow long bonds to settle somewhat.
**Don't miss any of the DecisionPoint commentaries! Go to the "Notify Me" box toward the end of this blog page to be notified as soon as they are published.**
Technical Analysis is a windsock, not a crystal ball.
Happy Charting! - Carl
NOTE: The signal status reported herein is based upon mechanical trading model signals, specifically, the DecisionPoint Trend Model. They define the implied bias of the price index based upon moving average relationships, but they do not necessarily call for a specific action. They are information flags that should prompt chart review. Further, they do not call for continuous buying or selling during the life of the signal. For example, a BUY signal will probably (but not necessarily) return the best results if action is taken soon after the signal is generated. Additional opportunities for buying may be found as price zigzags higher, but the trader must look for optimum entry points. Conversely, exit points to preserve gains (or minimize losses) may be evident before the model mechanically closes the signal.
Helpful DecisionPoint Links:
DecisionPoint Shared ChartList and DecisionPoint Chart Gallery
Price Momentum Oscillator (PMO)
Swenlin Trading Oscillators (STO-B and STO-V)
