Don't Ignore This Chart! January 29, 2010 at 07:32 AM
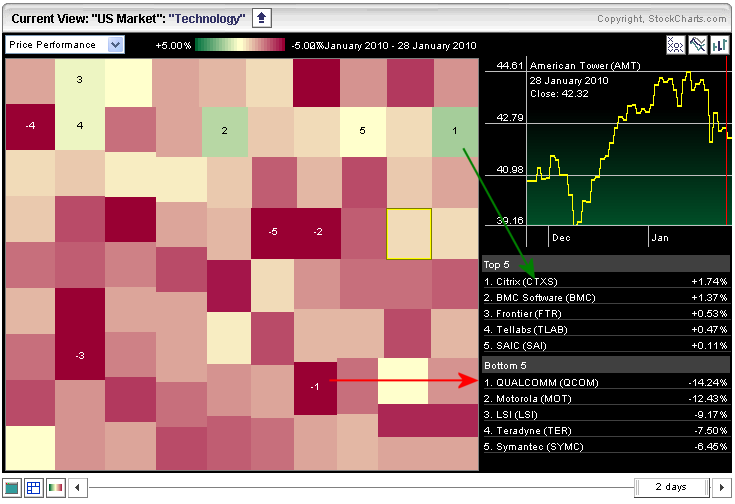
Within the S&P Sector Carpet, the technology sector showed a lot of red on Thursday. From the Sector Carpet, click on the technology heading to focus on this sector... Read More
Don't Ignore This Chart! January 28, 2010 at 08:26 AM
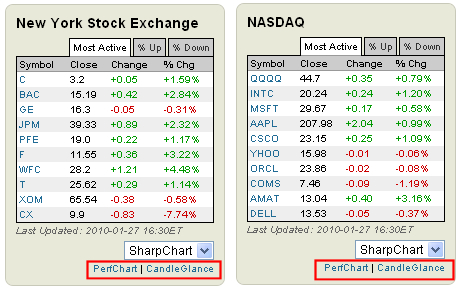
From the Free Charts page, users can access a quick list of the 10 most active stocks for the Nasdaq and NYSE. As Wednesday's lists show, the finance sector was strong on Wednesday. Four of the ten most active were from the finance sector and these four were up over 1%... Read More
Don't Ignore This Chart! January 27, 2010 at 09:06 AM
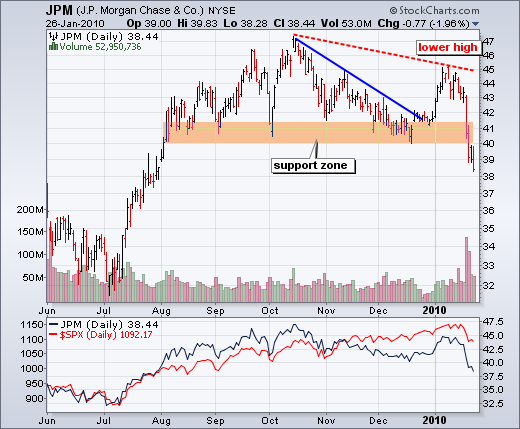
JP Morgan is leading the market and the finance sector lower with a break below its September-December lows. The stock first established support in the 40-41 zone in mid August and held this zone in September, October, November and December... Read More
Don't Ignore This Chart! January 26, 2010 at 11:54 AM
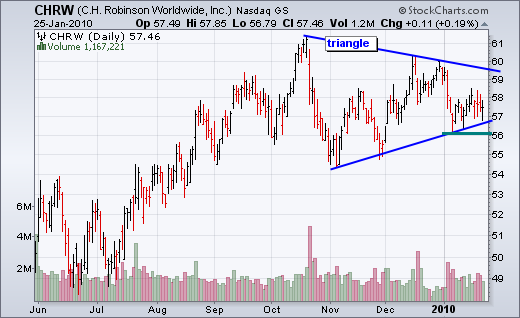
CH Robinson (CHRW), a trucking company, formed a big triangle consolidation over the last nine months. The stock has recently been consolidating near triangle support and a break below 56 would be bearish... Read More
Don't Ignore This Chart! January 25, 2010 at 05:21 PM
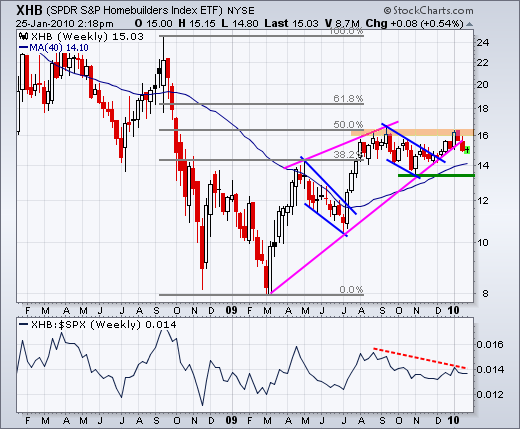
The Homebuilders SPDR (XHB) finished 2009 strong, but ran into resistance from its summer highs in 2010. The ETF first hit resistance around 16 in late July and traded in the 14-16 are the last 6-7 months. The stock has long-term support at 13... Read More
Don't Ignore This Chart! January 22, 2010 at 01:24 PM
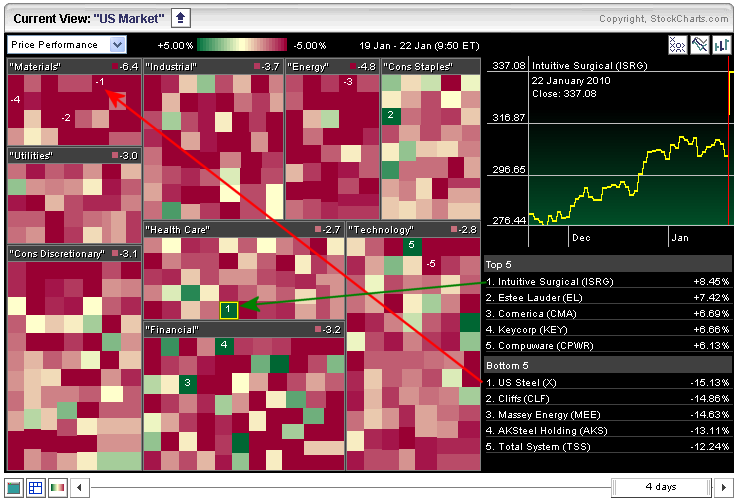
The s ector carpet over the last four days shows lots of red. Within the S&P 500, three of the five biggest losses came from steel stocks (US Steel, Cleveland Cliffs and AK Steel). There were, however, a few gainer that can be spotted with the green squares... Read More
Don't Ignore This Chart! January 21, 2010 at 02:43 PM
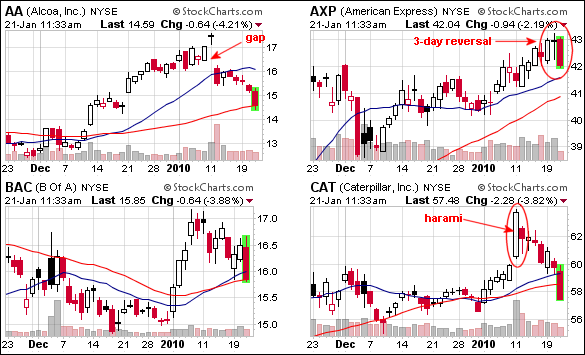
The CandleGlance page for the Dow shows all 30 stocks trading in negative territory early Thursday. These mini-candlestick charts provide an quick means to see current action and candlestick setups... Read More
Don't Ignore This Chart! January 20, 2010 at 03:45 PM
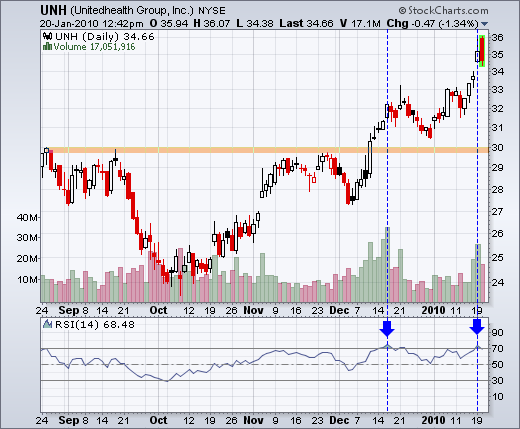
United Health (UNH) remains in a clear, and strong, uptrend, but the advance could be getting frothy as RSI becomes overbought and red candlestick takes shape on Wednesday. Notice that RSI moved above 70 for the second time in two months (blue arrows)... Read More
Don't Ignore This Chart! January 19, 2010 at 02:54 PM
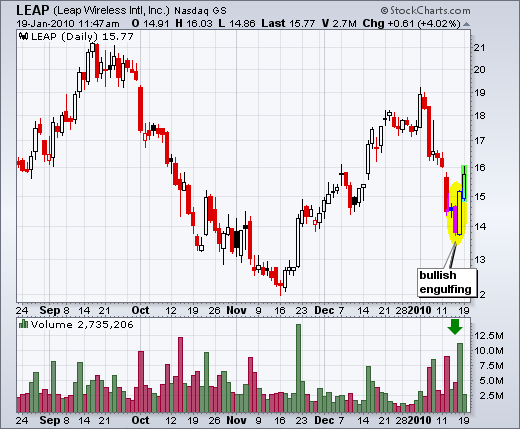
Direct from the StockScans candlestick page, Leap Wireless (LEAP) formed a bullish engulfing on big volume Friday. A bullish engulfing forms with a filled black or red candlestick and longer white candlestick... Read More
Don't Ignore This Chart! January 15, 2010 at 03:17 PM
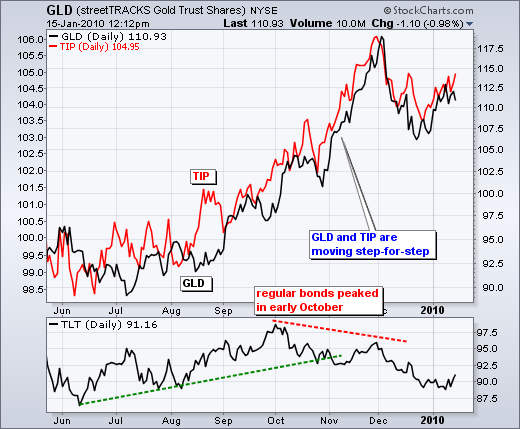
The Gold ETF (GLD) and the Inflation-Protected Bond ETF (TIP) show a positive correlation over the last few months. Both advanced from August to November, fell in December and bounced in January. Looks like gold is following the inflation outlook... Read More
Don't Ignore This Chart! January 14, 2010 at 04:18 PM
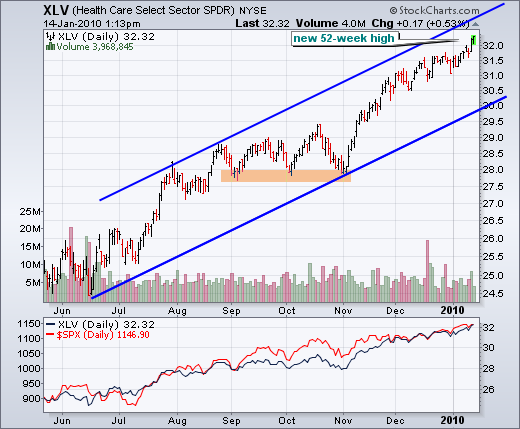
Money continues to flow into the healthcare sector as the Healthcare SPDR (XLV) recorded another 52-week high this week. XLV bounced off support in early November and surged over 12% in the last 12 weeks... Read More
Don't Ignore This Chart! January 13, 2010 at 01:50 PM
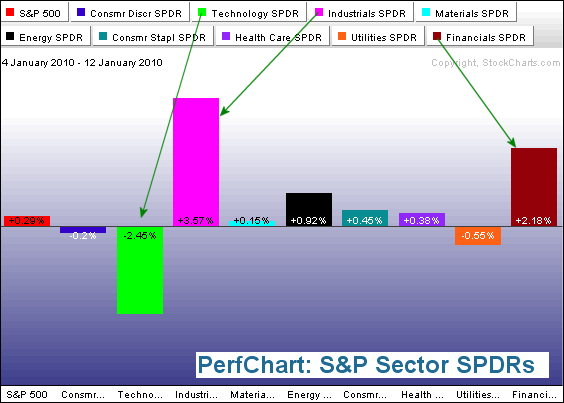
2010 has not been nice to the technology sector. The PerfChart below extends from January 4th until January 12th. Of the nine sectors SPDRs, and the S&P 500, the Technology SPDR (XLK) is down the most (over 2%)... Read More
Don't Ignore This Chart! January 12, 2010 at 12:04 PM
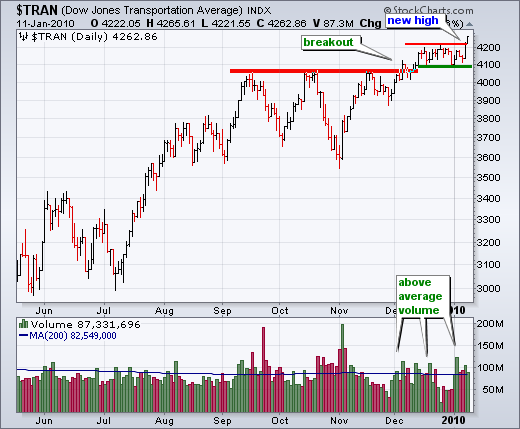
After breaking resistance in December, the Dow Transports consolidated a few weeks and then broke to a new 52-week high this week. Volume has also been strong since early December as many up days occurred with above average volume... Read More
Don't Ignore This Chart! January 11, 2010 at 03:11 PM
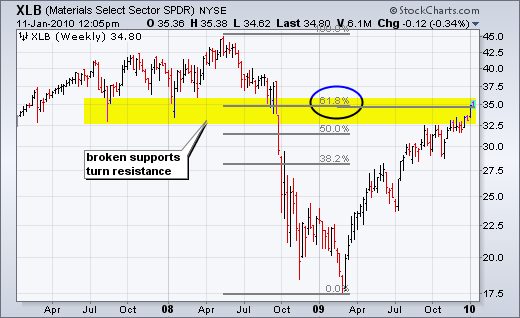
With a huge advance since March 2009, the Materials SPDR (XLB) has retraced 62% of the prior decline, which extended from May 2008 to March 2009. There is also potential resistance from broken supports around 34-36... Read More
Don't Ignore This Chart! January 08, 2010 at 08:34 AM
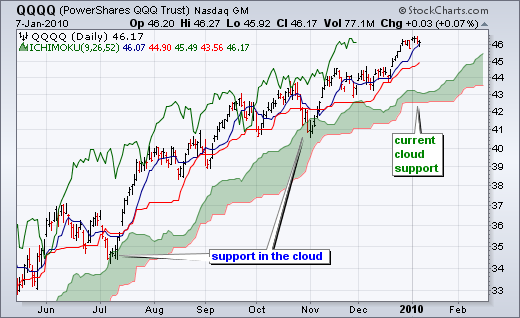
The strength of the current rally can be seen with QQQQ and the Ichimoku cloud indicator, which marks a support zone. Notice how QQQQ bounced near the top of the cloud in July and in the middle of the cloud in early November. Cloud support is currently in the 42.5-43 area... Read More
Don't Ignore This Chart! January 07, 2010 at 08:22 AM
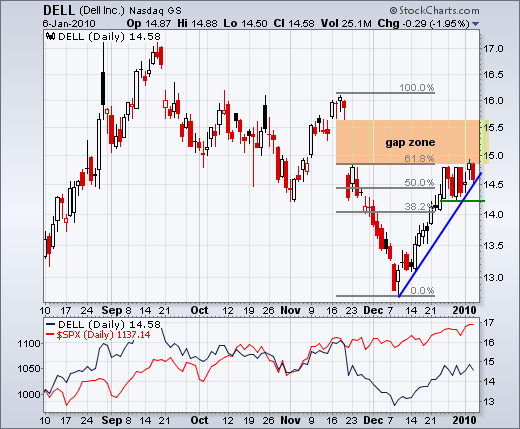
With a pretty nice advance the last 4-5 weeks, DELL returned to the gap zone and retraced 62% of its prior decline. Resistance in this area is becoming apparent with four red candlesticks over the last eight days... Read More
Don't Ignore This Chart! January 06, 2010 at 08:11 PM
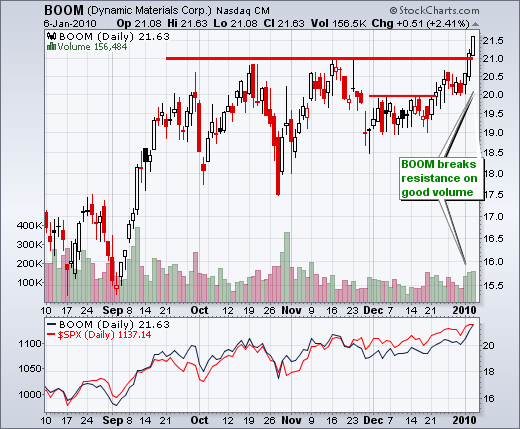
Dynamic Materials (BOOM) broke through resistance with a high volume surge over the last three days... Read More
Don't Ignore This Chart! January 05, 2010 at 09:49 AM
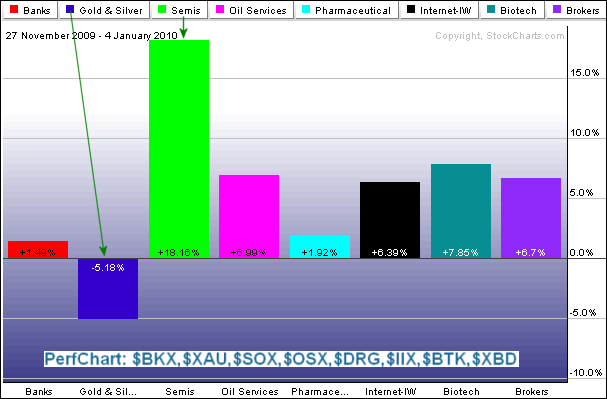
The Perfchart below shows eight industry groups over the last five weeks (25 trading days). Semis ($SOX) are by far the strongest group. Gold & Silver ($XAU) represent the weakest group. It is also notable that Banks ($BKS) are lagging the other advancing groups... Read More
Don't Ignore This Chart! January 04, 2010 at 06:05 PM
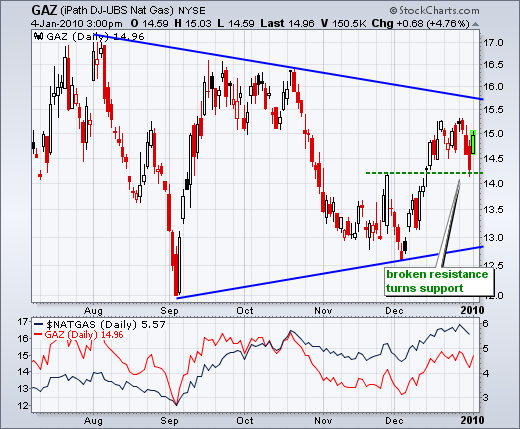
The iPath Natural Gas ETF ($GAZ) surged over 4% after a cold front slammed the Northeast. On the chart below, notice that GAZ broke resistance in mid December and broken resistance then turned into support... Read More