Don't Ignore This Chart! February 25, 2011 at 02:58 PM
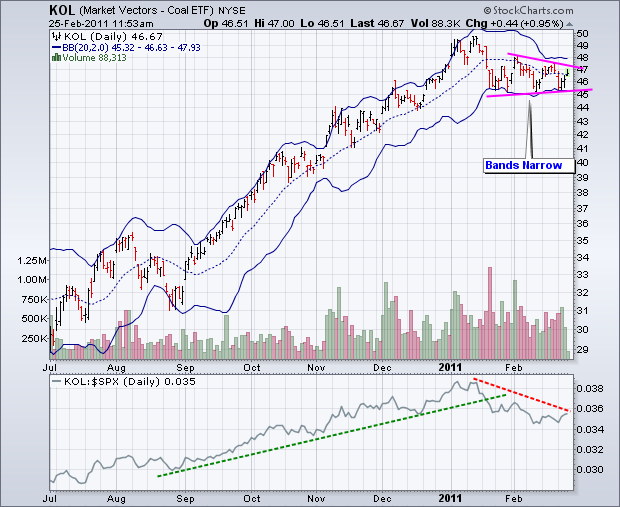
The Coal Vectors ETF (KOL) has been stuck in a tightening trading range the last five weeks. After the sharp January decline, the ETF formed a triangle in February... Read More
Don't Ignore This Chart! February 24, 2011 at 02:13 PM
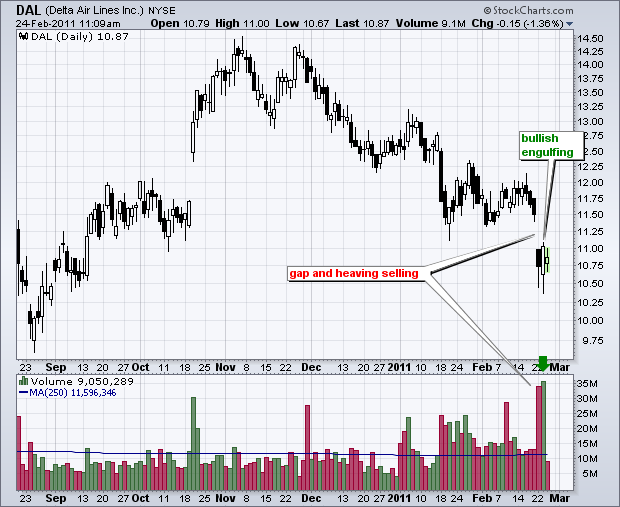
Delta Airlines (DAL) came across the bullish engulfing scan on the predefined scans page. The stock gapped lower and declined with heaving volume on Tuesday. This decline was countered with a bullish engulfing on Wednesday with even higher volume... Read More
Don't Ignore This Chart! February 23, 2011 at 11:56 AM
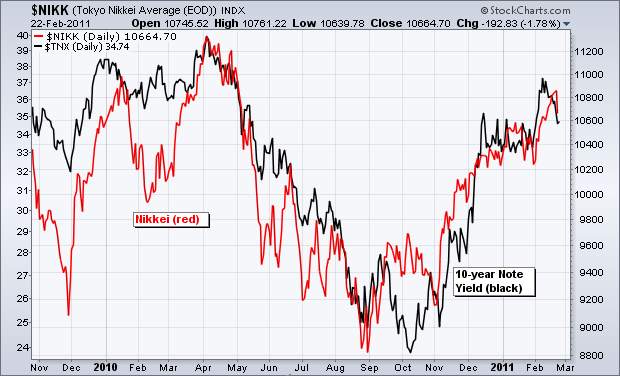
It may seem a rather strange relationship, but the Nikkei 225 ($NIKK) and the 10-year Treasury Yield ($TNX) have a positive relationship working. The chart below shows both rising and falling together since November 2009... Read More
Don't Ignore This Chart! February 22, 2011 at 02:44 PM
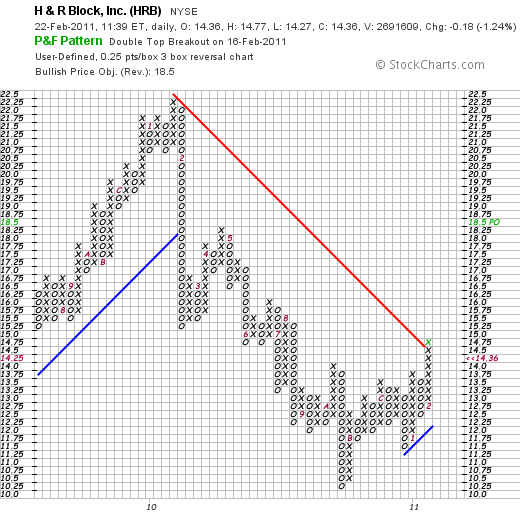
A 25-cent daily Point & Figure chart for HR Block ($HRB) captures price action all the way back to July 2009. These X's and O's show the stock moving lower throughout 2010 and firming towards yearend... Read More
Don't Ignore This Chart! February 18, 2011 at 03:09 PM
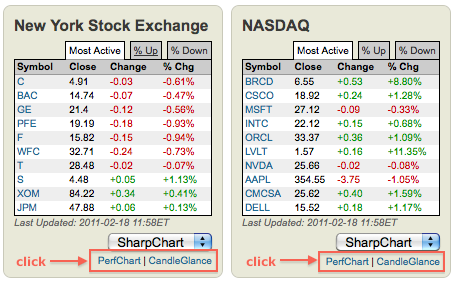
The NYSE and Nasdaq most active lists are displayed on the Free Charts page and updated throughout the day. Seven of the ten most active on the NYSE were down in early trading on Friday. Seven of ten were up on the Nasdaq... Read More
Don't Ignore This Chart! February 17, 2011 at 04:06 PM
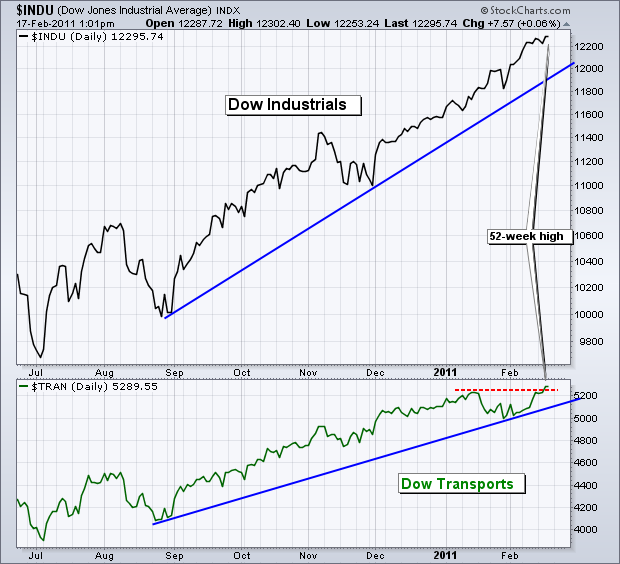
Dow Theory is built on the concept of confirmation. The Dow Transports should confirm a higher high in the Dow Industrials and visa versa. Failure to confirm signals that something might amiss... Read More
Don't Ignore This Chart! February 16, 2011 at 07:57 PM
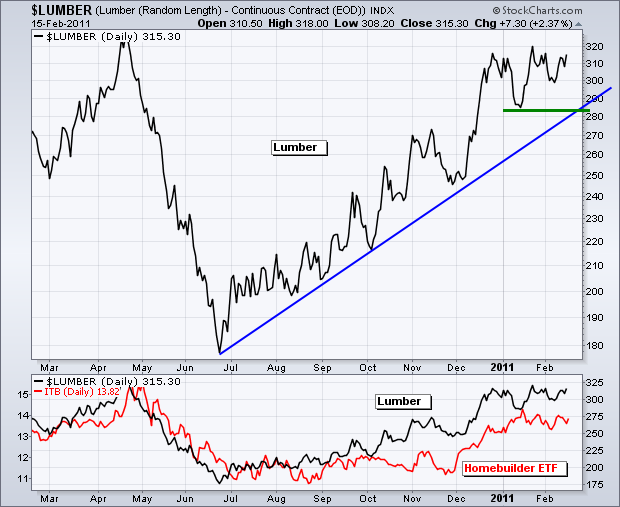
The Lumber Continuous Futures ($LUMBER) remains in a clear uptrend with a series of higher highs and higher lows since late June. This advance (roughly) corresponds with an advance in the Home Construction iShares (ITB)... Read More
Don't Ignore This Chart! February 15, 2011 at 02:12 PM
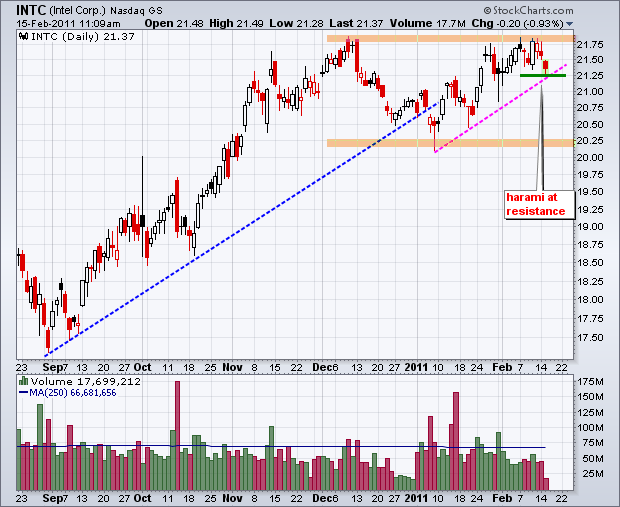
Intel is meeting some pretty stiff resistance around 22, but the overall trend remains up. The stock formed a big bearish engulfing in early December and a harami on Thursday-Friday... Read More
Don't Ignore This Chart! February 14, 2011 at 02:23 PM
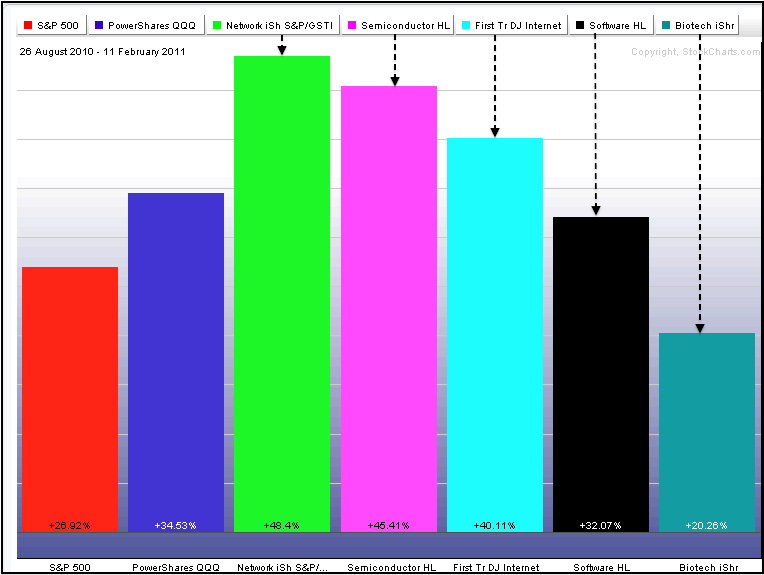
The PerfChart below shows five tech-relate ETFs along with the S&P 500 and the Nasdaq 100 ETF (QQQQ). All are up sharply since late August, but three are up more than 40%. The Networking iShares (IGN) is up some 48.4%, the Semiconductor HOLDRS (SMH) is up 45... Read More
Don't Ignore This Chart! February 11, 2011 at 10:43 AM
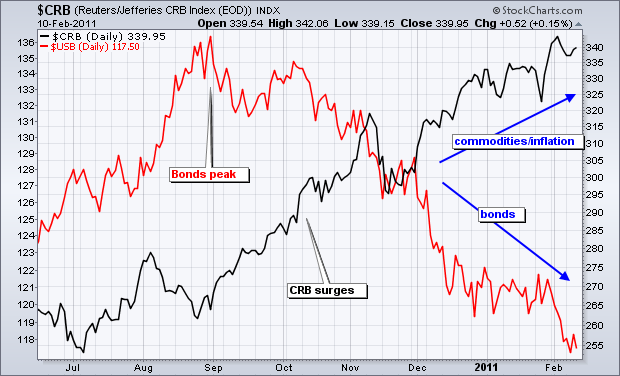
Something has clearly spooked the bond market over the last five months. Looking at the CRB Index, that something appears to be inflationary pressures. The CRB Index bottomed in early July and advanced over 30% the last seven months... Read More
Don't Ignore This Chart! February 10, 2011 at 05:34 PM
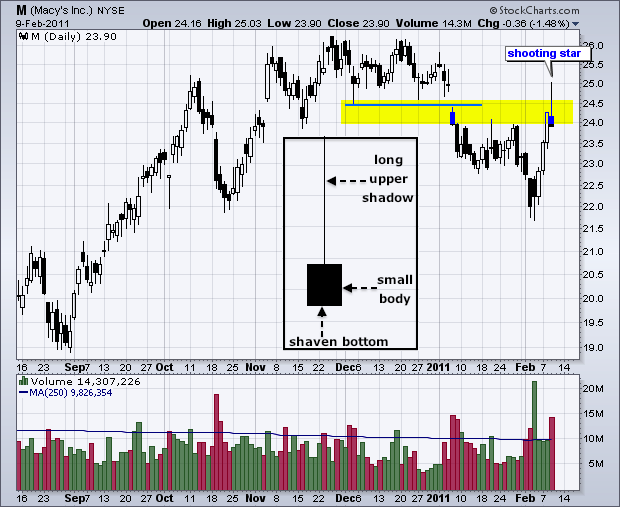
Macy's (M) was one of ten NYSE stocks showing up on the Shooting Star scan on the Predefined Scans page. After surging the prior three days, the stock hit resistance from broken support and formed a large shooting star on Wednesday... Read More
Don't Ignore This Chart! February 09, 2011 at 06:12 PM
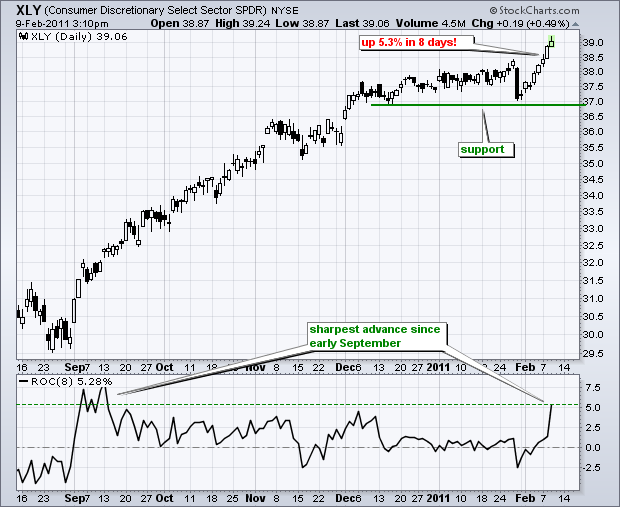
After taking a big hit at the end of January, the Consumer Discretionary SPDR (XLY) firmed and surged to a new 52-week high this month. The ETF is up seven of the last eight days with a 5.3% advance. This is the sharpest advance since early September... Read More
Don't Ignore This Chart! February 08, 2011 at 05:58 PM
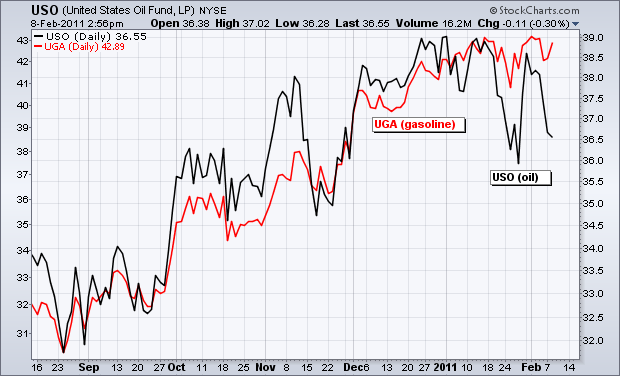
The USO Oil Fund (USO) and the US Gasoline Fund (UGA) normally track each other pretty well, but these two have gone their separate ways over the last four weeks. UGA (red) is up around 1% and USO (black) is down around 4% since January 11th. This is unlikely to last too long... Read More
Don't Ignore This Chart! February 07, 2011 at 07:59 PM
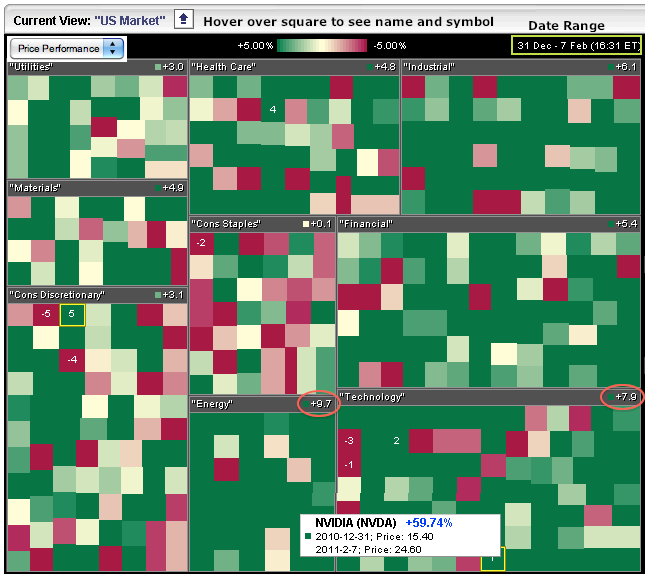
The S&P Sector Market Carpet provide a nice color-coded means to view performance over a given period of time. This chart shows performance since December 31st. All sectors are up, but there are rather significant pockets of weakness (red) within these sectors... Read More
Don't Ignore This Chart! February 04, 2011 at 03:50 PM
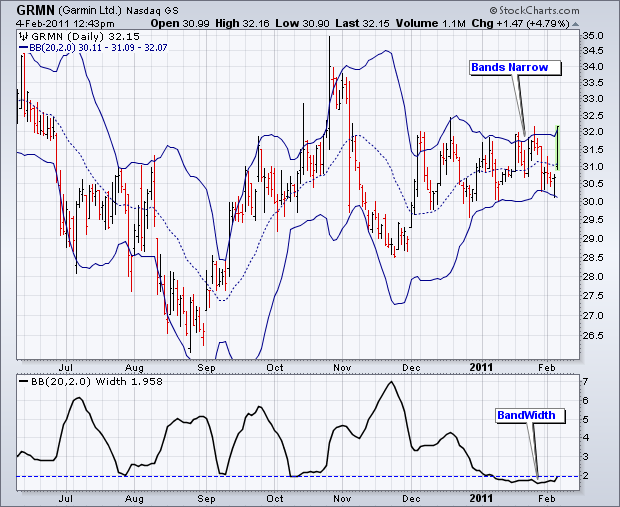
Bollinger Bands narrow as volatility falls and widen as volatility rises. The theory is that a volatility contraction is often followed by a volatility expansion. The directional clue depends on the break... Read More
Don't Ignore This Chart! February 03, 2011 at 04:49 AM
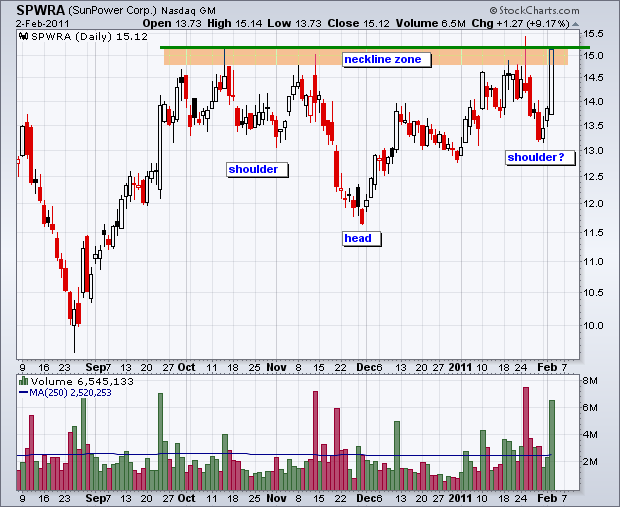
There are two types of head-and-shoulders patterns: reversal and continuation. A reversal pattern changes the trend, while A continuation pattern resumes the trend. SunPower surged in September and then consolidated with an inverse head-and-shoulders... Read More
Don't Ignore This Chart! February 02, 2011 at 12:51 PM
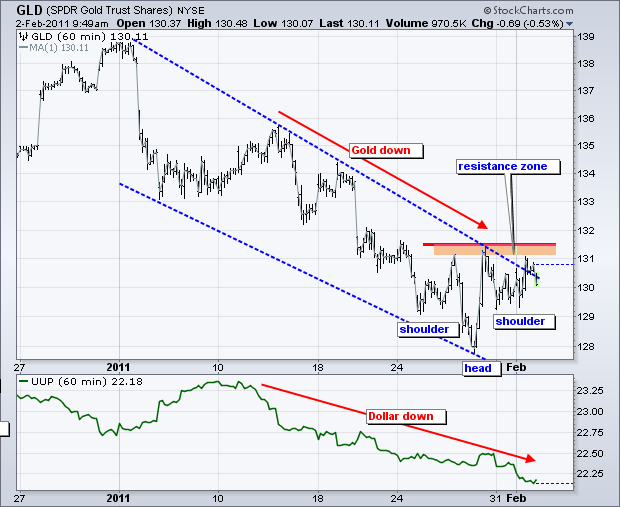
The Gold SPDR (GLD) remains in a clear downtrend, but a small inverse head-and-shoulders pattern is taking shape the last 10 days. Neckline resistance resides in the 131-131.5 area and a break above this level would reverse the 4-5 week slide... Read More
Don't Ignore This Chart! February 01, 2011 at 06:01 PM
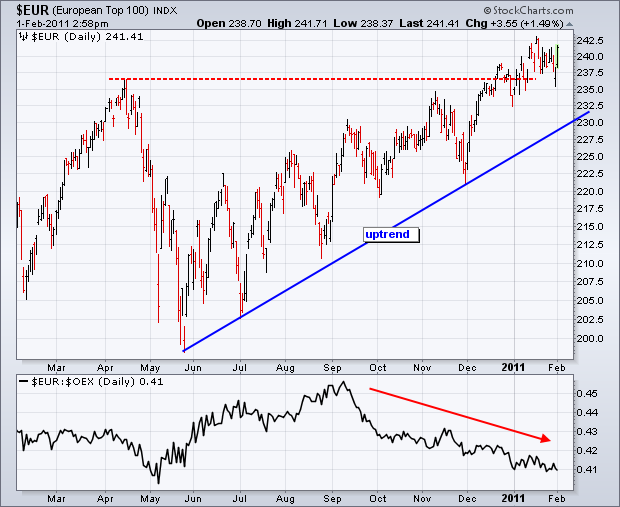
The Euro Top 100 Index ($EUR) may be underperforming the S&P 100, but the index is clearly in an uptrend. $EUR broke its April high in December and recorded a 52-week high in January. There is nothing but uptrend as long as the May trendline holds... Read More