Don't Ignore This Chart! December 30, 2011 at 03:23 PM
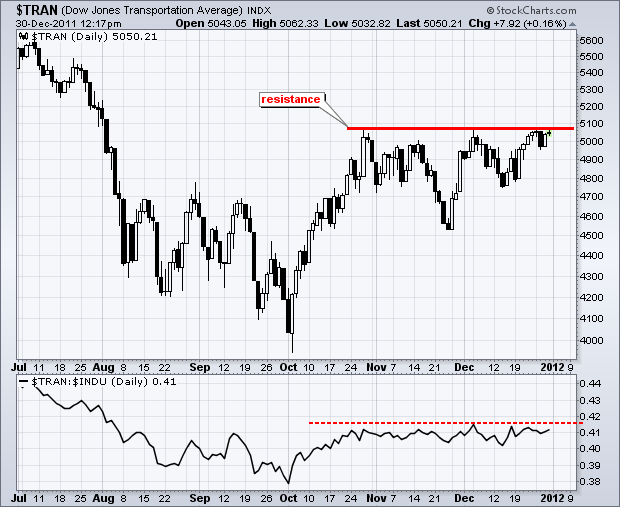
With a surge in late December, the Dow Transports is once again challenging resistance from the October highs. Notice that the Average failed at this level in early December. The Dow Industrials is also hitting resistance near the October high... Read More
Don't Ignore This Chart! December 29, 2011 at 01:56 PM
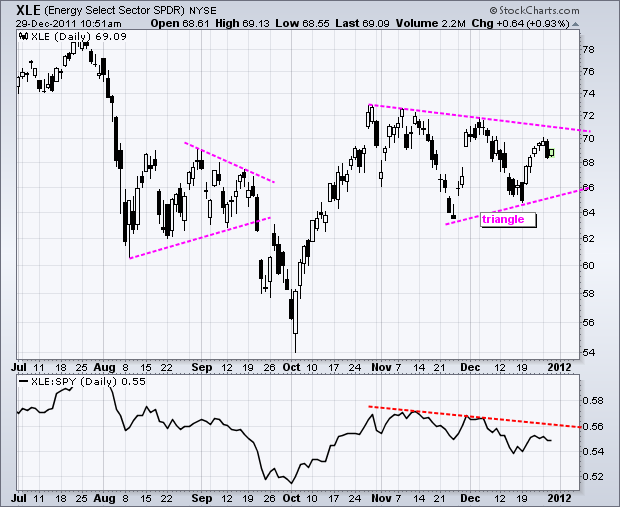
After surging in October, the Energy SPDR (XLE) moved into a sideways pattern with a lower high and a higher low. In short, the noose is tightening as a triangle consolidation takes shape... Read More
Don't Ignore This Chart! December 28, 2011 at 05:44 PM
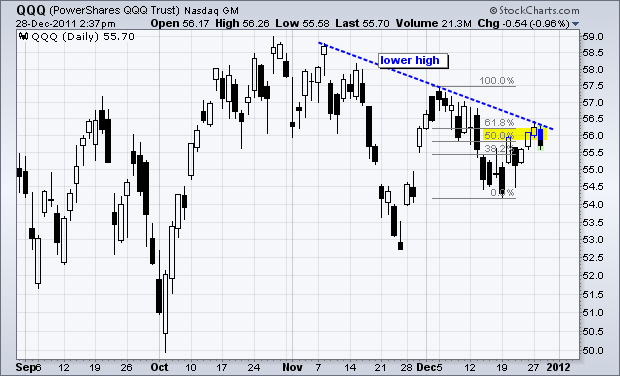
The Nasdaq 100 ETF (QQQ) is hitting resistance from the November trendline and a key retracement. Notice that the ETF turned back at the 62% retracement with Wednesday's decline. A lower high could be taking shape as buying pressure dries up below the early December high... Read More
Don't Ignore This Chart! December 27, 2011 at 03:00 AM
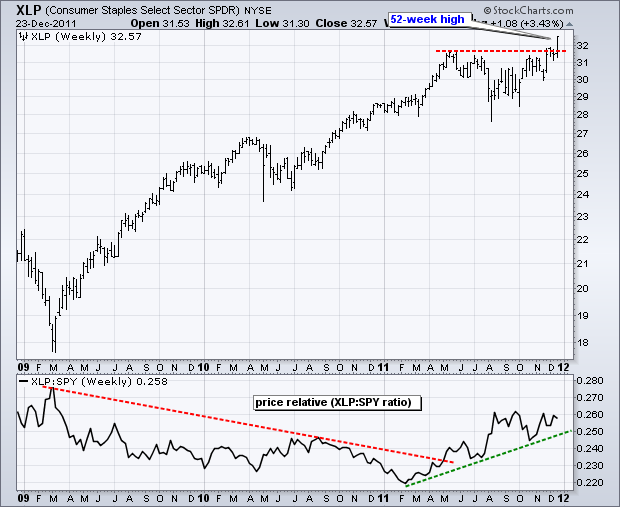
Of the nine sector SPDRs, only two hit new 52-week highs last week: the Consumer Staples SPDR (XLP) and the Utilities SPDR (XLU). These two defensive sectors are clearly leading the market right now... Read More
Don't Ignore This Chart! December 23, 2011 at 04:08 PM
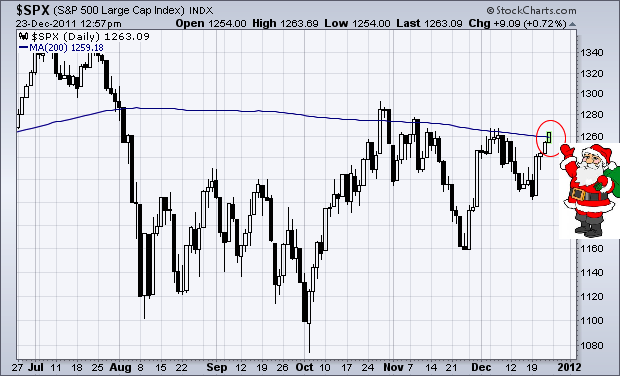
The Santa Clause rally continued into Friday with the S&P 500 clearing its 200-day moving average in the early afternoon. Prior attempts in early December failed as the index fell back before the close. Let's see if Santa can make good on this one... Read More
Don't Ignore This Chart! December 22, 2011 at 06:35 PM
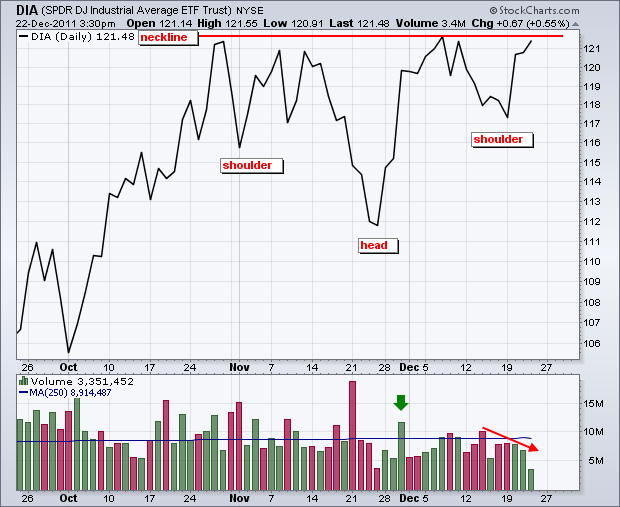
The Dow Industrials SPDR (DIA) is challenging resistance from an inverse Head-and-Shoulders pattern. After surging in October, the ETF consolidated for two months to set up the pattern. The late November low formed the head and neckline resistance is set just above 122... Read More
Don't Ignore This Chart! December 21, 2011 at 02:21 PM
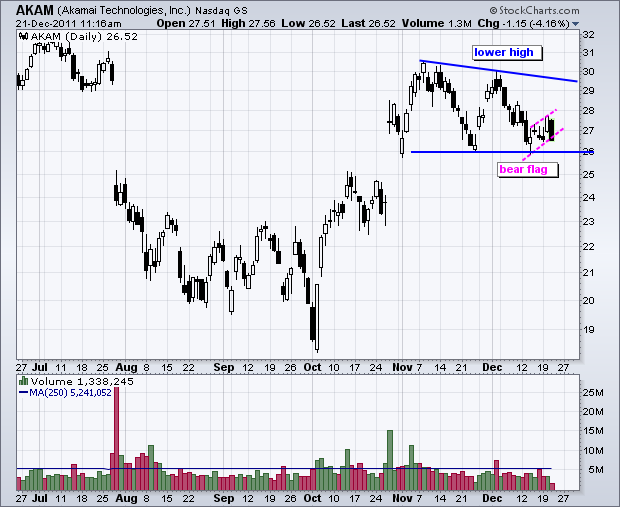
There are two bearish patterns at work with Akamai (AKAM). First, a lower high formed in early December and a descending triangle is taking shape. A move below 26 would confirm this pattern... Read More
Don't Ignore This Chart! December 20, 2011 at 04:04 PM
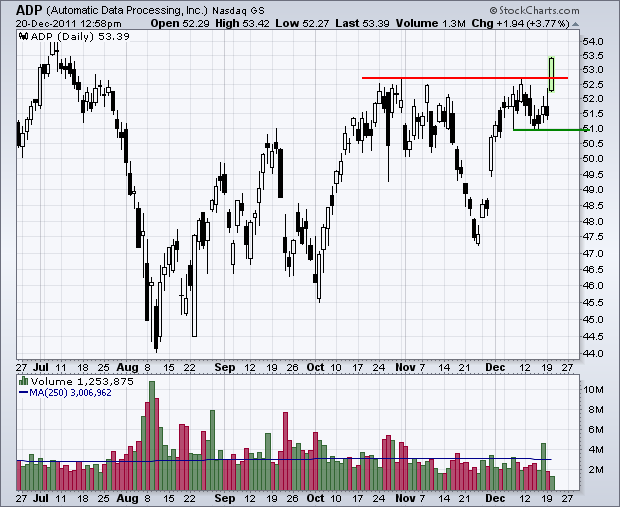
Automatic Data Processing (ADP) may have an antiquated name, but the stock has outperformed Apple (AAPL) since mid September. On the chart below, ADP broke resistance from the October-November highs with a big move... Read More
Don't Ignore This Chart! December 19, 2011 at 08:27 PM
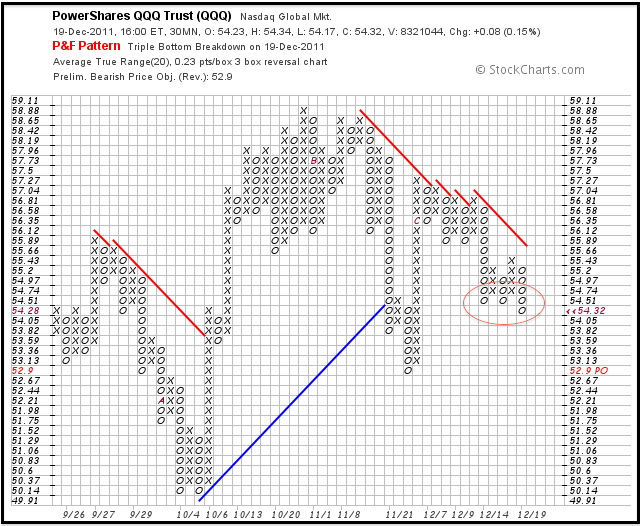
The Nasdaq 100 ETF (QQQ) broke below the prior two O-Columns to forge a triple bottom breakdown on the 30min PnF chart. This bearish signal suggests that the ETF is going lower with a downside price objective around 52.90. This can be see at the top of the chart... Read More
Don't Ignore This Chart! December 16, 2011 at 04:16 PM
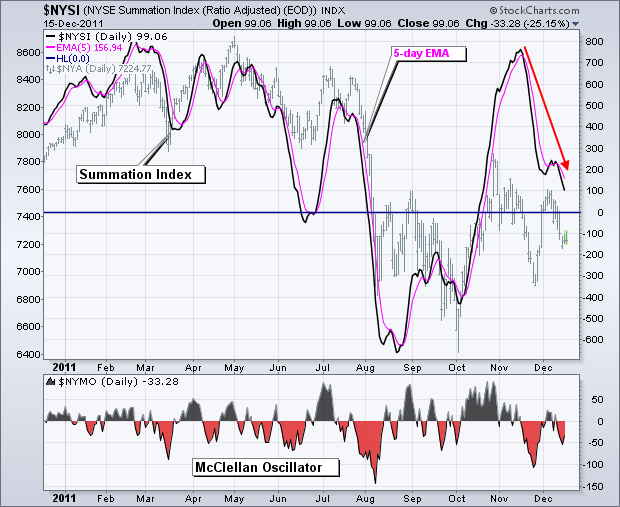
With a downturn in the stock market this week, the NYSE Summation Index ($NYSI) turned back down and broke below its 5-day EMA. This shows that breadth is deteriorating once again. The McClellan Oscillator also turned negative... Read More
Don't Ignore This Chart! December 14, 2011 at 07:10 PM
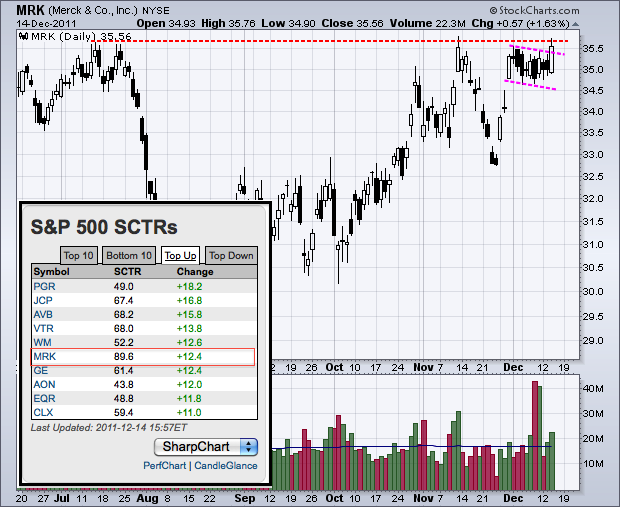
Top ten lists for the StockCharts Technical Rank (SCTR) can now be found on the home page (scroll down). Merck (MRK) stands out from the list of stocks with the biggest SCTR change. The SCTR jumped 12.4 as the stock broke flag resistance and challenged its 2011 highs... Read More
Don't Ignore This Chart! December 13, 2011 at 05:45 PM
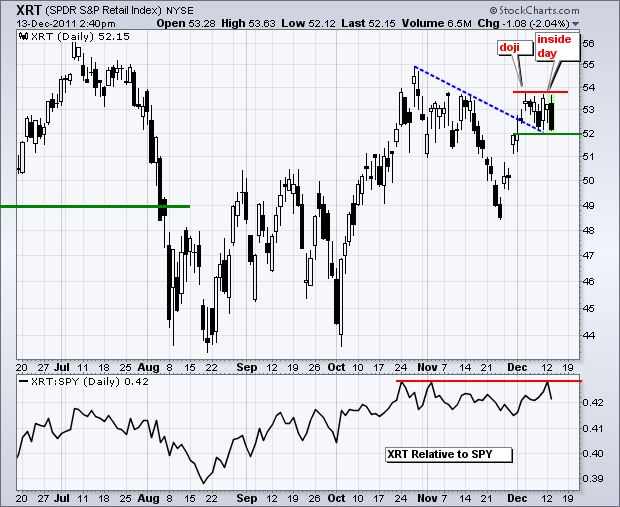
The Retail SPDR (XRT) is under pressure today after a miss from Best Buy (BBY) and a lackluster Retail Sales report. XRT broke trendline resistance in early December and then consolidated. This breakout is holding, but barely... Read More
Don't Ignore This Chart! December 12, 2011 at 02:17 PM
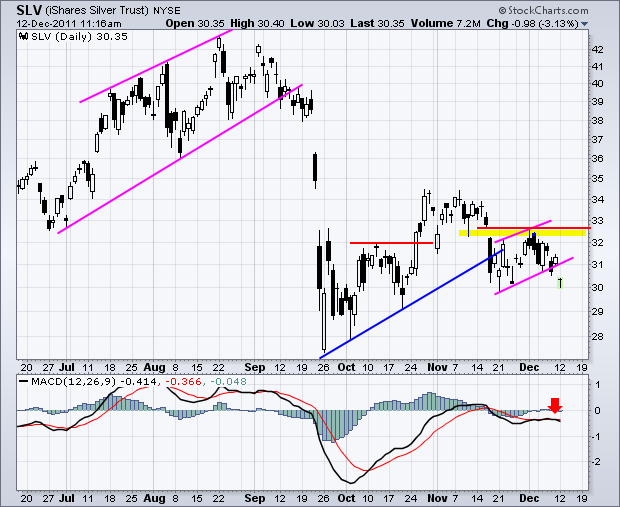
Weakness in precious and industrial metals weighed on silver as the Silver Trust (SLV) broke flag support with a sharp decline Monday. This break signals a continuation of the breakdown from mid November. MACD moved below its signal line to turn momentum bearish... Read More
Don't Ignore This Chart! December 09, 2011 at 09:22 AM
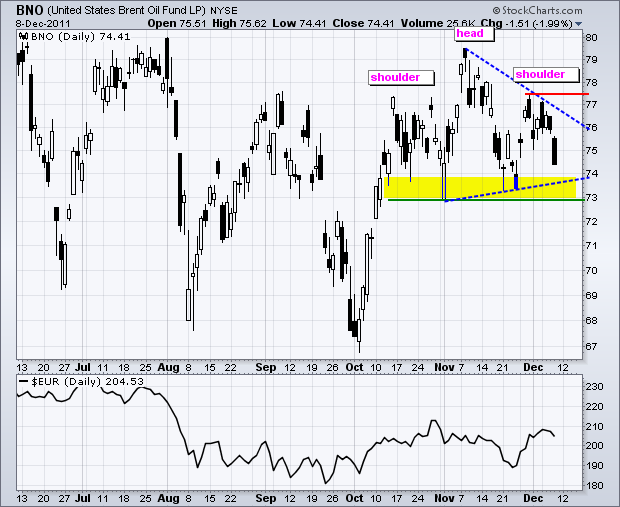
The Brent Crude ETF (BNO) hit resistance from the summer highs and formed a small Head-and-Shoulders pattern over the last two months. Neckline support is set at 73, a break of which would confirm the pattern... Read More
Don't Ignore This Chart! December 08, 2011 at 05:43 PM
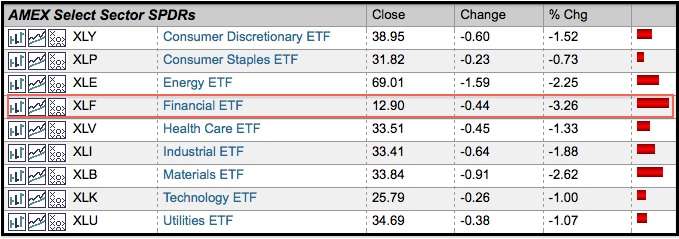
Once again, it is the finance sector feeling the heat from across the pond. This screenshot from the market summary page shows the nine sectors, and all are in the red. In afternoon trading on Thursday, XLF is the only one with a loss greater than 3%... Read More
Don't Ignore This Chart! December 07, 2011 at 08:08 PM
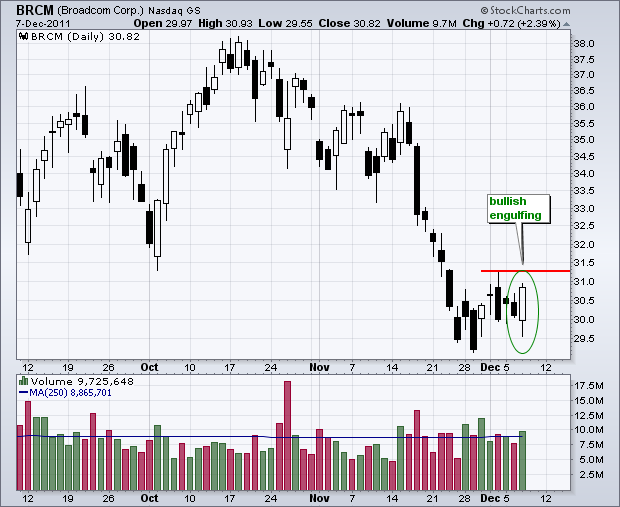
Broadcom (BRCM) came across the bullish engulfing scan on Wednesday. After becoming oversold with a sharp decline in November, the stock firmed the last two weeks and formed a bullish engulfing on Wednesday. This white candlestick completely engulfed the prior black candlestick... Read More
Don't Ignore This Chart! December 05, 2011 at 05:44 PM
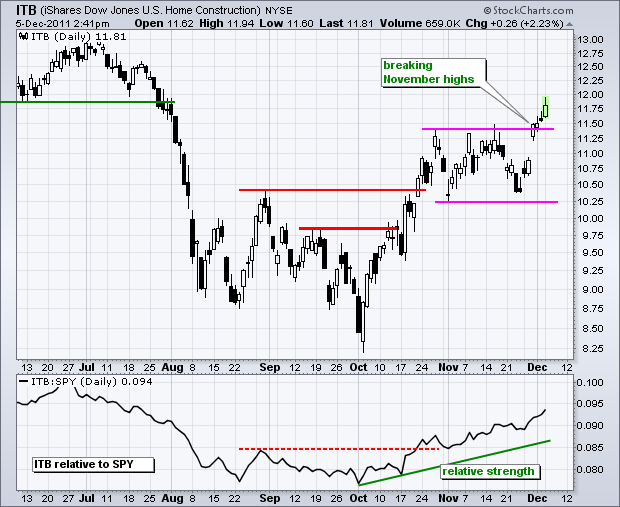
The Home Construction iShares (ITB) is one of the strongest industry group ETFs in the market right now. The chart below shows ITB breaking above its mid-November high with a surge the last few days... Read More
Don't Ignore This Chart! December 02, 2011 at 02:38 PM
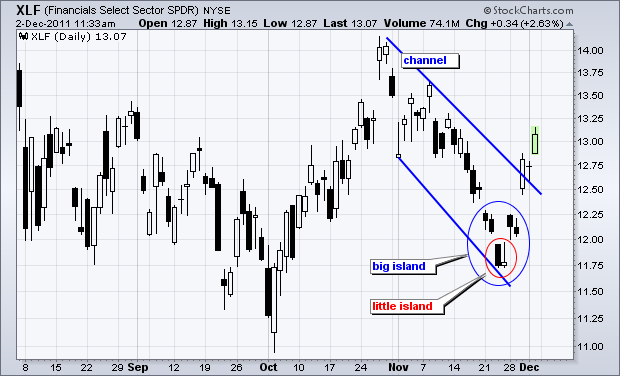
With a gap up on Monday and another on Wednesday, the Finance SPDR (XLF) formed two island reversals over the last three weeks. The first island formed on Friday-Monday (red circle). The second island formed from 21 to 29 November (blue oval)... Read More
Don't Ignore This Chart! December 01, 2011 at 02:51 PM
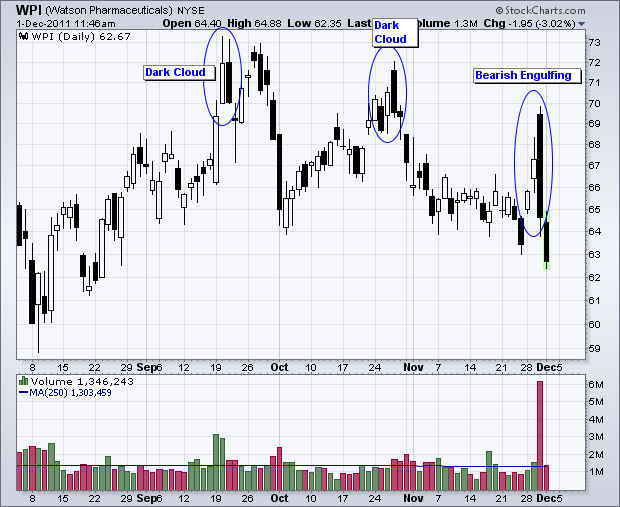
Even though the market moved sharply higher on Wednesday, Watson Pharma could not hold its early gain and closed weak. Wednesday's black/filled candlestick completely engulfed the prior white/hollow candlestick to form a bearish engulfing. Also notice that volume surged... Read More
Don't Ignore This Chart! November 30, 2011 at 07:56 PM
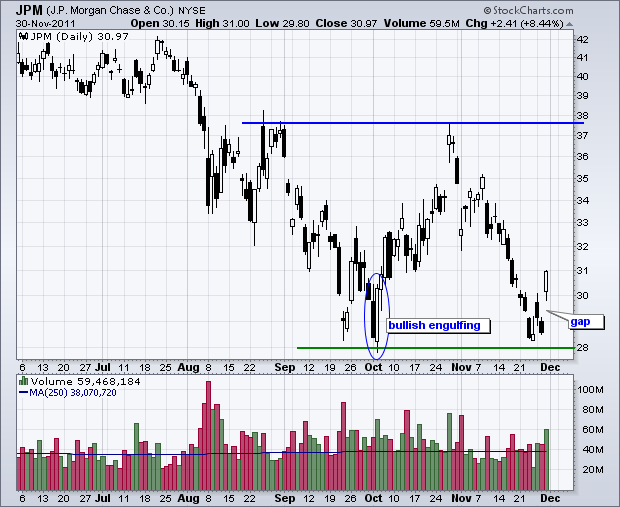
As one of the big money-center banks, JP Morgan (JPM) clearly benefited from the coordinated central bank action on Wednesday. The chart below shows JPM bouncing off support with a big gap on big volume. JPM closed near the high of the day. The gap is bullish as long as it holds... Read More