Don't Ignore This Chart! June 29, 2012 at 06:13 PM
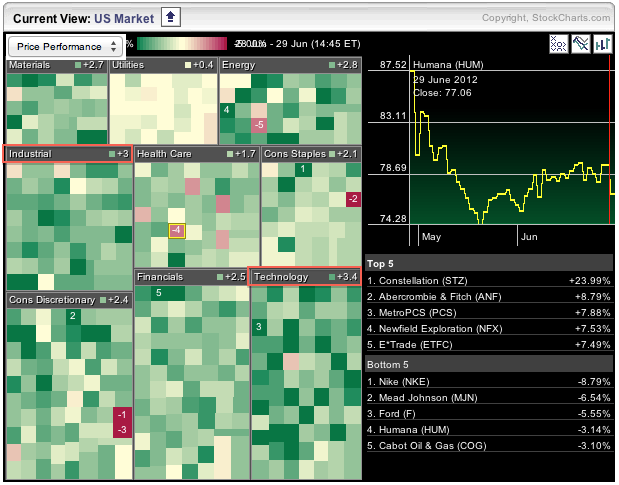
The S&P Sector Carpet is full of green on Friday with the darkest green showing up in the technology and industrials sectors. The average gain in the tech sector is 3.4%, while the average gain in the industrial sector is 3%... Read More
Don't Ignore This Chart! June 27, 2012 at 11:26 AM
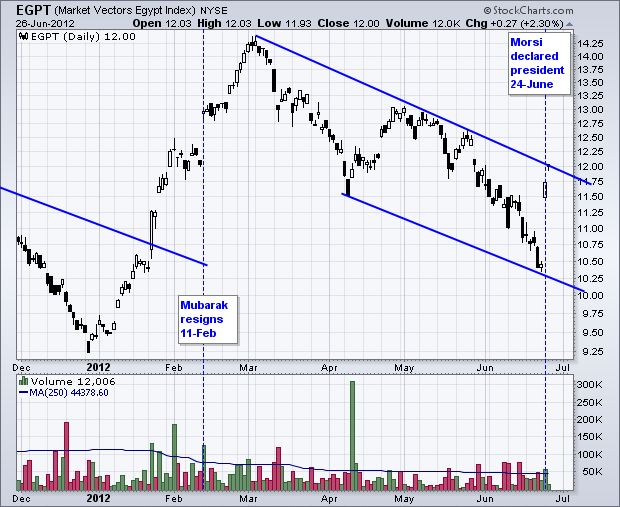
The Egypt Index ETF (EGPT) surged in the lead up to Hosni Mubarak's resignation and then declined as democratic elections were called. The decline ended when uncertainty became certainty and Mohammed Morsi was declared president on 24-June... Read More
Don't Ignore This Chart! June 26, 2012 at 01:58 PM
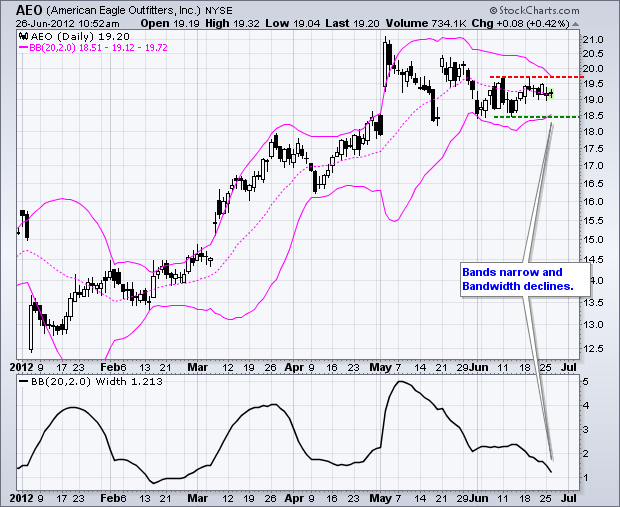
American Eagle Outfitters (AEO) has been stuck in a consolidation since early May. Moreover, notice that this consolidation is narrowing as the Bollinger Bands contract... Read More
Don't Ignore This Chart! June 25, 2012 at 07:02 PM
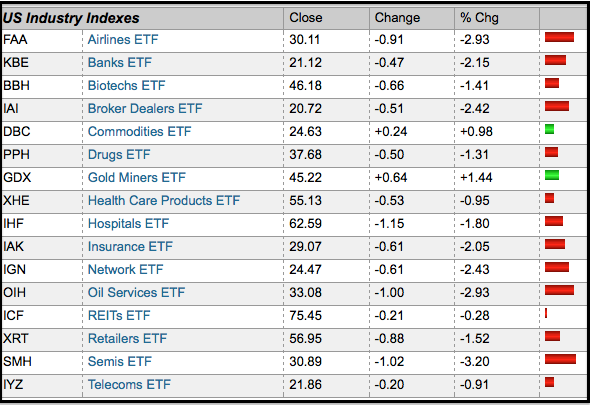
Stocks were down sharply on Monday, but there were a two pockets of strength. The image below was taken from the ETF market summary. Notice that the Commodity Index Fund (DBC) and the Gold Miners ETF (GDX) are positive for the day... Read More
Don't Ignore This Chart! June 22, 2012 at 09:06 AM
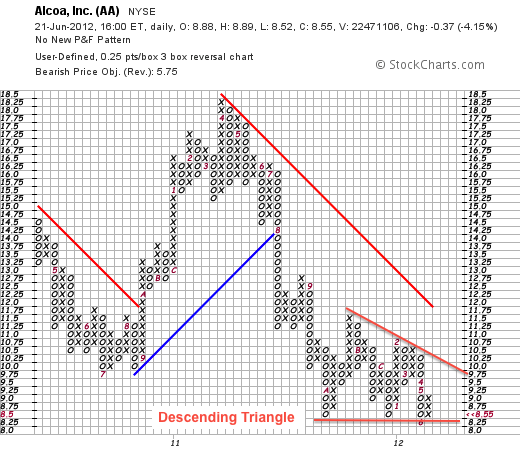
Alcoa (AA) is part of the Basic Materials SPDR (XLB) and in a clear downtrend. On the P&F chart (3 x .25), the stock broke to new lows in 2011 and then formed a descending triangle the last nine months. The red A marks October 2011 and the red 6 marks June 2012... Read More
Don't Ignore This Chart! June 21, 2012 at 02:27 PM
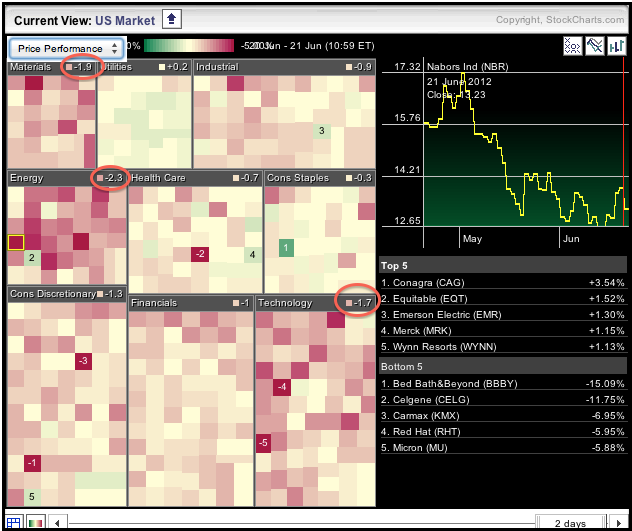
The image below comes from the Sector Carpet. First, notice that all sectors are lower. Second, notice that the Basic Materials SPDR (XLB), Energy SPDR (XLE) and Technology SPDR (XLK) have the most red. The Consumer Discretionary SPDR (XLY) is not far behind... Read More
Don't Ignore This Chart! June 20, 2012 at 07:02 PM
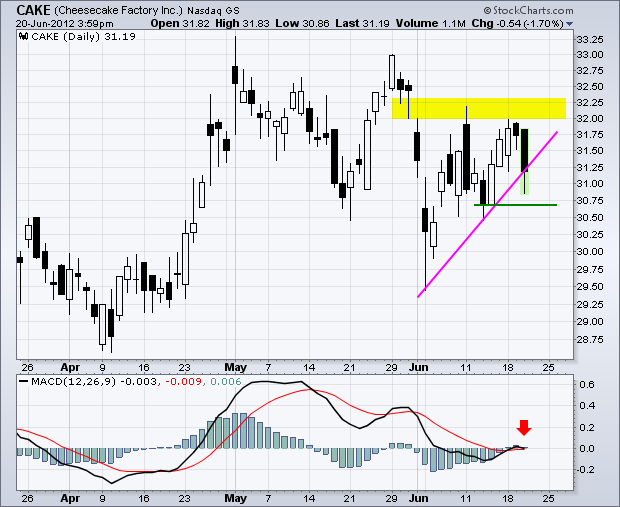
Cheesecake Factory (CAKE) moved sharply lower at the beginning of June and then rebounded with the market the last few weeks. This rebound, however, is running into resistance from the gap and prior high... Read More
Don't Ignore This Chart! June 19, 2012 at 02:43 PM
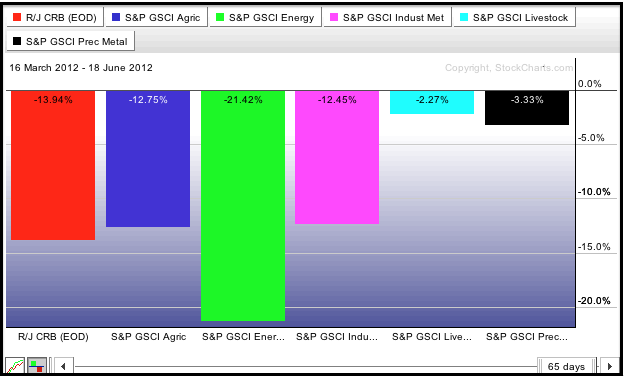
The PerfChart below shows the three month performance for five commodity indices and the CRB Index ($CRB). All five are down and $CRB is down around 14%. Blame it on energy, which is down over 21%. Precious metals have held up relatively well with a decline less than 4%... Read More
Don't Ignore This Chart! June 18, 2012 at 07:38 PM
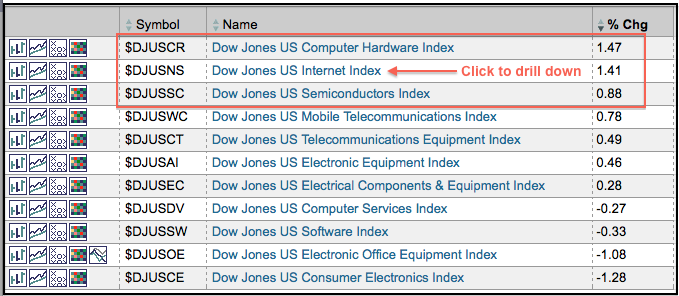
The image below, which stems from the sector summary at StockCharts.com, shows the key industry groups within technology sector. On Monday, computer hardware, internet and semiconductors were leading the way higher... Read More
Don't Ignore This Chart! June 15, 2012 at 10:01 AM
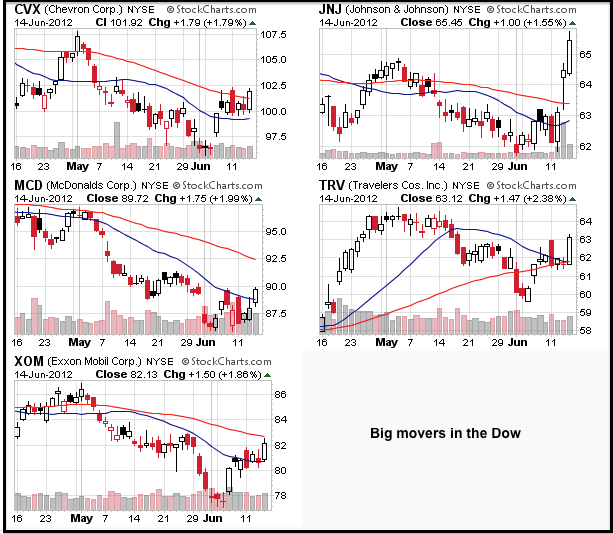
The Dow surged over 150 points on Thursday and broke above its May high. With only 30 stocks, chartists can use the CandleGlance feature at StockCharts.com to find which stocks led the move... Read More
Don't Ignore This Chart! June 14, 2012 at 02:49 PM
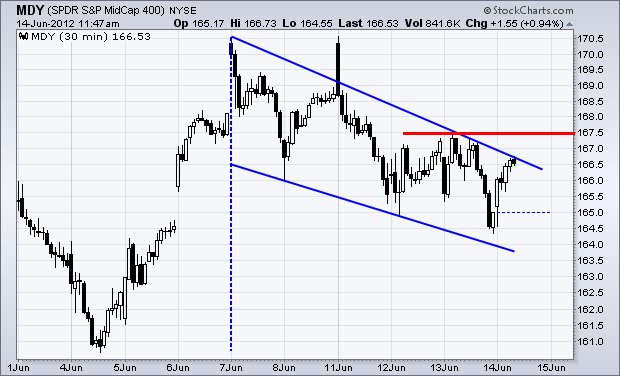
There is a real gut check underway in the stock market. The S&P MidCap 400 SPDR (MDY) surged last week and then corrected the last 5-6 days with a falling flag/wedge... Read More
Don't Ignore This Chart! June 12, 2012 at 03:03 PM
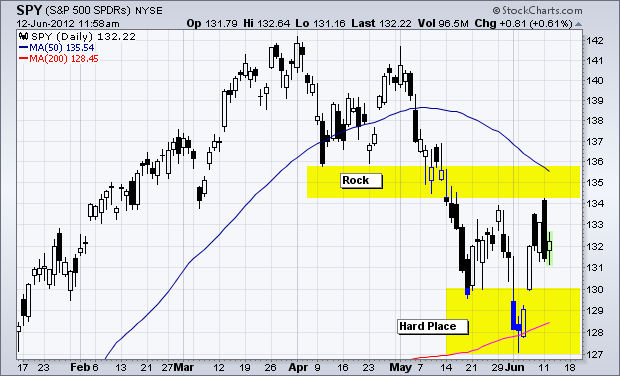
No wonder the S&P 500 ETF (SPY) cannot make up its mind on direction. The ETF broke key support in mid May and the 50-day moving average turned lower. Combined with Monday's high, these no mark the rock or resistance zone... Read More
Don't Ignore This Chart! June 11, 2012 at 07:53 PM
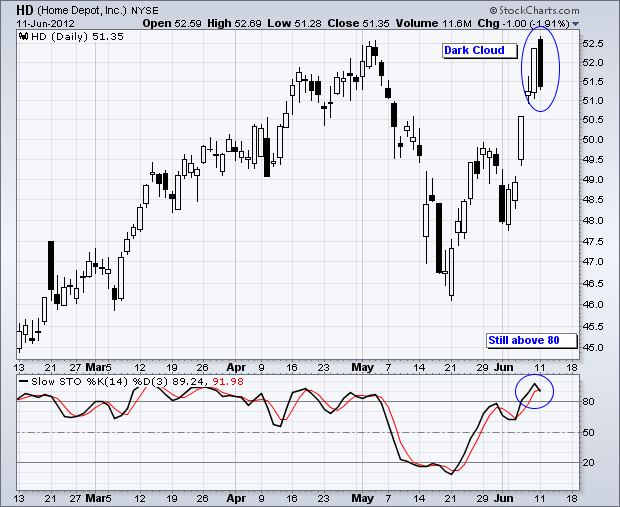
With a strong open and weak close on Monday, hundreds of stocks and ETFs formed either dark cloud patterns or bearish engulfing patterns. The chart below shows Home Depot (HD) forming a dark cloud near resistance and with the Stochastic Oscillator overbought... Read More
Don't Ignore This Chart! June 08, 2012 at 11:16 AM
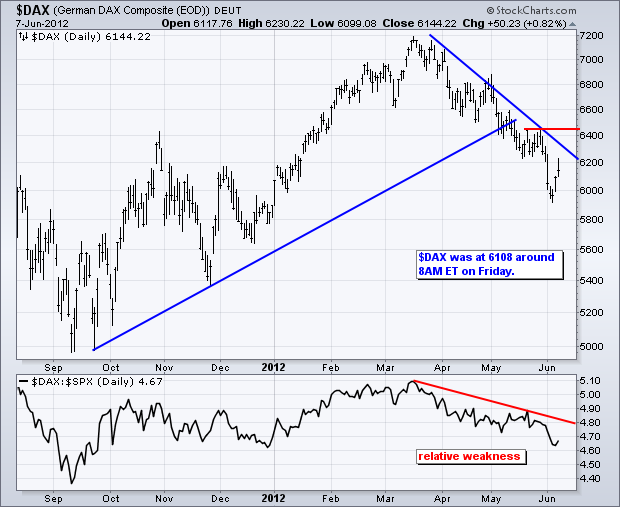
The German DAX Index peaked around 7200 in mid March and moved below 6000 in early June. That's over 15% in less than three months. Despite looking oversold, there are no signs of a reversl as the index remains below its late May high... Read More
Don't Ignore This Chart! June 07, 2012 at 02:48 PM
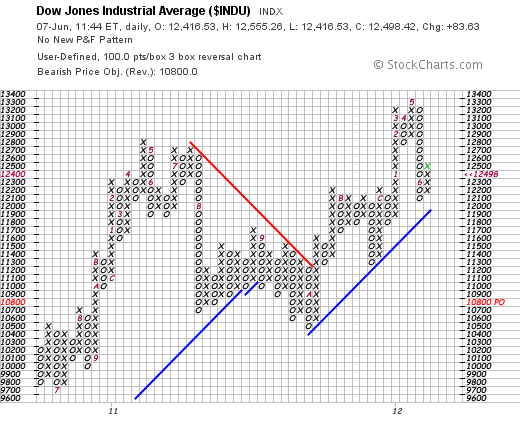
Despite a sharp decline in May-June, the Dow Industrials remains above the Bullish Support Line extending up from the October low. The red "A" marks the October column. This line sets support right at 12000... Read More
Don't Ignore This Chart! June 06, 2012 at 05:57 PM
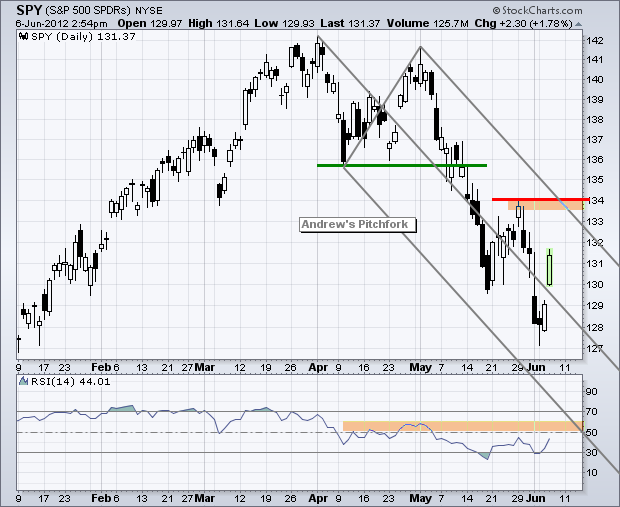
SPY is getting a nice oversold bounce with a gap up and Andrews' Pitchfork marks resistance in the 133 area. The pitchfork traces out a falling channel extending down from the April-May highs and the upper line crosses the 133 level next week... Read More
Don't Ignore This Chart! June 05, 2012 at 07:19 PM
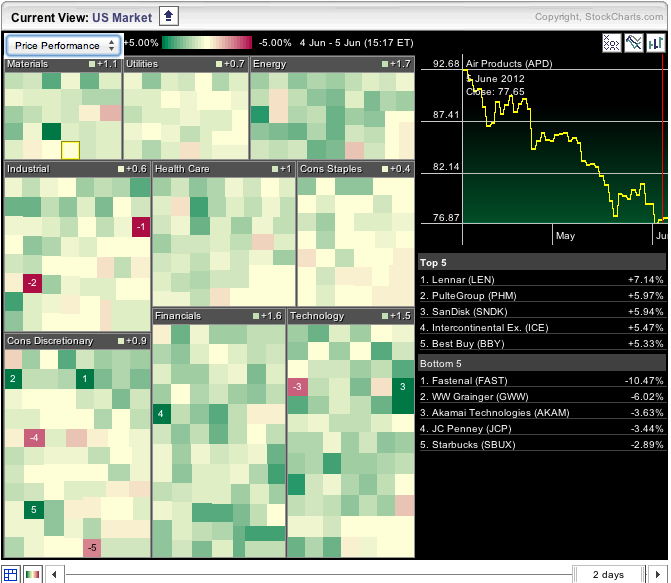
Stocks are rebounded on Tuesday with homebuilders leading the way. The S&P Sector Carpet shows the Lennar (LEN) and Pulte (PHM) leading within the consumer discretionary sector. On the price charts, PHM is bounced off its April low and LEN formed a bullish engulfing pattern... Read More
Don't Ignore This Chart! June 04, 2012 at 06:11 PM
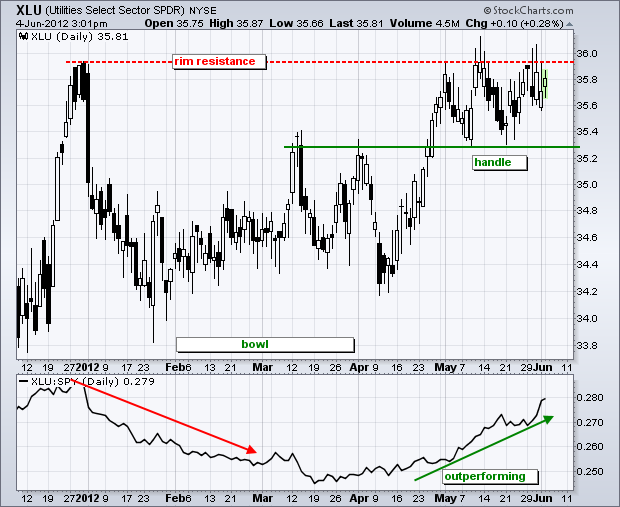
The Utilities SPDR (XLU) is virtually alone at the top as it trades near a 52-week high. A bullish cup-with-handle is taking shape and a break above resistance would signal a continuation higher... Read More
Don't Ignore This Chart! June 01, 2012 at 10:00 AM
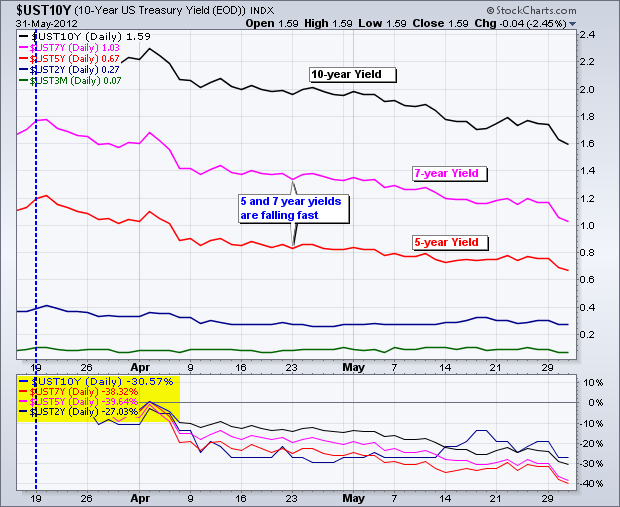
The chart below shows five different treasuries yields. Notice that five and seven year yields are falling the fastest as money moves into medium-term treasuries... Read More