Don't Ignore This Chart! August 31, 2012 at 11:06 AM
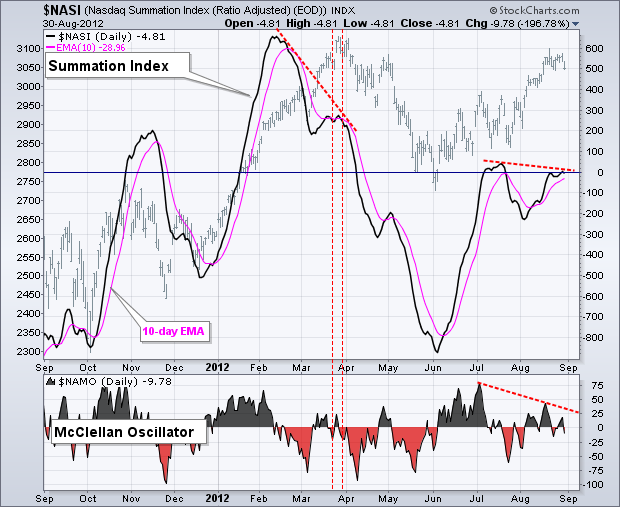
The Nasdaq Summation Index ($NASI) rebounded in July and then hit resistance near the zero line in July-August. The indicator is still moving higher because it is above its 10-day EMA. A break below this EMA would signal a downturn and be bearish for Nasdaq breadth... Read More
Don't Ignore This Chart! August 30, 2012 at 08:22 PM
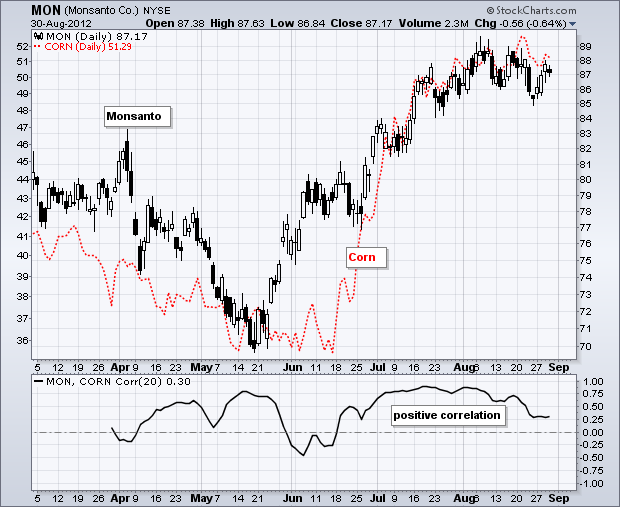
The chart below shows Monsanto (MON) with black candlesticks and the Corn ETF ($CORN) as a red dashed line. Notice how these two fell together in April and early May, and then surged together in June and July... Read More
Don't Ignore This Chart! August 29, 2012 at 12:01 PM
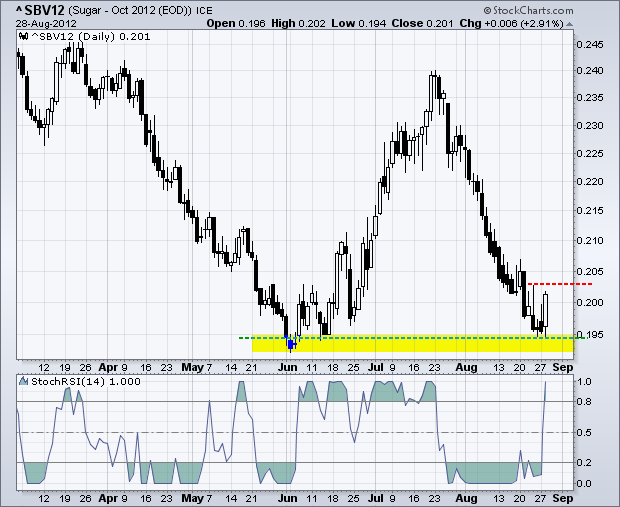
October Sugar fell sharply the last five weeks, but found support near the June lows and surged on Tuesday. The indicator window shows StochRSI moving below .20 it late July and remaining below .50 as the downtrend extended into late August. The surge above ... Read More
Don't Ignore This Chart! August 28, 2012 at 04:28 PM
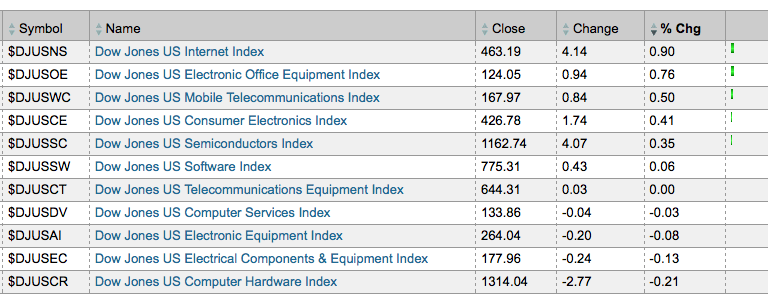
Browsing through the technology sector via the sector summary reveals relative strength coming from the internet ($DJUSNS) and electronic office equipment ($DJUSOE) groups. Baidu (BIDU) is up for internet and Xerox (XRX) is leading office equipment... Read More
Don't Ignore This Chart! August 27, 2012 at 05:40 PM
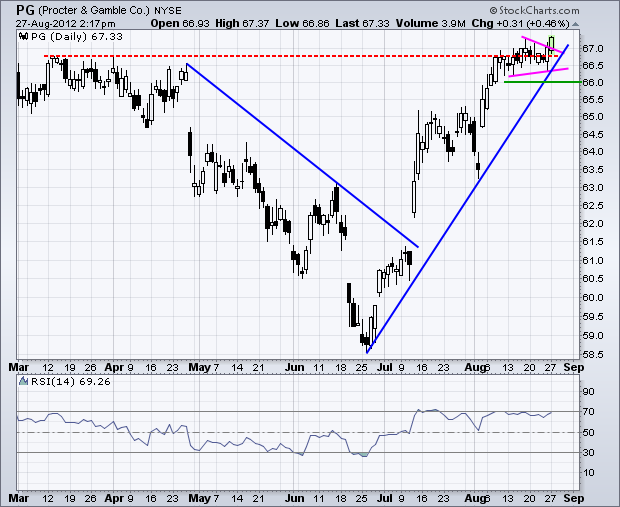
Procter & Gamble (PG), the biggest component in the Consumer Staples SPDR (XLP), surged above pennant resistance and recorded a 52-week high on Monday... Read More
Don't Ignore This Chart! August 24, 2012 at 10:24 AM
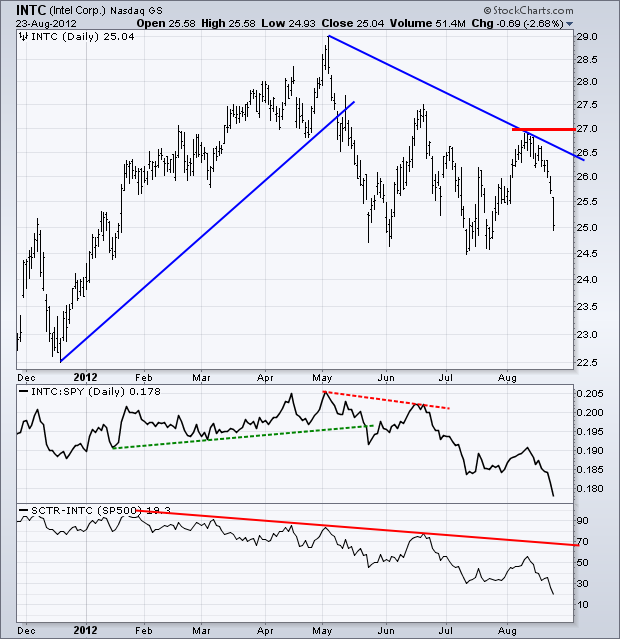
Index was hit hard over the last three days and is poised to test its May-June-July lows. The price relative and SCTR were hit even harder as both broke below their July lows. These two confirm relative weakness in this key semiconductor stock. With an SCTR score of 19... Read More
Don't Ignore This Chart! August 23, 2012 at 02:14 PM
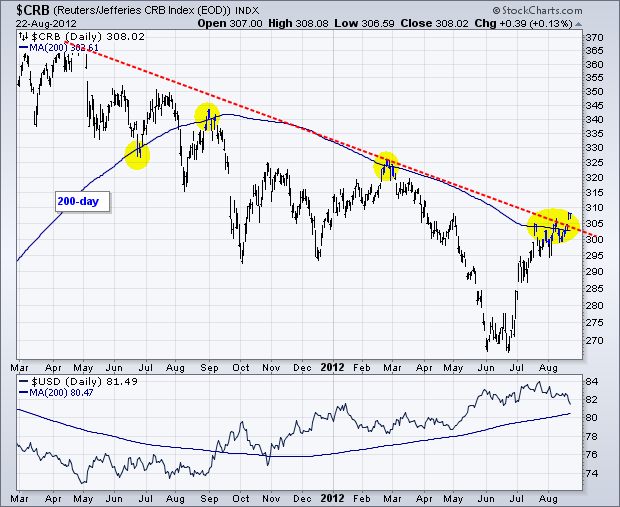
The CRB Index ($CRB) is breaking above its 200-day moving average after two failed attempts. Since first breaking below the 200-day in August 2011, this level marked resistance in early September and late February... Read More
Don't Ignore This Chart! August 22, 2012 at 07:07 PM
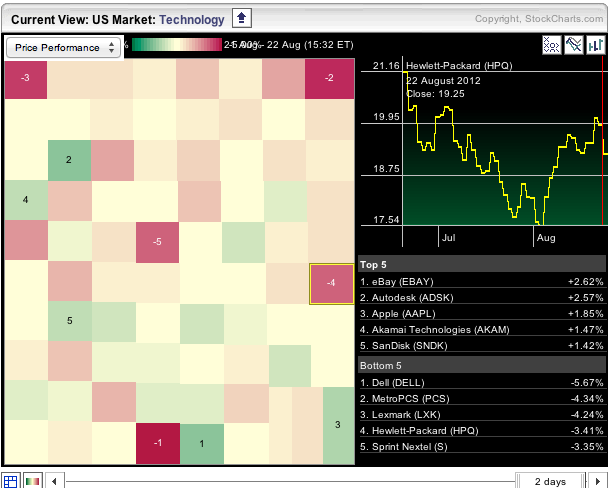
The S&P Sector Carpet is tilting towards the red (decliners) as Dell, Hewlett Packard and Lexmark weigh. Some of this weakness is being offset by strength in Ebay, Apple and Sandisk. Chartists can click on the squares to see the individual chart in the right corner... Read More
Don't Ignore This Chart! August 22, 2012 at 05:16 PM
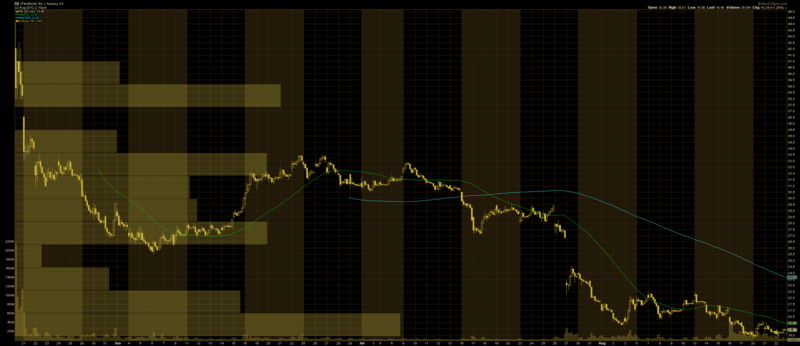
These things are proving popular. Here's Facebook in all of its 2500-pixel glory. Hourly bars going back to the IPO with "Volume by Price" histogram bars coming in from the left edge. Remember to click the chart twice to see the full-size version... Read More
Don't Ignore This Chart! August 21, 2012 at 06:04 PM
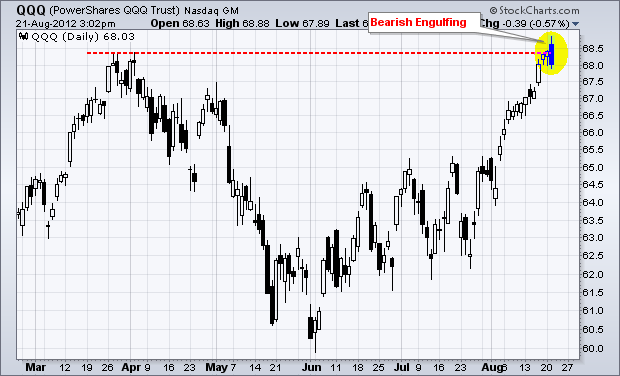
With a strong open and sharp decline during the day, the Nasdaq 100 ETF (QQQ) has a bearish engulfing pattern working on Tuesday. In fact, the intraday scan for bearish engulfing patterns is quite full (165) an hour before the close... Read More
Don't Ignore This Chart! August 20, 2012 at 10:47 PM
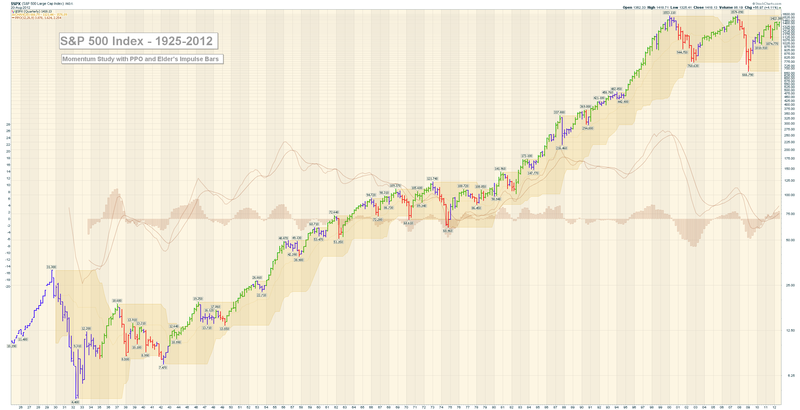
Let's do this again shall we? To compliment our popular huge Dow Industrials chart, here's a similar one for the S&P 500 going all the way back to 1925. Enjoy! (Again, you may need to click on it once or twice to see it full-sized... Read More
Don't Ignore This Chart! August 20, 2012 at 06:24 PM
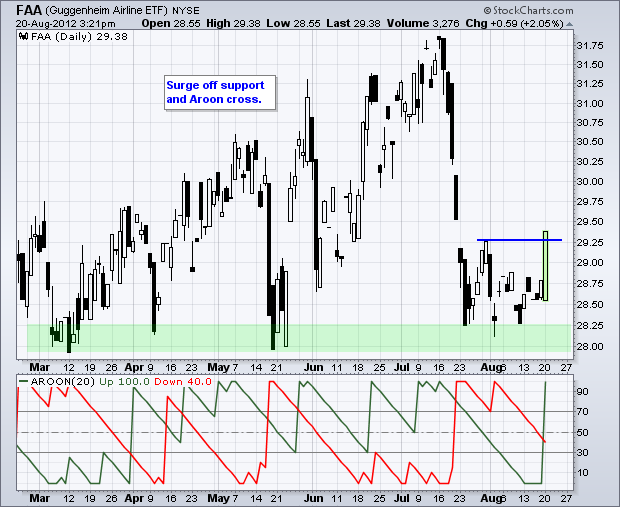
The on-again off-again Airline ETF (FAA) surged off support with a big move on Monday. After plunging in mid July, the ETF found support and then moved above its late July high. Also notice that Aroon Up surged above Aroon Down. You can read more on Aroon in our ChartSchool... Read More
Don't Ignore This Chart! August 20, 2012 at 12:34 PM
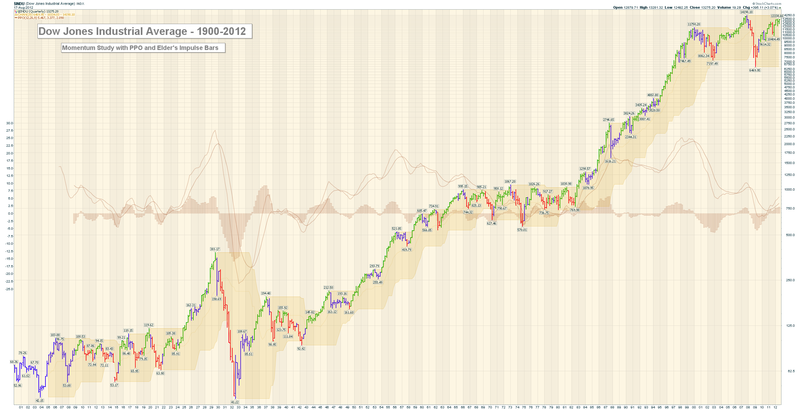
Here's a quarterly chart of the Dow going back to 1900. It's 2500 pixels wide. You probably need to click on it once or twice to get it to expand to that size on your screen. Members of our new PRO service can click here for a live version... Read More
Don't Ignore This Chart! August 17, 2012 at 11:18 AM
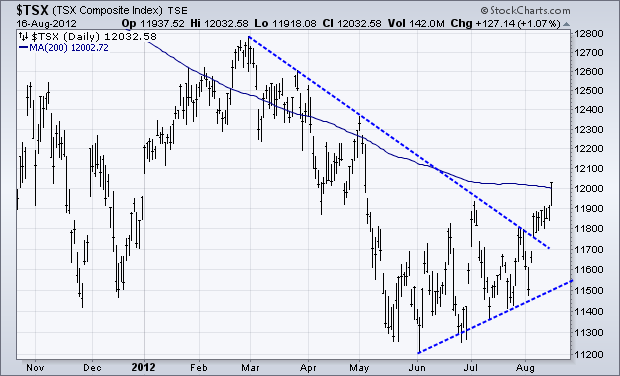
The TSX Composite ($TSX) is a little late to the party, but the index found some gas this week and surged above its 200-day moving average for the first time since early May. The index also broke the March trend line and exceeded its early July high... Read More
Don't Ignore This Chart! August 16, 2012 at 01:20 PM
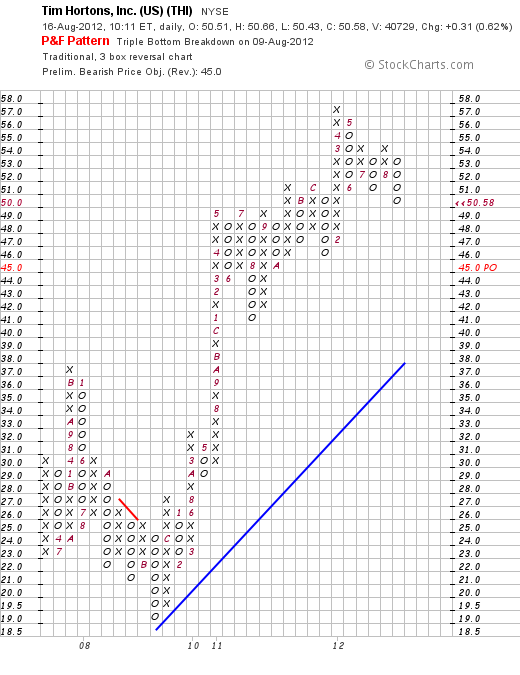
Even though Tim Horton's remains in an uptrend since 2009 and above the Bullish Support Line, it recently broke triple bottom support and triggered a bearish signal on the Point & Figure chart. This breakdown points to further weakness with a price objective (PO) around 45... Read More
Don't Ignore This Chart! August 15, 2012 at 12:30 PM
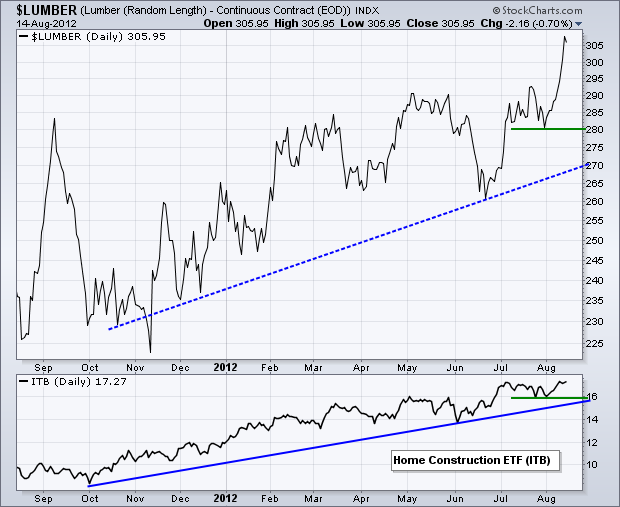
Even though the match is not perfect, there is clearly a positive relationship between Lumber Futures ($LUMBER) and the Home Construction iShares (ITB). Notice that both have been trending higher since November 2011 and both recently recorded new highs... Read More
Don't Ignore This Chart! August 14, 2012 at 01:07 PM
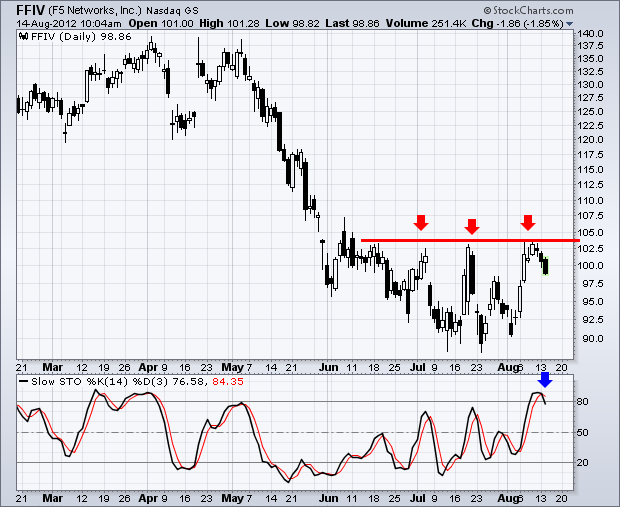
F5 Networks (FFIV) surged to resistance in early August and then pulled back the last two days. Notice how the stock hit resistance in the 104 area twice in July and now once in August... Read More
Don't Ignore This Chart! August 13, 2012 at 08:45 AM
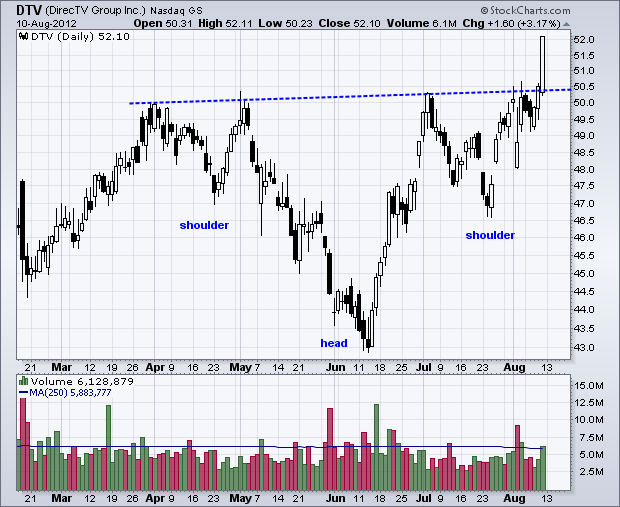
Direst TV (DVT) formed an inverse head-and-shoulders pattern from April to August and broke resistance with a strong surge the last three days... Read More
Don't Ignore This Chart! August 10, 2012 at 02:19 PM
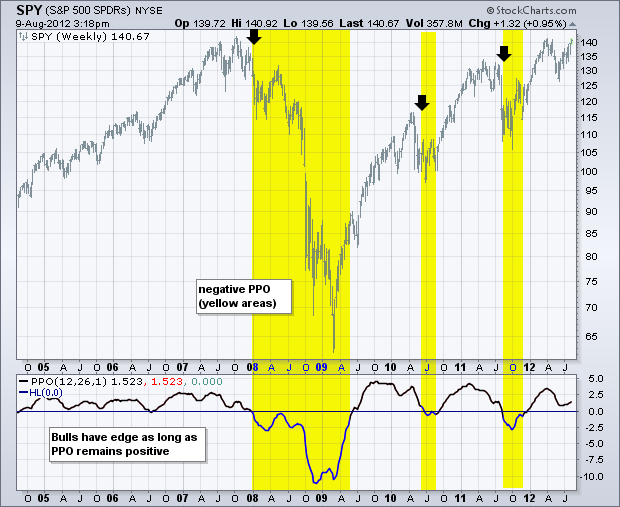
The Percent Price Oscillator (PPO) is a momentum oscillator that fluctuates above/below the zero line. While traders use divergences and direction for signals, investors can simply abide by the positive and negative crosses... Read More
Don't Ignore This Chart! August 09, 2012 at 01:50 PM
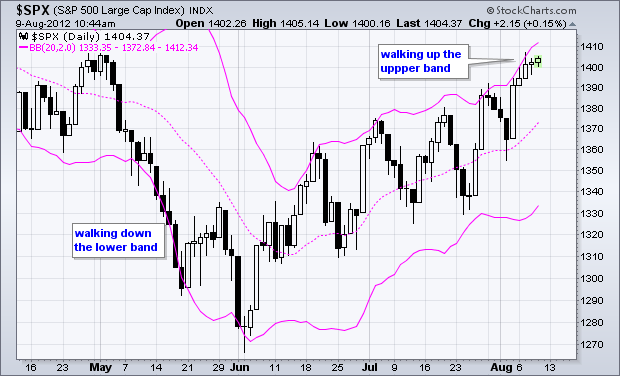
The S&P 500 surged to the upper Bollinger Band on Friday and walked further up the band this week. Notice how the index "tagged" the upper band in June, July and now August. Pullbacks also held above the lower band. This is the sign of a strong uptrend... Read More
Don't Ignore This Chart! August 08, 2012 at 05:17 PM
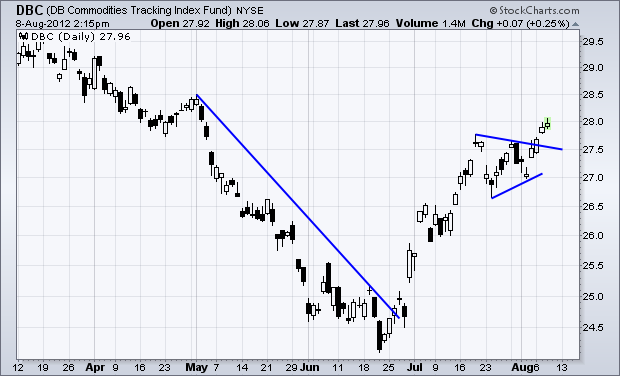
With the risk-on trade taking shape the last two weeks, the Commodity Index Fund ($DBC) broke above pennant resistance to continue its July advance. The upper trend line extends down to mark first support at 27.50... Read More
Don't Ignore This Chart! August 07, 2012 at 08:26 PM
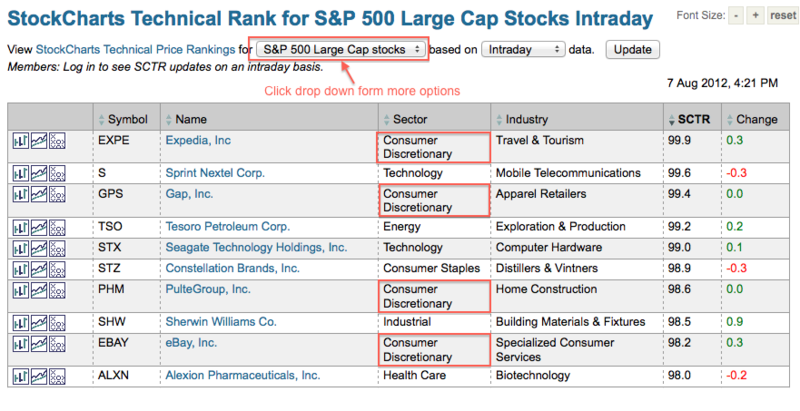
The StockCharts Technical Rank (SCTR) calculates a numerical ranking for all stocks in the S&P 500. Four of the top ten stocks come from the consumer discretionary sector, which is the most economically sensitive sector. Two of the top ten come from the technology sector... Read More
Don't Ignore This Chart! August 06, 2012 at 07:18 AM
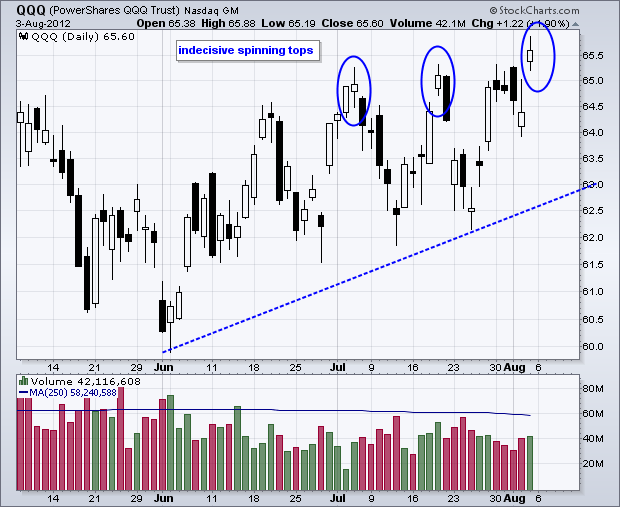
The Nasdaq 100 ETF (QQQ) broke above resistance from the July highs and remains in an uptrend, but a spinning top formed on Friday. These candlesticks show indecision and the prior two foreshadowed pullbacks within the uptrend... Read More
Don't Ignore This Chart! August 03, 2012 at 03:36 PM
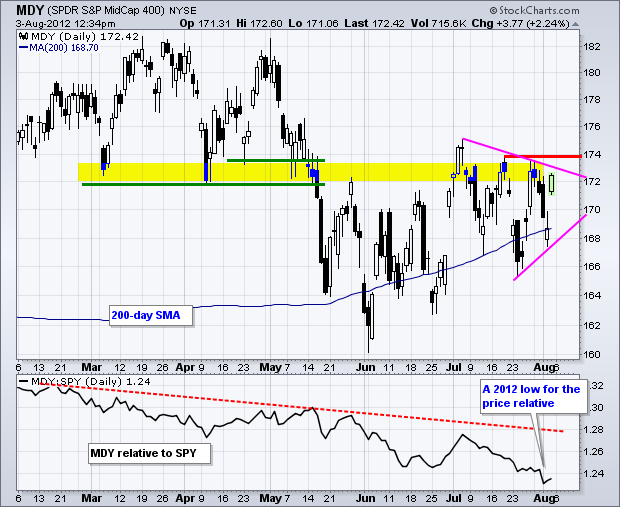
The S&P MidCap 400 SPDR (MDY) continues to underperforming the S&P 500 ETF (SPY), but the ETF is showing signs of life with a surge off back above the 200-day and a challenge to triangle resistance. A breakout would be bullish and target a move to the spring highs... Read More
Don't Ignore This Chart! August 02, 2012 at 06:25 PM
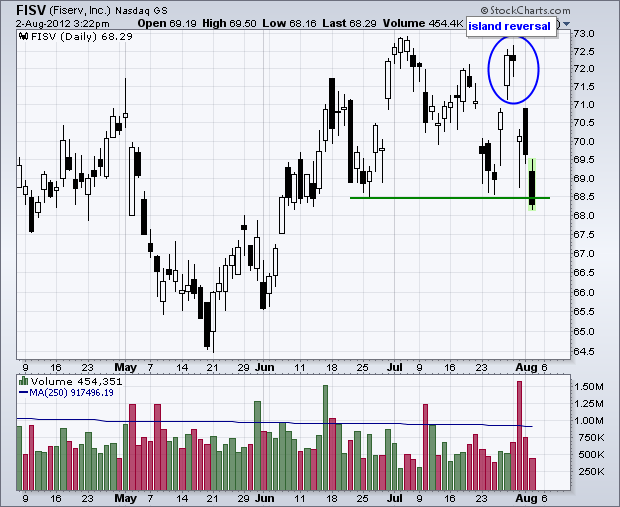
Fiserve (FISV) gapped up last week, but then gapped down this week to forge an island reversal. The stock followed through with a support break at 68 and this short-term trend reversal is turning into a medium-term trend reversal... Read More
Don't Ignore This Chart! August 01, 2012 at 02:25 PM
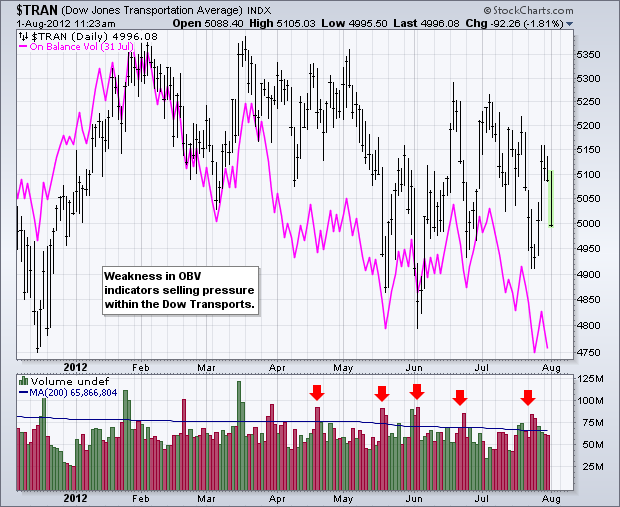
On Balance Volume (OBV) is a simple indicator that measures buying and selling pressure. Volume is added on up days and subtracted on down days. Even though the Dow Transports is holding above its June low, OBV sank to new lows and shows selling pressure... Read More