Don't Ignore This Chart! September 28, 2012 at 03:12 PM
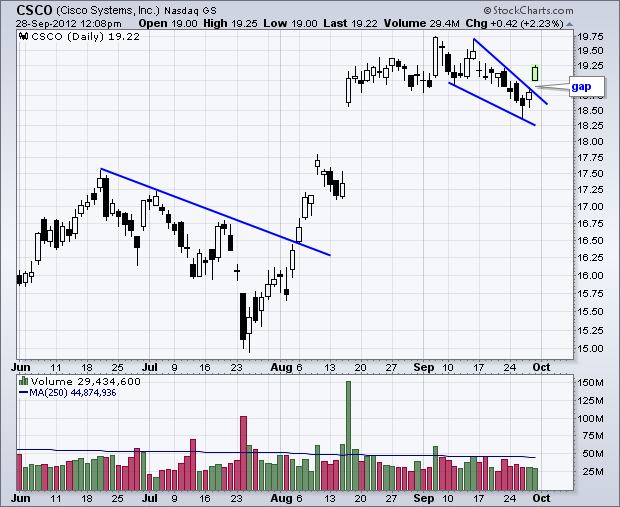
After a corrective decline the last few weeks, Cisco (CSCO) firmed on Wednesday with a small hammer and then surged above the wedge trend line with a gap on Friday. The gap-breakout is bullish until proven otherwise with a decline back below 18... Read More
Don't Ignore This Chart! September 27, 2012 at 01:49 PM
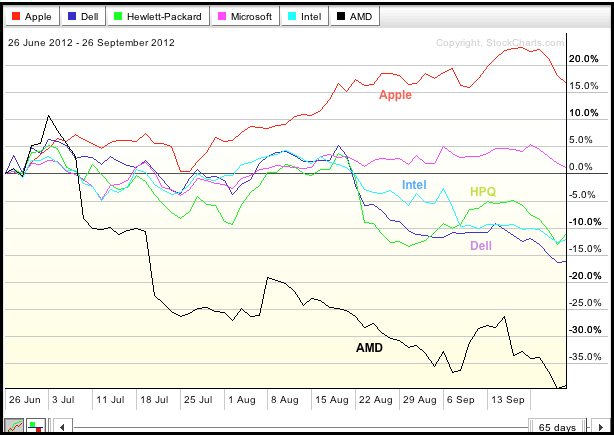
The PerfChart below shows three month performance for two chip makers (Intel and AMD), two PC-related companies (Dell and Hewlett Packard) and mister softy (Microsoft). Only Microsoft is up during this period, and just barely... Read More
Don't Ignore This Chart! September 26, 2012 at 07:16 PM
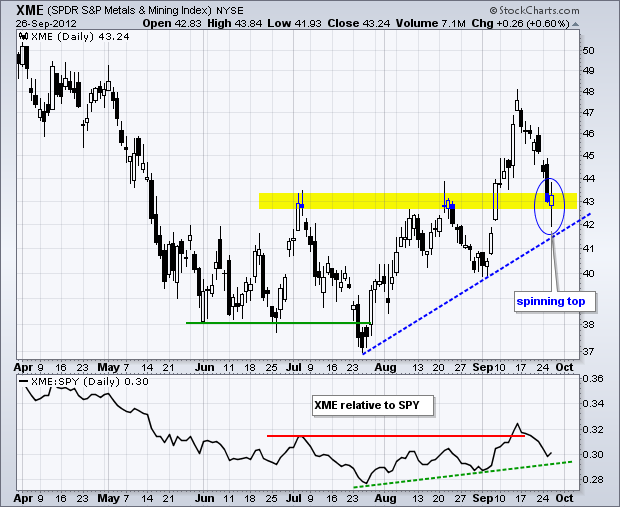
The battle for the breakout is on as the Metals & Mining SPDR (XME) declined to broken resistance and formed a big spinning top. These candlesticks show serious indecision... Read More
Don't Ignore This Chart! September 25, 2012 at 04:12 PM
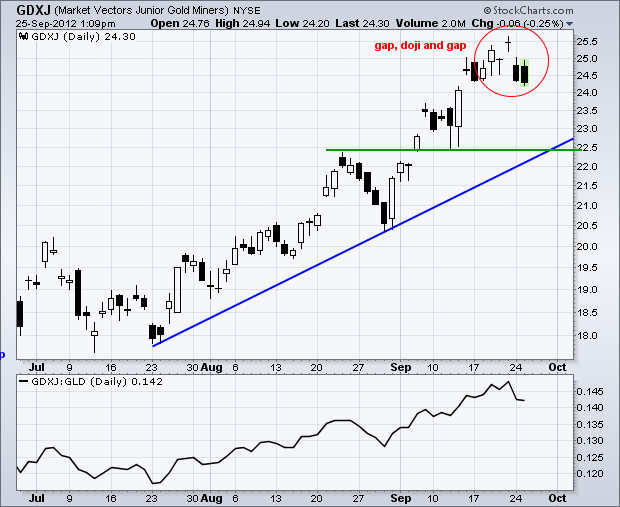
After a big run from late July to mid September, the Junior Gold Miners ETF (GDXJ) formed a bearish candlestick reversal over the last 4-5 days. First, there was the gap and doji. This signaled sudden indecision after a big jump... Read More
Don't Ignore This Chart! September 24, 2012 at 11:42 AM
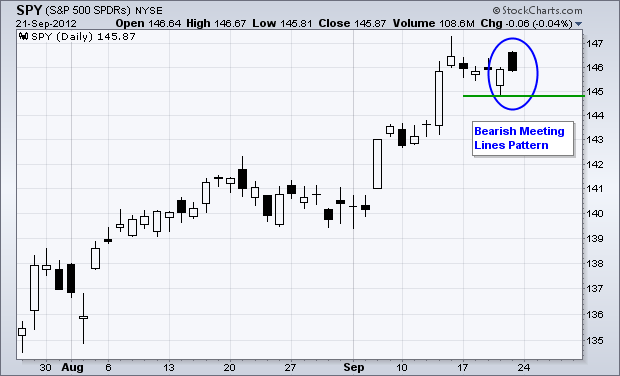
The S&P 500 ETF (SPY) formed a rare bearish candlestick reversal pattern over the last two days. The Bearish Meeting Lines pattern forms with a white candlestick and a black candlestick that have relatively equal closes... Read More
Don't Ignore This Chart! September 22, 2012 at 07:10 PM
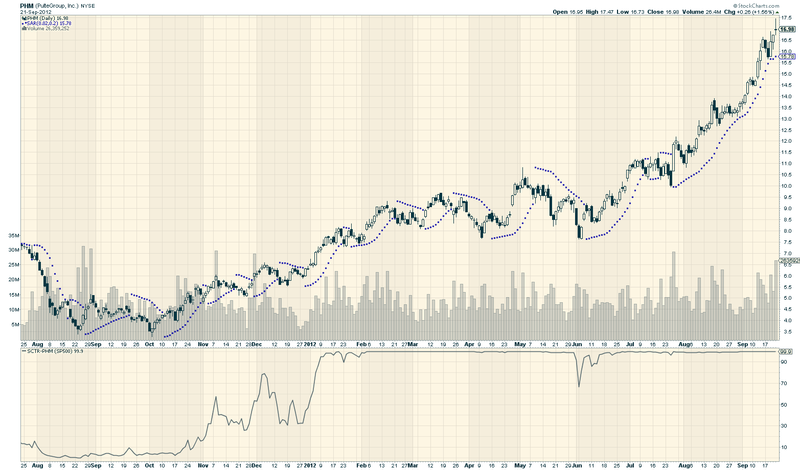
When we debuted our StockCharts Technical Rankings (SCTRs) back in November of last year, little did we know that the strongest stock for most of 2012 was just completing its turnaround... Read More
Don't Ignore This Chart! September 21, 2012 at 01:29 PM
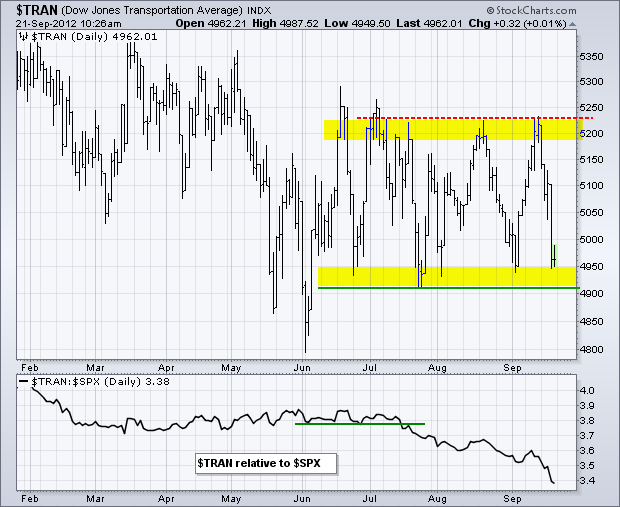
The Dow Transports surged to resistance last week and plunged to support this week. Overall, the junior Average has been stuck in a trading range since mid June with support at 4900 and resistance around 5250... Read More
Don't Ignore This Chart! September 20, 2012 at 03:03 PM
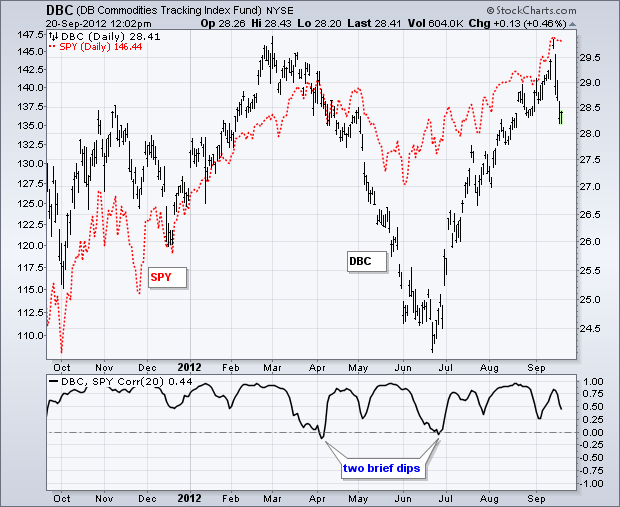
The S&P 500 ETF (SPY) and the Commodity Index Fund ($DBC) have been positively correlated for almost all of the last 12 months. As the indicator window shows, the Correlation Coefficient (SPY,DBC) dipped into negative territory only twice and spent most of the time above .50... Read More
Don't Ignore This Chart! September 19, 2012 at 11:28 AM
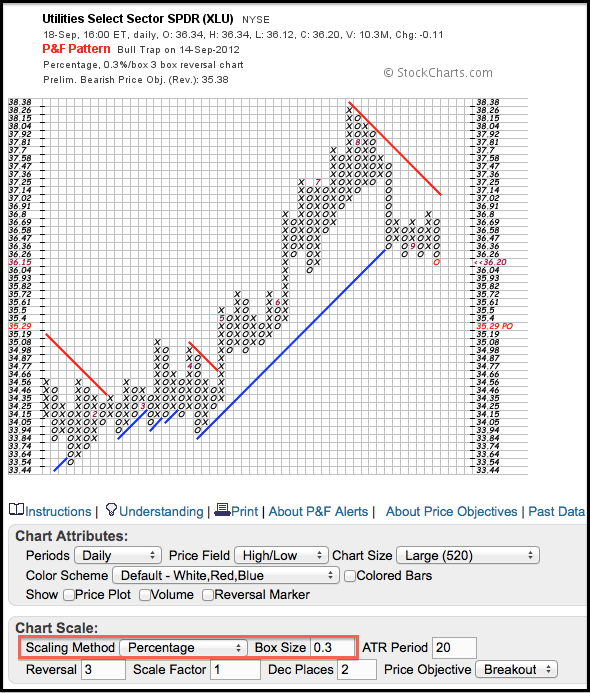
The Utilities SPDR (XLU) is by far the weakest of the nine sector SPDRs right now. The P&F chart below uses daily price data and each box is valued at .30%. The ETF broke the Bullish Support Line in August, consolidated and then broke below the prior two O-Columns with this week... Read More
Don't Ignore This Chart! September 18, 2012 at 02:41 PM
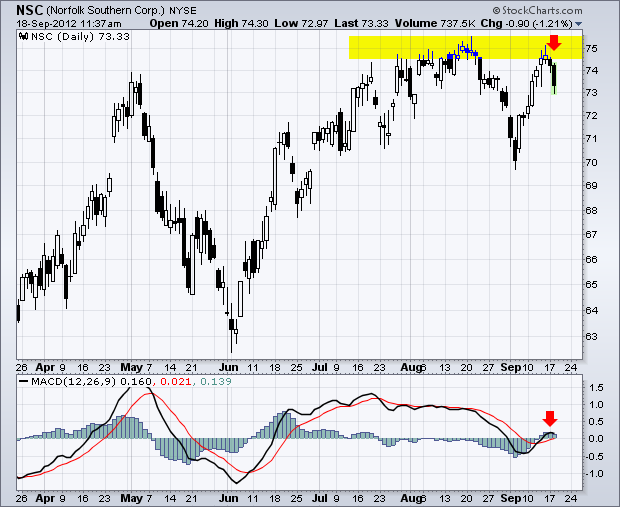
Norfolk Southern (NSC) is a railroad company and a key part of the Dow Transports. The chart below shows NSC hitting resistance around 75 and falling over 1% today. Notice that MACD barely made it back in positive territory on the last bounce... Read More
Don't Ignore This Chart! September 17, 2012 at 01:09 PM
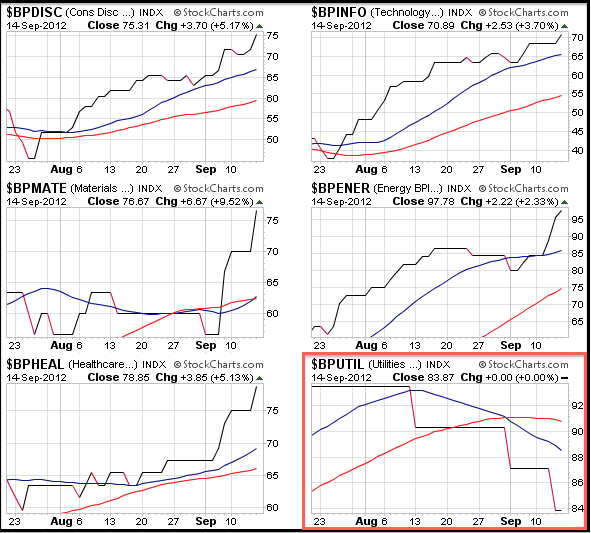
The Bullish Percent Index (BPI) shows the percentage of stocks on Point & Figure buy signals within a specific group. Even though bulls have the edge when the BPI is above 50%, chartists also need to watch the direction of the BPI... Read More
Don't Ignore This Chart! September 14, 2012 at 11:40 AM
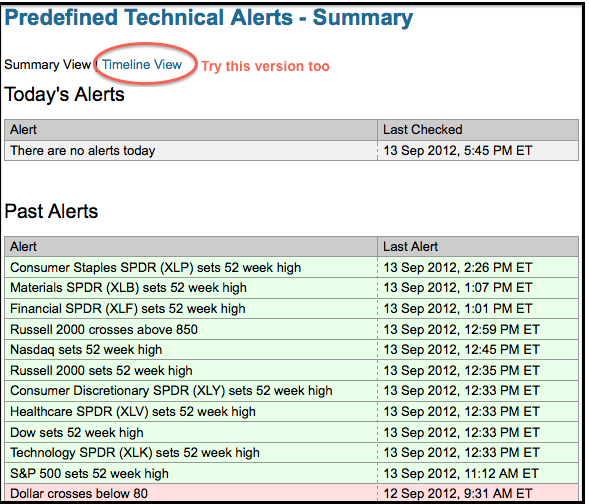
StocksCharts.com has a new technical alerts page that shows key milestones for dozens of ETFs and indices. On Thursday, September 13th, note that 10 securities recorded new 52-week highs. These include the Nasdaq, Russell 2000, Dow, S&P 500 and six sector SPDRs... Read More
Don't Ignore This Chart! September 13, 2012 at 02:33 PM
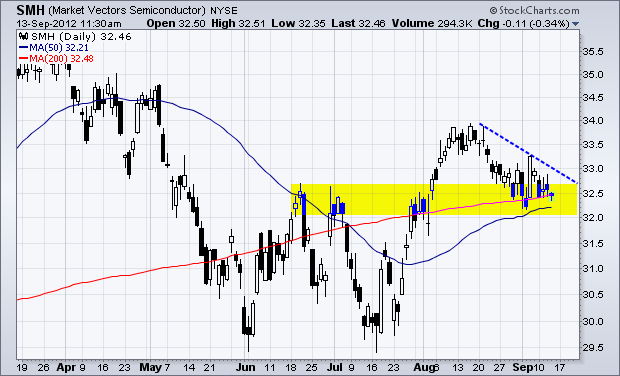
After a big surge above 33, the Market Vectors Semiconductor ETF (SMH) peaked in mid August and declined back to support in the 32.50 area. Support here stems form broken resistance, the rising 200-day SMA and the rising 50-day SMA... Read More
Don't Ignore This Chart! September 12, 2012 at 02:55 PM
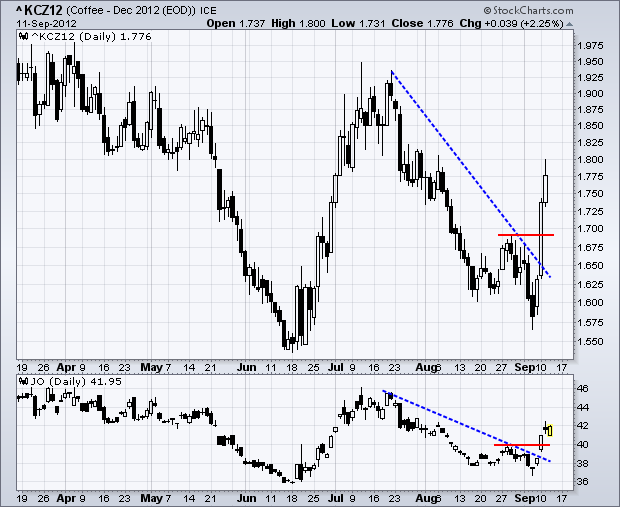
The chart in the main window shows December Coffee Futures ($KCZ12) finding support above the June low and surging above the late August high. The indicator window shows the Coffee ETN (JO) with a similar pattern. These breakouts are bullish as long they hold... Read More
Don't Ignore This Chart! September 07, 2012 at 03:20 PM
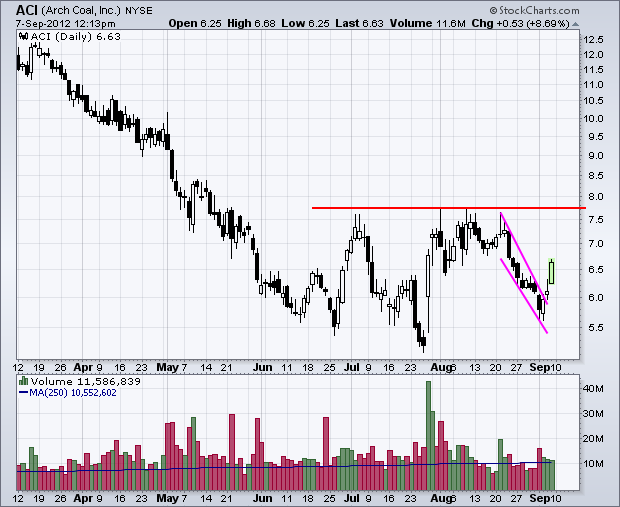
The coal group has been one of the worse performers this year, but coal stocks moved sharply higher the last two days. Arch Coal (ACI) is showing some signs of life with a falling wedge breakout on three days of good volume... Read More
Don't Ignore This Chart! September 06, 2012 at 02:40 PM
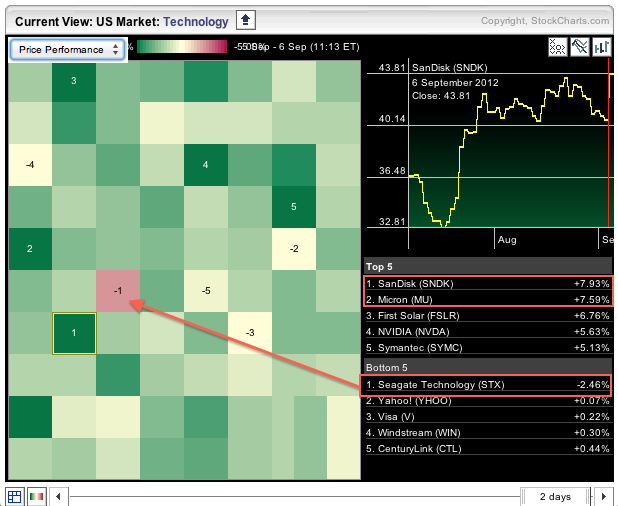
The technology sector is lighting up the market carpet with a sea of green. Notice that memory makers Sandisk (SNDK) and Micron (MU) are leading the charge. Both gapped higher on their price charts. Hard-disk maker Seagate (STX) is the only loser in this group... Read More
Don't Ignore This Chart! September 05, 2012 at 04:44 PM
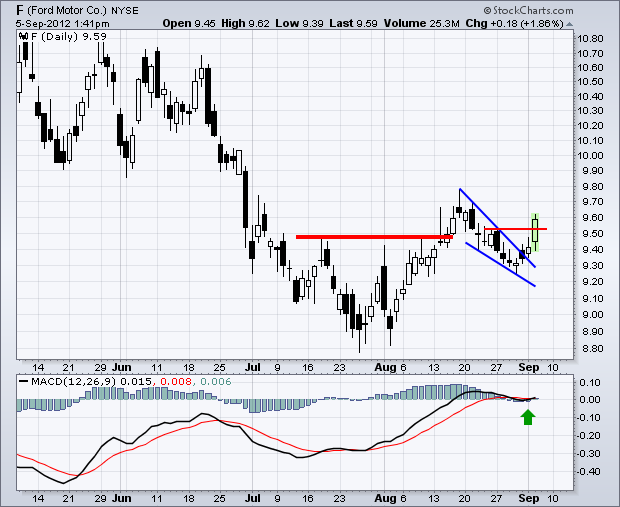
Ford (F) came across the bullish MACD scan as the MACD line moved above its signal line (9-day EMA of MACD). On the price chart, F formed a falling wedge at the end of August and broke wedge resistance with a surge the last three days. The late August low becomes key support... Read More
Don't Ignore This Chart! September 04, 2012 at 03:13 PM
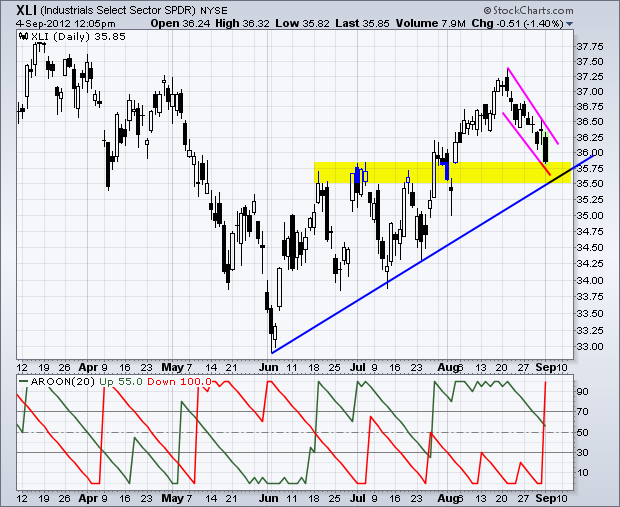
The Industrials SPDR (XLI) is under pressure today after a weak manufacturing report. The chart below shows XLI falling to a support zone marked by broken resistance and the June trend line... Read More