Don't Ignore This Chart! February 28, 2013 at 06:32 PM
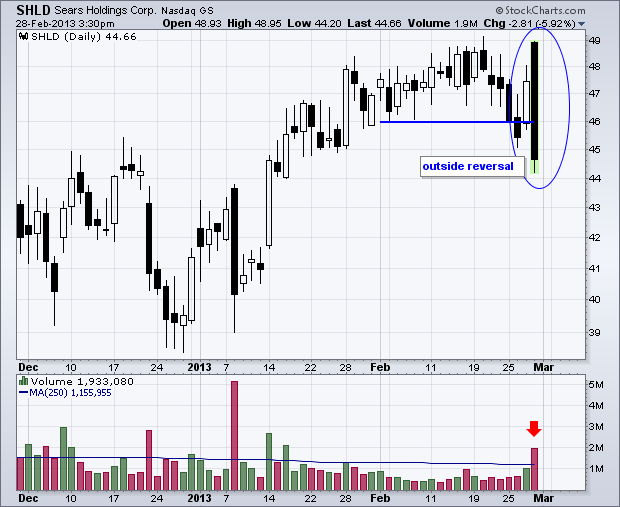
Sears Holdings (SHLD) started the day strong, but sold off hard to form an outside reversal day. In fact, today's price action encompassed the high-low range of the last five days. This reversal also occurred on high volume to further reinforce resistance at 49... Read More
Don't Ignore This Chart! February 27, 2013 at 02:13 PM
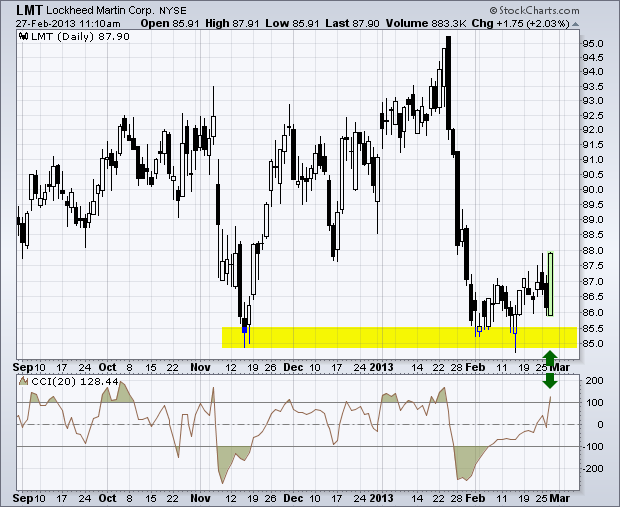
Big defense contractors got slammed in late January as the market priced in a worst-case sequester scenario in about seven trading days. LMT firmed after this sharp decline and then surged with a long hollow candlestick on Wednesday... Read More
Don't Ignore This Chart! February 26, 2013 at 07:01 PM
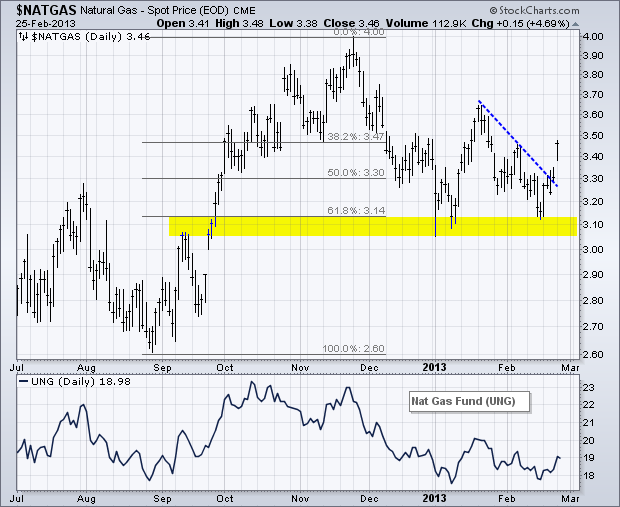
Don't look now, but Natural Gas ($NATGAS) held support near the 62% retracement and broken resistance near 3.10 this year. $NATGAS bounced twice off this level with the second surge sending it above 3.40 this week... Read More
Don't Ignore This Chart! February 25, 2013 at 04:47 PM
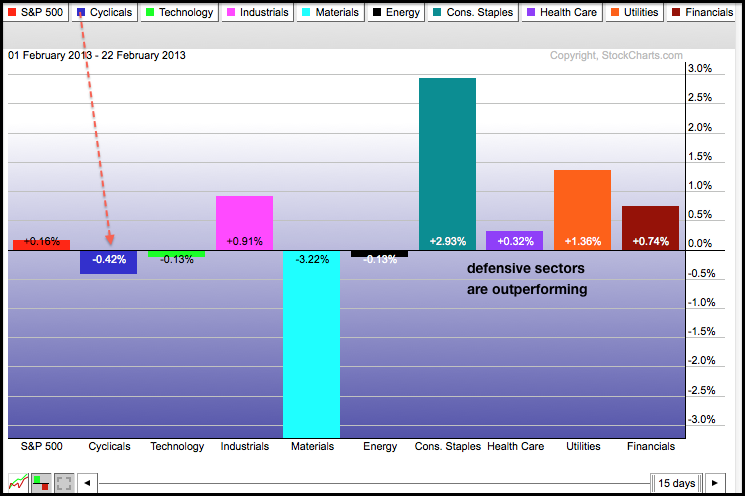
After big gains in January, the market is having a tough time in February with relative weakness coming from the Consumer Discretionary SPDR (XLY) and Technology SPDR (XLK). Also notice that the defensive sectors are starting to outperforming (XLP, XLU and XLV)... Read More
Don't Ignore This Chart! February 22, 2013 at 01:52 PM
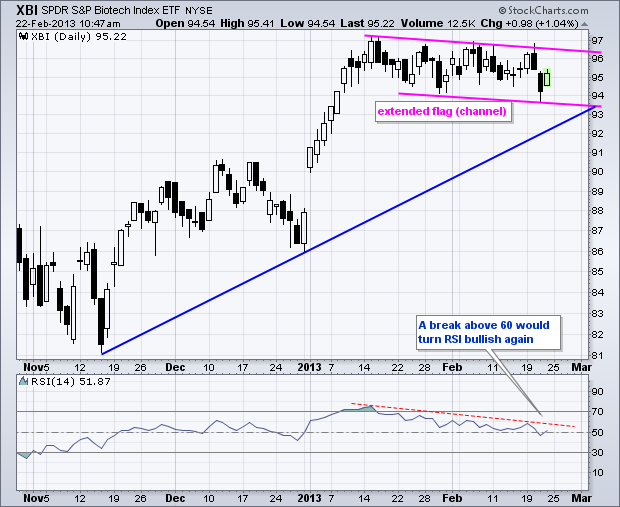
XBI surged the first two weeks of January, and then corrected the next six weeks with a falling channel. The fall is ever so slight though. A move above 96.5 would break the channel trend line and signal a continuation of the bigger uptrend... Read More
Don't Ignore This Chart! February 21, 2013 at 06:36 PM
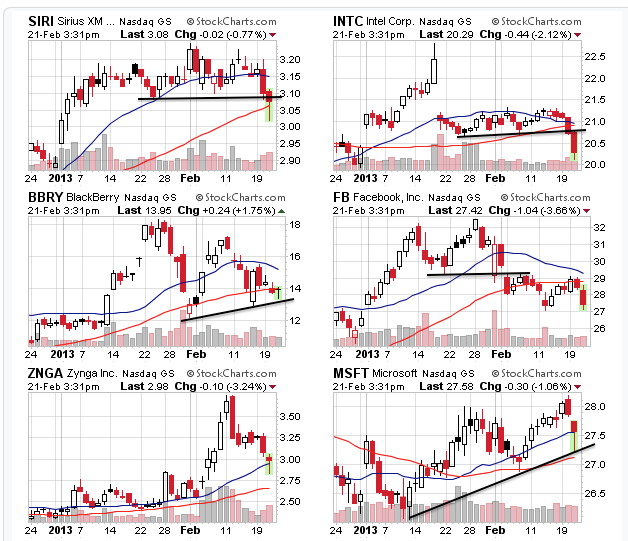
You can see a lot with CandleGlance charts. The 6 charts below come from the Nasdaq most active list today. Intel broke support with a sharp decline the last two days and Facebook broke down in early February... Read More
Don't Ignore This Chart! February 20, 2013 at 05:50 PM
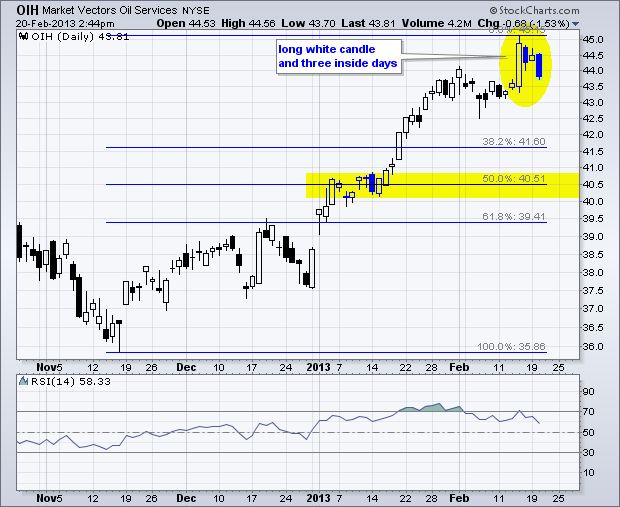
OIH surged to a new high with a long white candlestick last week, but suddenly stalled as the next three candlesticks formed inside this long candlestick. This is basically an extended harami pattern, which is potentially bearish... Read More
Don't Ignore This Chart! February 19, 2013 at 05:47 PM
The stock market may be overbought and sentiment may seem overly bullish, but buying pressure continues to outpace selling pressure... Read More
Don't Ignore This Chart! February 19, 2013 at 11:50 AM
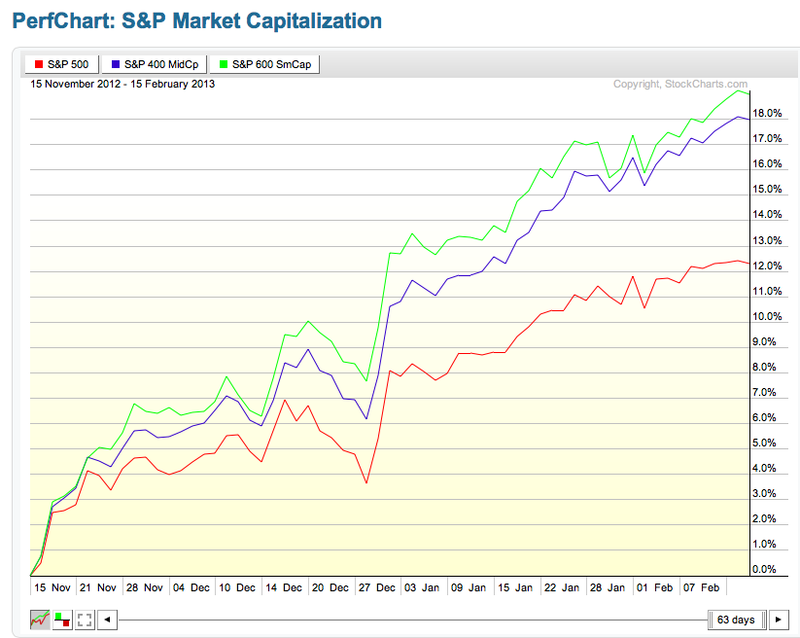
If you aren't watching the small and mid-caps, you are missing out. To wit: (Click here for a live version of this chart... Read More
Don't Ignore This Chart! February 15, 2013 at 04:05 PM
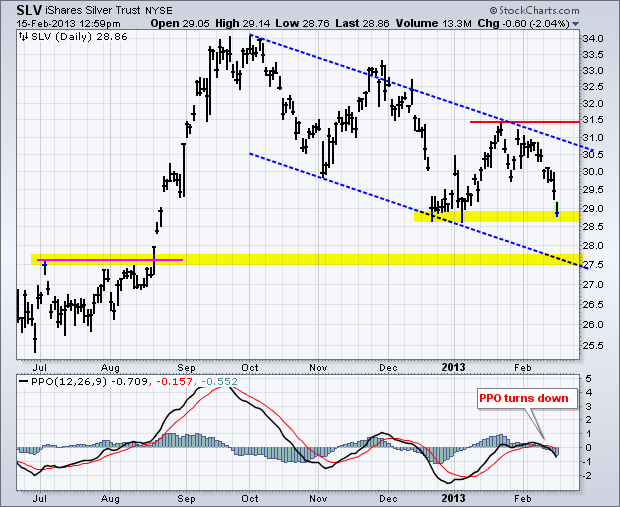
Gold, oil and silver fell sharply on Friday as the G20 meeting started in Moscow. The chart below shows the Silver Trust (SLV) forming a lower high in late January and plunging to the early January low... Read More
Don't Ignore This Chart! February 14, 2013 at 03:21 PM
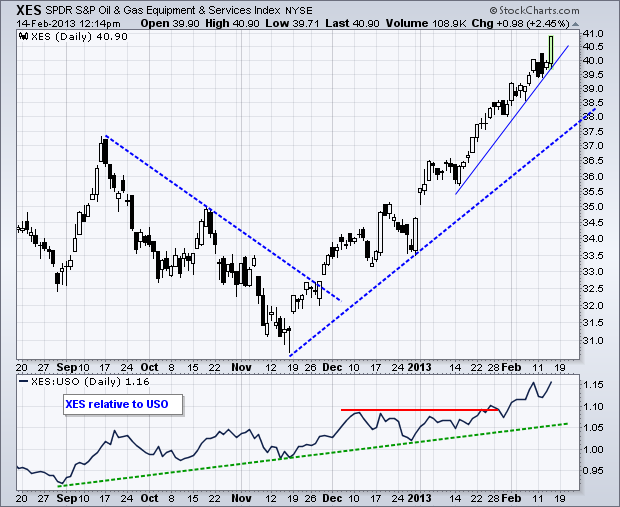
Oil related stocks remain red hot as the Oil & Gas Equipment/Services SPDR (XES) surged over 2% on Thursday and exceeded its 2012 high. The uptrend just gets steeper as the advance accelerated the last five weeks... Read More
Don't Ignore This Chart! February 13, 2013 at 06:59 PM
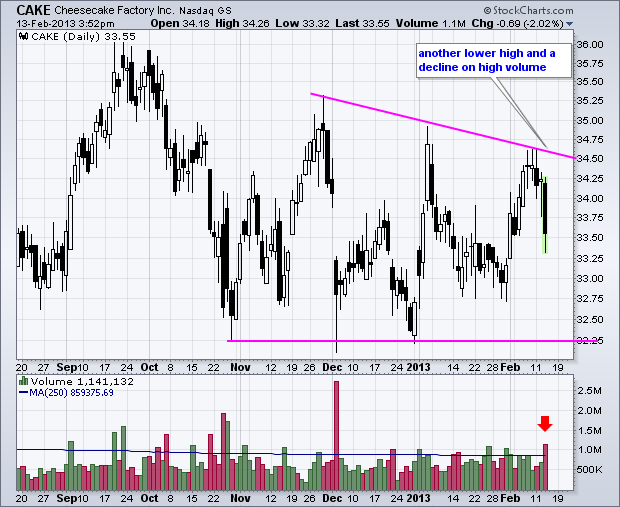
Even though exchange volume remains relatively light, Cheesecake Factory (CAKE) is trading above average volume and falling sharply. Notice that CAKE formed a lower high in early February and the next support zone resides in the 32.25-32.5 area... Read More
Don't Ignore This Chart! February 12, 2013 at 05:15 PM
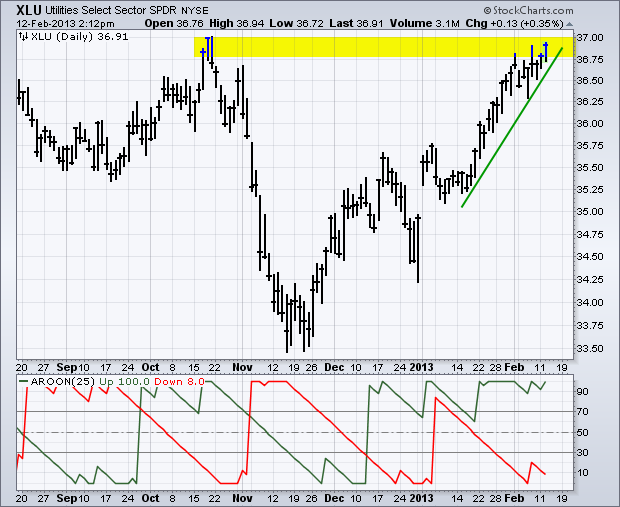
The Utilities SPDR (XLU) bottomed along with the broader market in mid November and advanced the last three months, but the advance has lagged in more ways than one. XLU is up less than SPY and SPY is already above its October high... Read More
Don't Ignore This Chart! February 11, 2013 at 04:57 PM
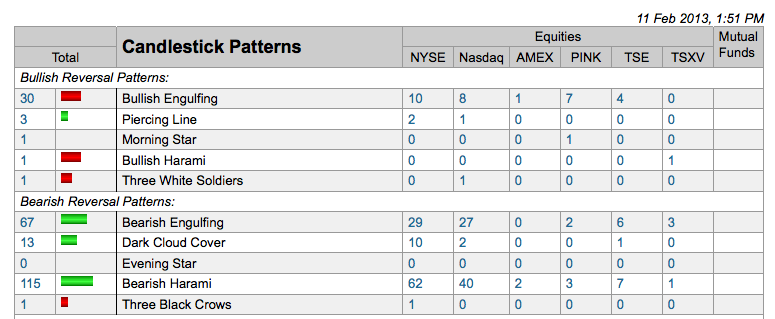
There was an uptick in the number of bearish candlestick reversals on Monday afternoon. As the screen shot below shows, there were 67 bearish engulfing patterns as of 1:51PM ET. There were also 13 dark cloud patterns and over 100 harami, which are like inside days... Read More
Don't Ignore This Chart! February 09, 2013 at 10:45 PM
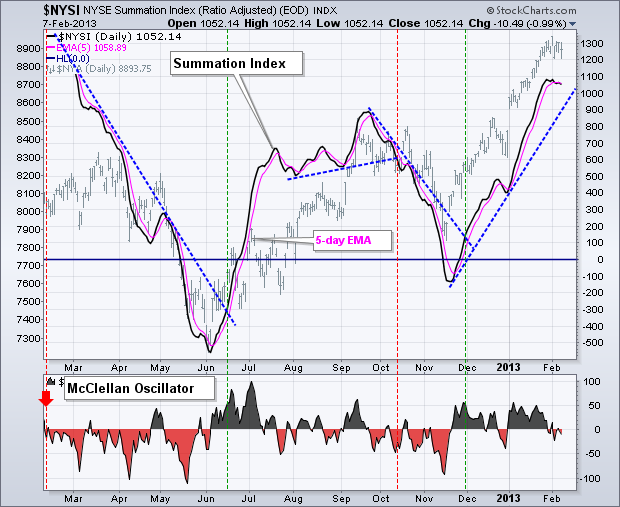
The NYSE Summation Index ($NYSI) has been rising since the latter part of November and recently exceeded its September high. The trend here is clearly up with the November trend line marking first support... Read More
Don't Ignore This Chart! February 07, 2013 at 06:36 PM
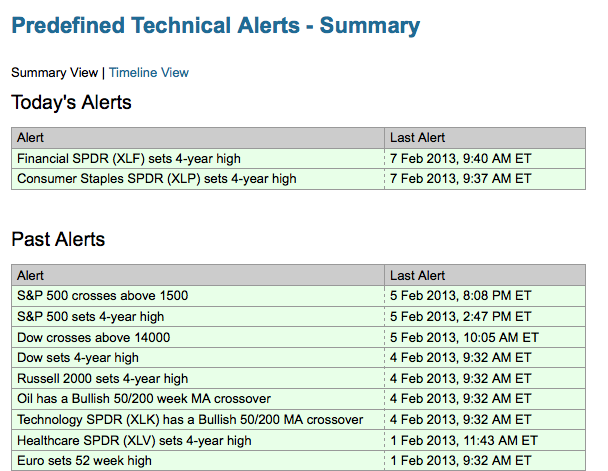
The predefined technical alerts at StockCharts.com have been decidedly positive since January 2nd. You can view the history on the summary page. February continues to be a good month with eleven positive alerts and zero negative alerts... Read More
Don't Ignore This Chart! February 06, 2013 at 05:10 PM
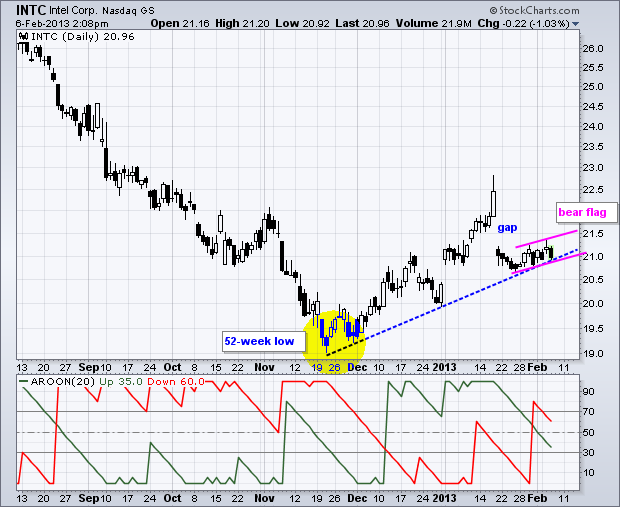
Intel (INTC) recorded a 52-week low in mid November and bounced with the rest of the market over the next two months. This bounce abruptly ended with a gap down to the mid November trend line... Read More
Don't Ignore This Chart! February 05, 2013 at 06:59 PM
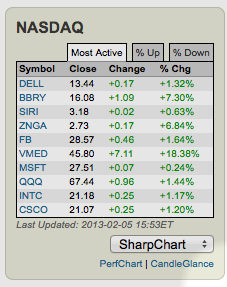
A look at the ten most active stocks shows four old school tech stocks leading the charge. Microsoft, Dell, Intel and Cisco are all up and active. This table comes from the FreeCharts page... Read More
Don't Ignore This Chart! February 04, 2013 at 03:26 PM
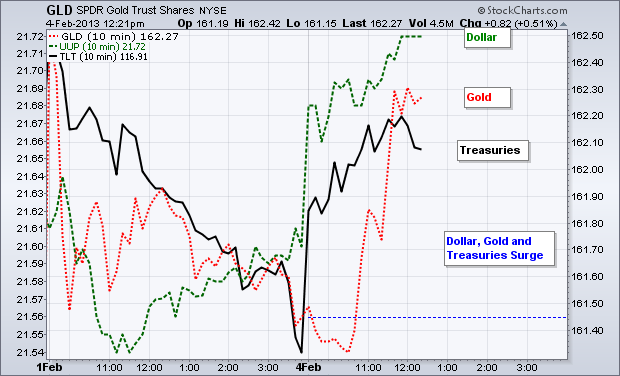
Some fears in Spain and Italy triggered a move away from risk as the US Dollar Fund (UUP) and the 20+ Year T-Bond ETF (TLT) surged on Monday. Even though the Dollar is up sharply, also note that the Gold SPDR (GLD) is up and gold is attracting money... Read More
Don't Ignore This Chart! February 01, 2013 at 10:07 AM
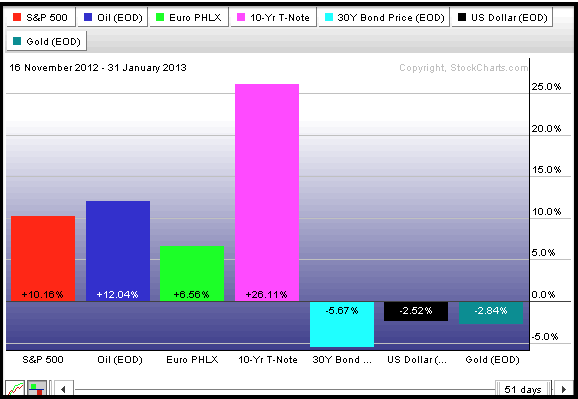
The markets are clearly in the mood to embrace risk. The S&P 500 and Spot Light Crude ($WTIC) are up over 10% since mid November, and the Euro Index ($XEU) is up over 6%. In contrast, the 30-Year US Treasury ($USB) and the US Dollar Index ($USD) are down... Read More