Don't Ignore This Chart! July 31, 2014 at 02:27 PM
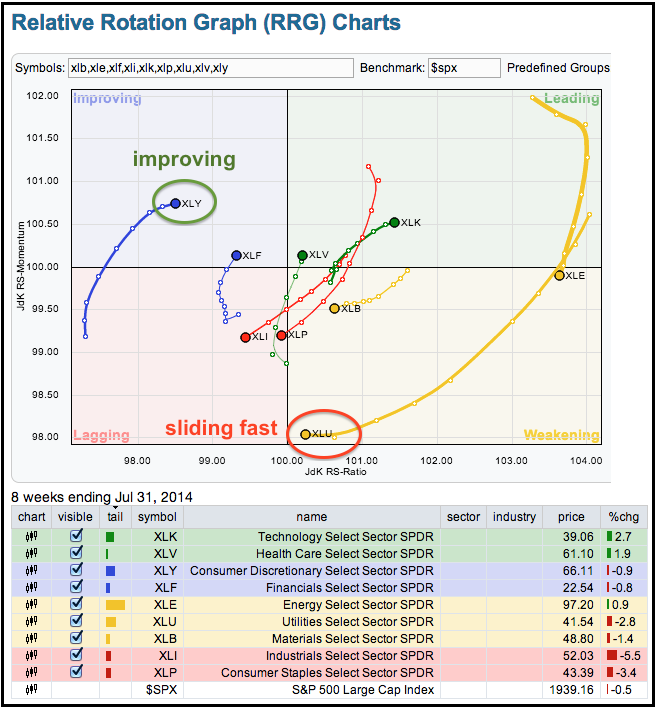
There is a new feature in town: Relative Rotation Graphs from Julius de Kempenaer. These graphs make it easy to see which sectors are improving, leading, weakening and lagging... Read More
Don't Ignore This Chart! July 30, 2014 at 01:52 PM
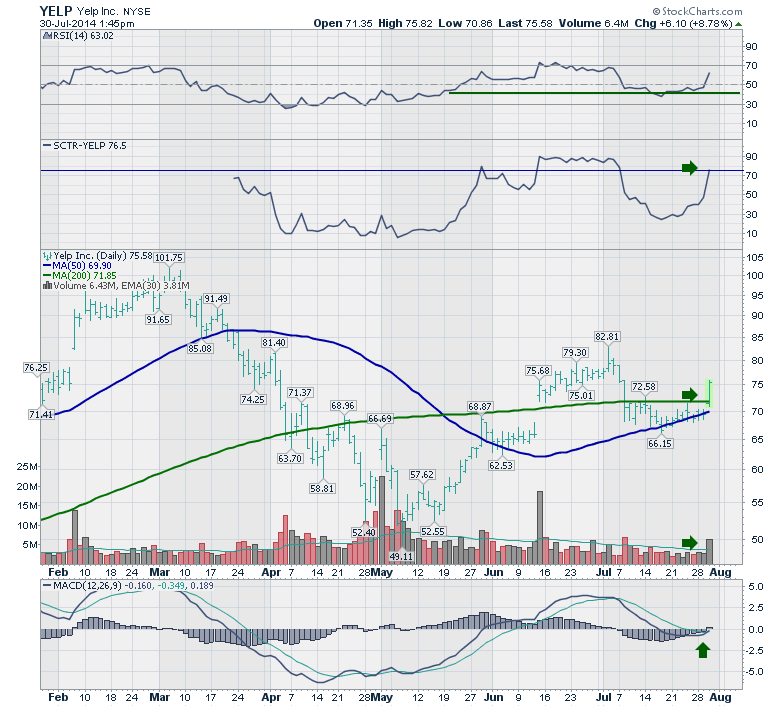
Yelp (YELP) is reporting earnings after the bell, but the market appears to think it is going to be great! The stock is up over 8% and the earnings come out at 4:30 EST today. Every signal turned green today with the price gapping above the 200 DMA... Read More
Don't Ignore This Chart! July 29, 2014 at 05:37 PM
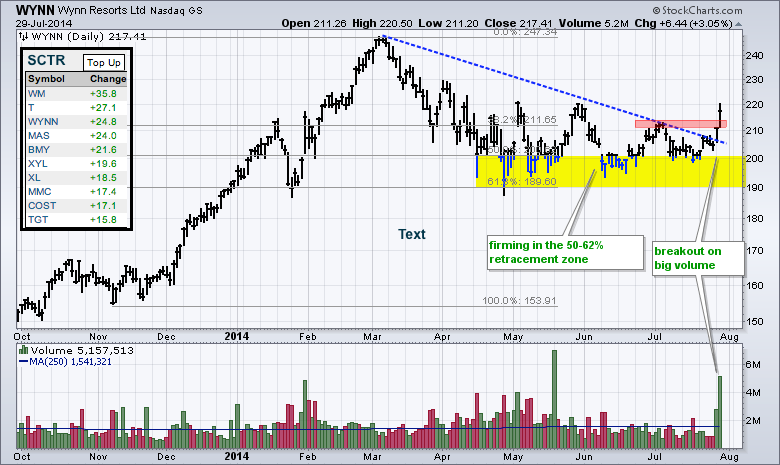
I was looking through the list of large-cap stocks with the biggest gains in their StockCharts Technical Rank (SCTR) and found Wynn Resorts with a huge move (+24.8 to 78). Wynn is now in the top 23 percent of large-caps for relative strength based on the SCTR... Read More
Don't Ignore This Chart! July 25, 2014 at 04:41 PM
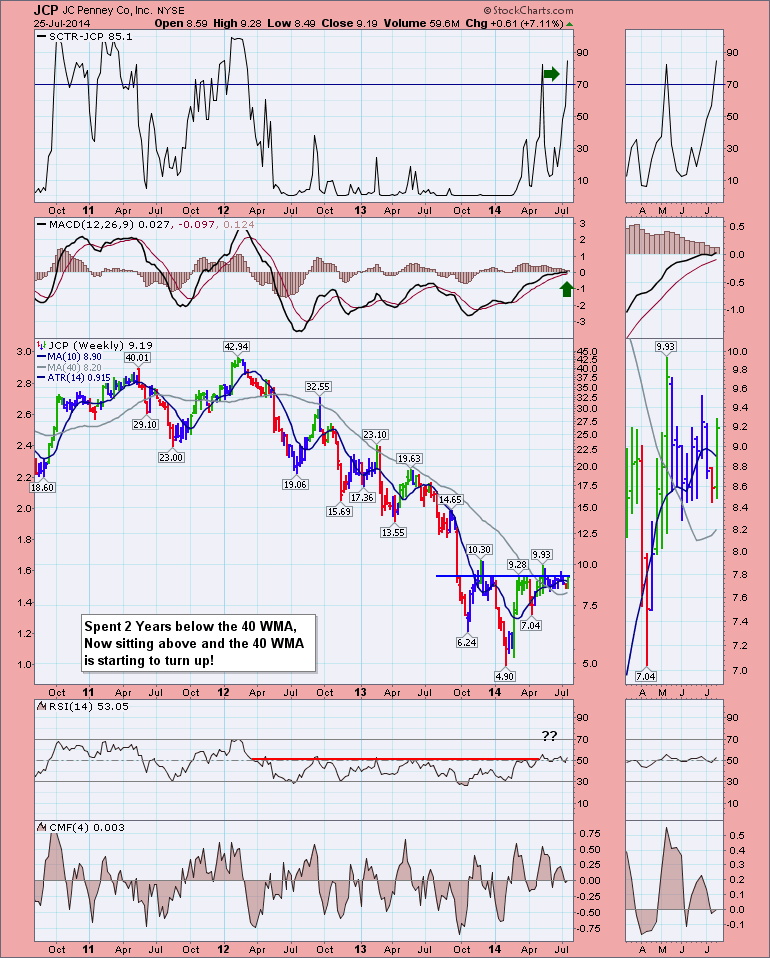
J C Penney (JCP) is a crazy chart that was decimated by a dramatic change in marketing strategy. Recently, a new management team was put in place to revive the brand. Here is a view of the chart and what makes it particularly compelling to watch... Read More
Don't Ignore This Chart! July 24, 2014 at 04:14 PM
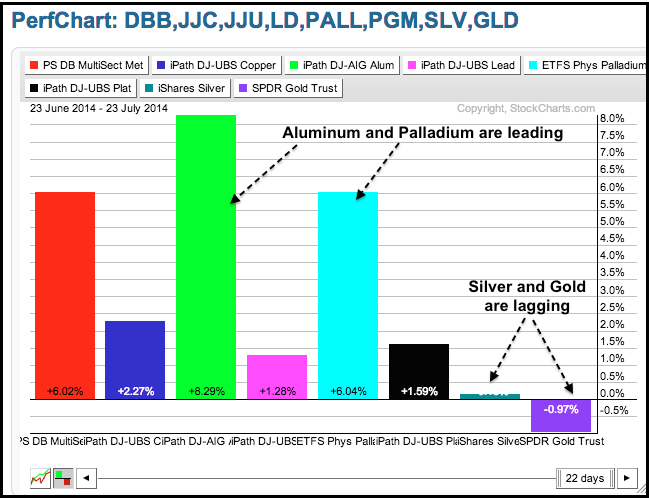
The PerfChart below shows the Base Metals ETF (DBB) along with seven other metal-related ETFs. Notice that the Aluminum ETF (JJU) and Palladium ETF (PALL) are the big leaders. Meanwhile, the Gold SPDR (GLD) and the Silver ETF (SLV) are the laggards... Read More
Don't Ignore This Chart! July 23, 2014 at 05:08 AM
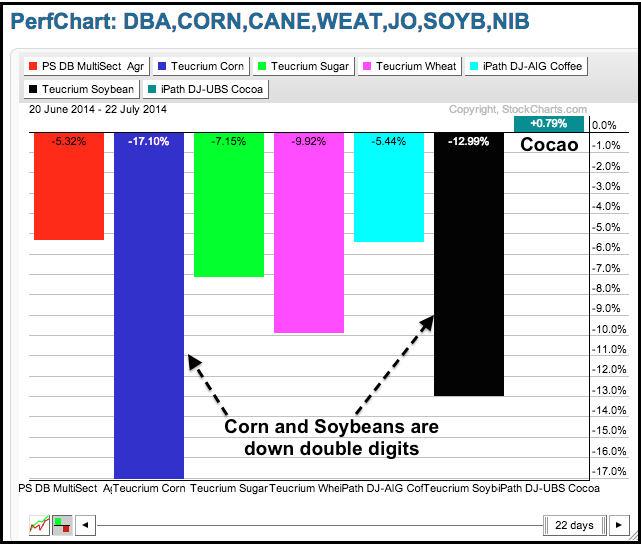
The PerfChart below shows the Multi-sector Agriculture ETF (DBA) along with six other agriculturally based ETFs. Five of the six got slammed over the past month with the Corn Trust ETF (CORN) and Soybean Fund (SOYB) posting double digit losses... Read More
Don't Ignore This Chart! July 22, 2014 at 11:51 AM
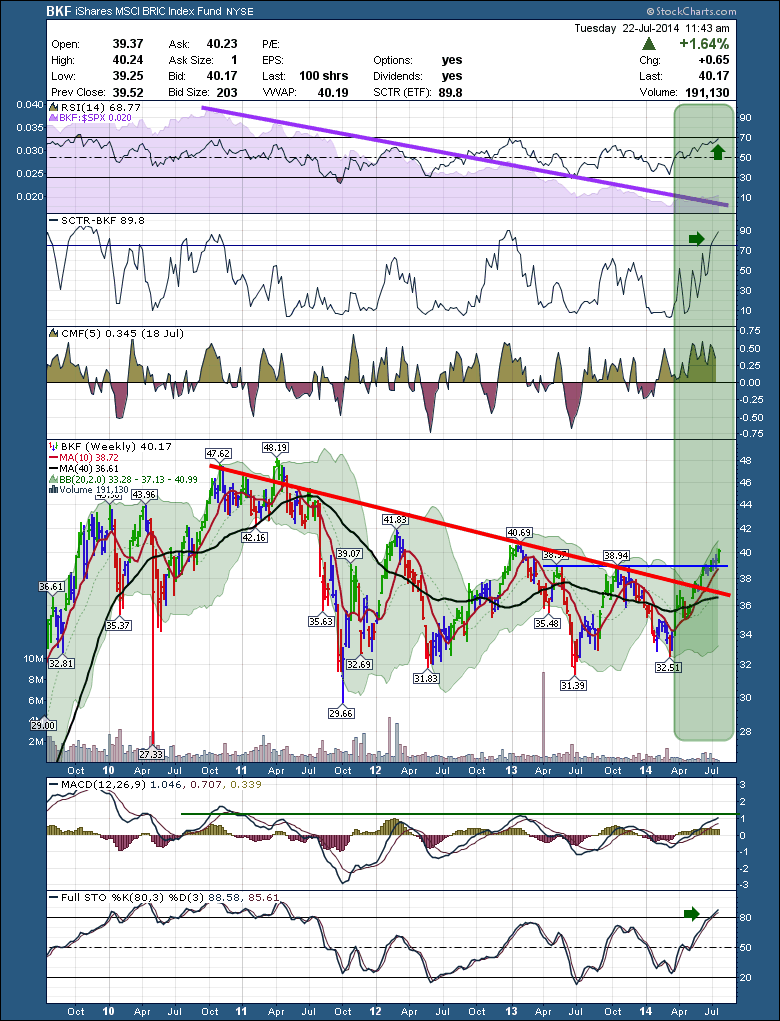
We keep wondering when the global economy is going to improve. Well, India has been on a tear for a while. China, Russia and Brazil have not been able to break out. That might be changing. Here is the chart for the iShares BRIC Countries (BKF)... Read More
Don't Ignore This Chart! July 21, 2014 at 10:27 PM
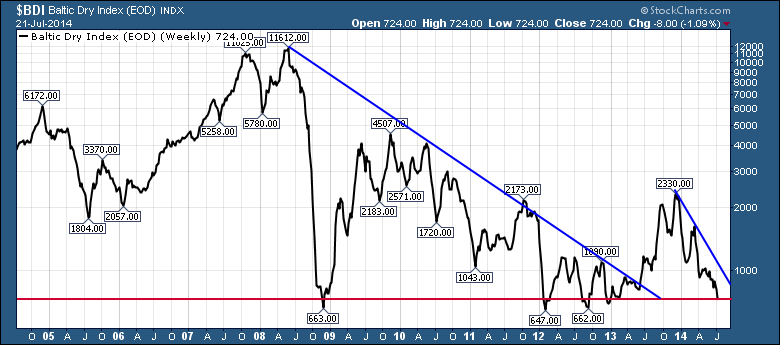
The shipping rates represented by the Baltic Dry Index ($BDI) just can't seem to get a break. With rates soaring to huge highs in 2007, new ships were ordered well into the future... Read More
Don't Ignore This Chart! July 18, 2014 at 05:58 AM
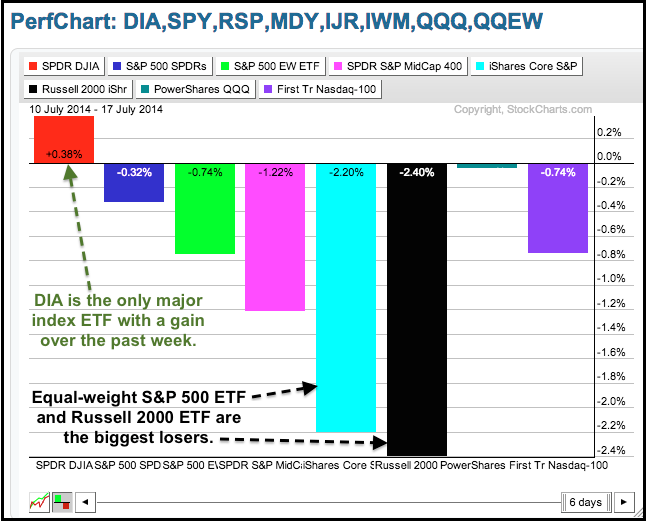
Stocks came under selling pressure over the past week with small-caps bearing the brunt. The PerfChart below shows the performance for eight major index ETFs over the past week. Seven are down and only one is up. The Dow Diamonds (DIA) has the only gain... Read More
Don't Ignore This Chart! July 15, 2014 at 11:39 AM
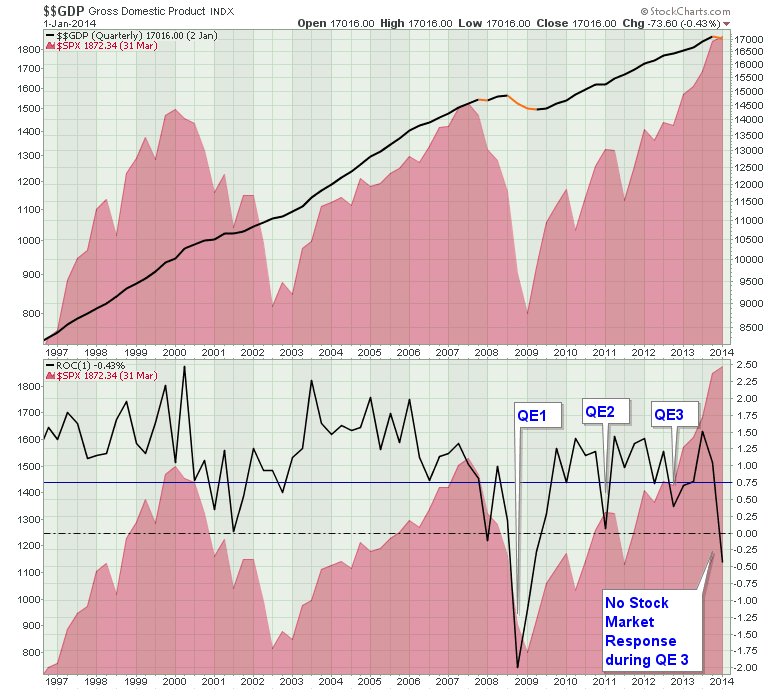
Gross Domestic Product ($$GDP) is the broad view on the economy. Normally there is some tracking of the stock market with Gross Domestic Product. The top graph shows the USA GDP in Millions of Dollars... Read More
Don't Ignore This Chart! July 15, 2014 at 06:54 AM
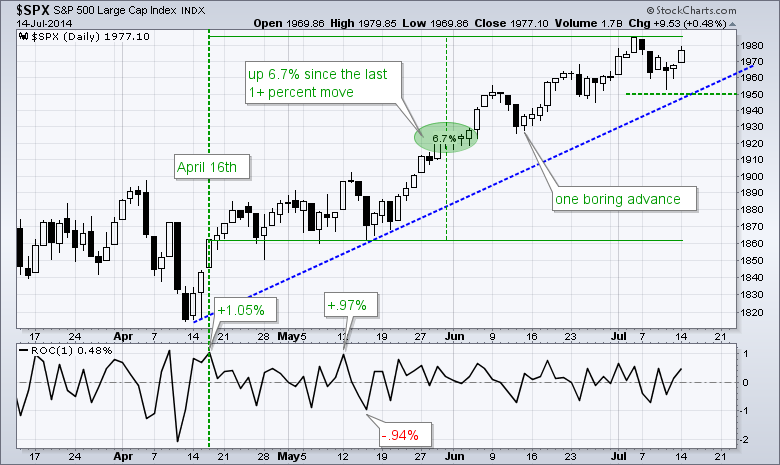
The S&P 500 is up over 6% since mid April, but this advance has been about as boring as they get. Note that this key benchmark has not moved more than 1% since April 16th (hat tip crossingwallstreet.com)... Read More
Don't Ignore This Chart! July 14, 2014 at 12:19 PM
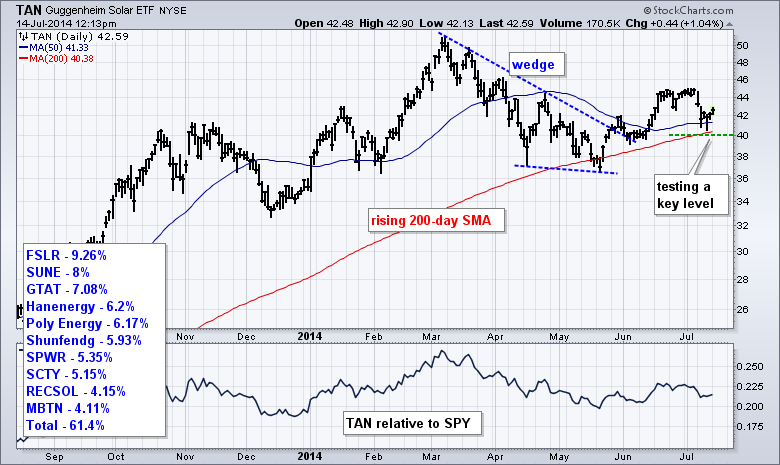
After a wedge breakout in late May, the Solar Energy ETF (TAN) is testing this breakout and two key moving averages in July. Notice how the 50-day and 200-day moving averages converge in the 40-41 area. TAN is currently above both and the 50-day is above the 200-day... Read More
Don't Ignore This Chart! July 10, 2014 at 03:35 PM
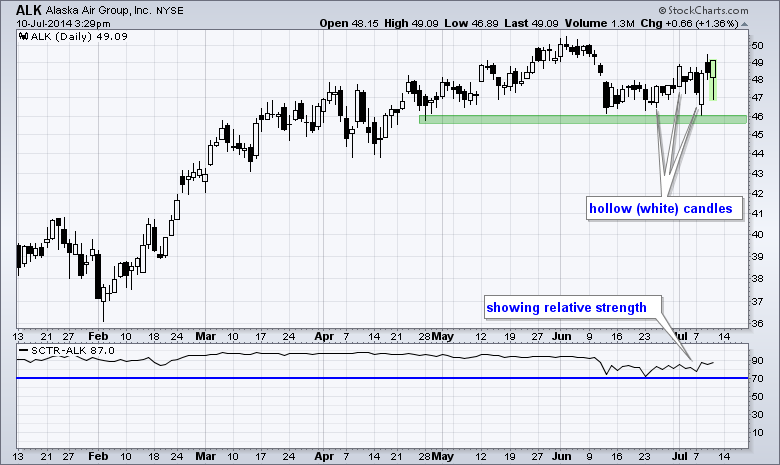
Alaska Air (ALK) fell sharply in early June, established support just above 46 and bounced off this support zone the last few days. This is impressive considering the selling pressure that hit the market this week. Notice the hollow, or white, candles... Read More
Don't Ignore This Chart! July 08, 2014 at 04:54 PM
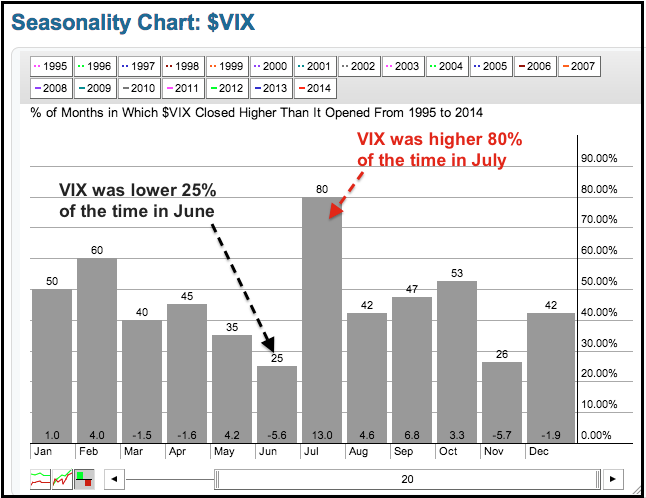
There are seasonal tendencies and then there are STRONG seasonal tendencies. Over the last 20 years, the S&P 500 Volatility Index ($VIX) has moved higher 80% of the time in the month of July. This follows the weakest month, June, which shows a rising VIX just 25% of the time... Read More
Don't Ignore This Chart! July 07, 2014 at 09:42 AM
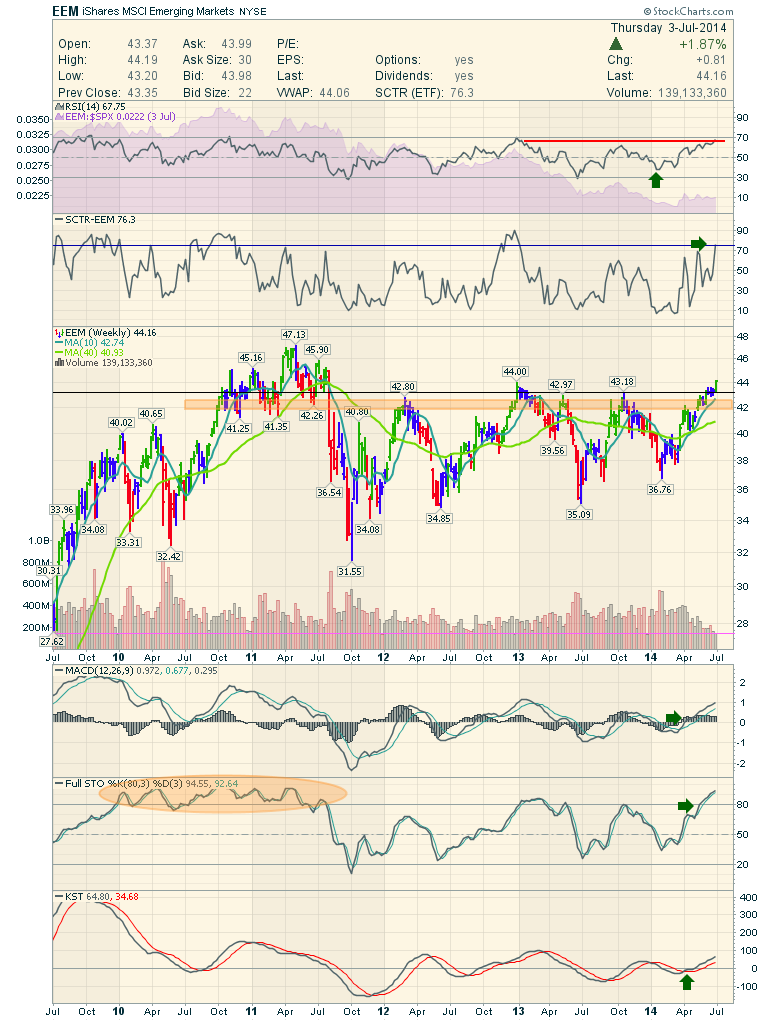
The Emerging Markets ETF (EEM) is an all encompassing ETF for the emerging markets. Currently, the world is very bullish, but the EEM has traded sideways for years. Recently, I published a blog on the EEM back in May. You can read that blog here by clicking through on this link... Read More
Don't Ignore This Chart! July 03, 2014 at 04:28 PM
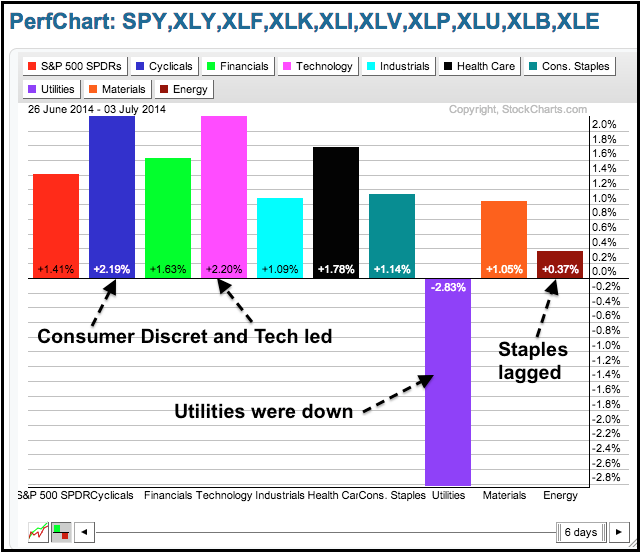
It was a short week, but stocks moved higher with eight of the nine sectors gaining. As the PerfChart below shows, the consumer discretionary and technology sectors led with 2+ percent gains. The utilities sector was the lone loser with a 2.83% loss... Read More
Don't Ignore This Chart! July 02, 2014 at 04:11 PM
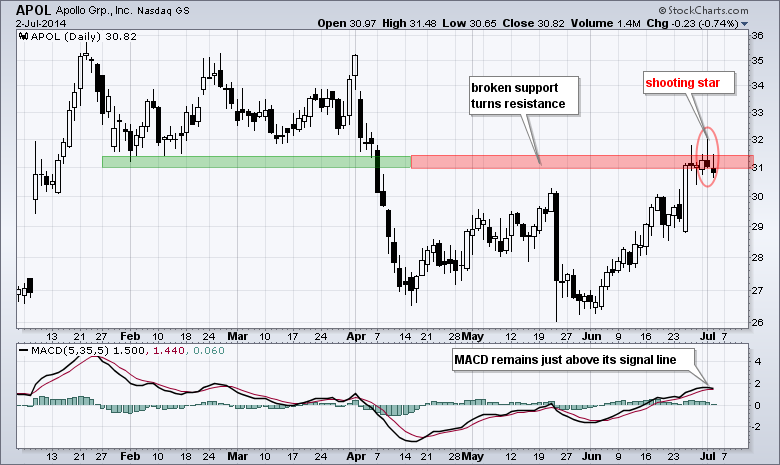
Apollo (APOL) hit resistance at broken support last week and then formed a shooting star this week. This shooting star represents a failed intraday rally. Notice how the stock surged to 32 on Tuesday and then fell to close near 31... Read More
Don't Ignore This Chart! July 01, 2014 at 10:35 AM
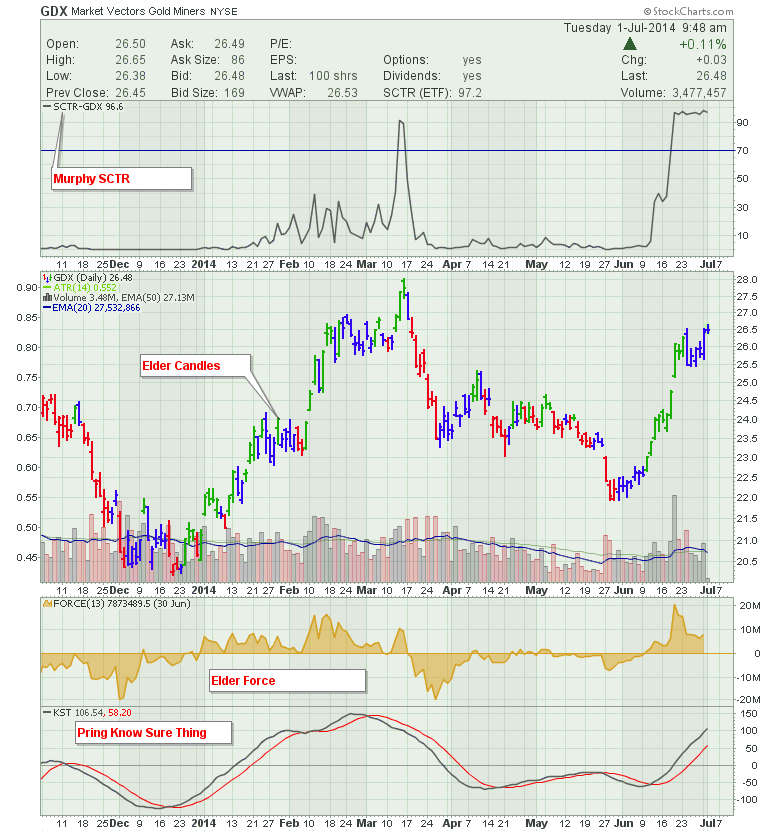
Gold. That shiny metal that is all the rage even when it is on a sell signal! Something caught my eye on the miners and it was that shiny little indicator SCTR. However, something is pretty compelling on this chart... Read More