Don't Ignore This Chart! October 30, 2015 at 09:49 AM
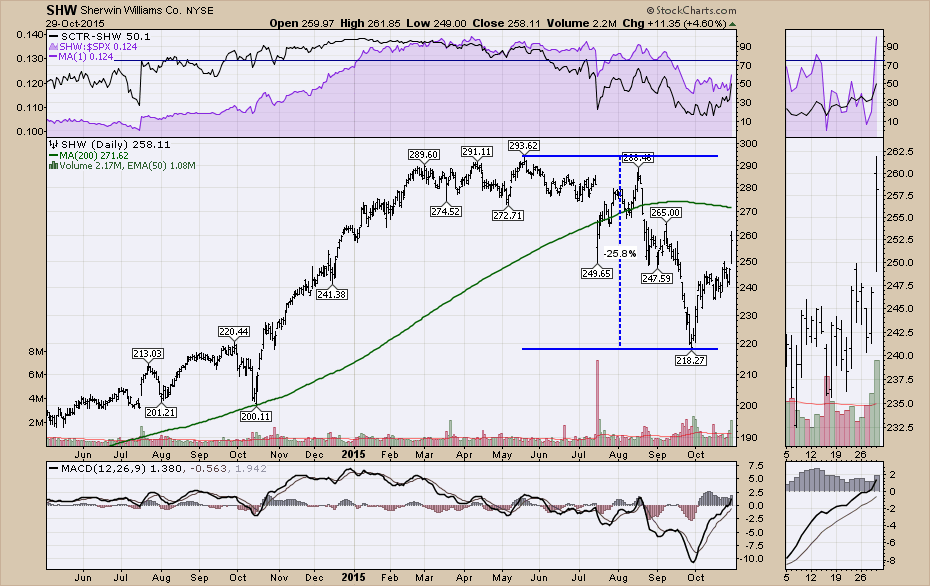
It has been a phenomenal run for Sherwin-Williams Co. (SHW). The 10-year chart has been a massive acceleration from bottom left to top right. Here is a link to the long chart. SHW 10 Year. Recently someone spilled a can of paint as the stock tumbled 25 % in a few months... Read More
Don't Ignore This Chart! October 29, 2015 at 12:53 PM
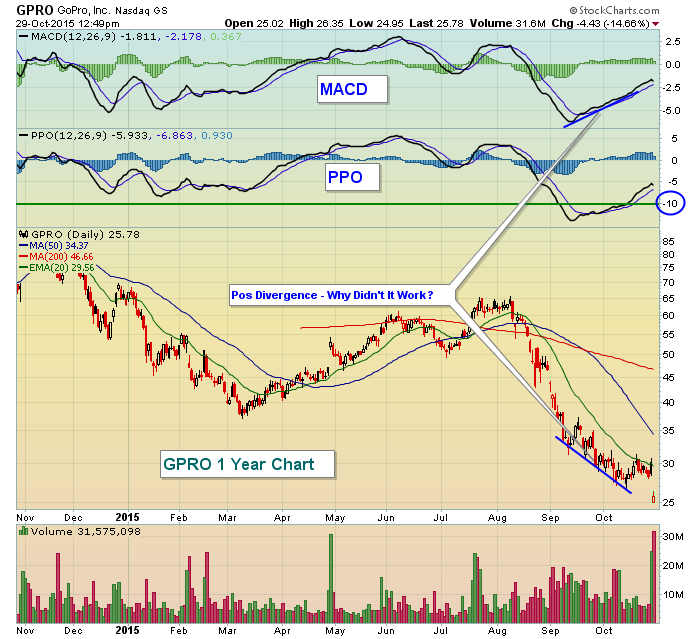
GPRO reported revenues and earnings that fell short of expectations after the bell last night and the reaction was about as you might expect - down 17% on the open. It's since recovered and is attempting to print a significant red hollow candle on massive volume... Read More
Don't Ignore This Chart! October 28, 2015 at 10:06 AM
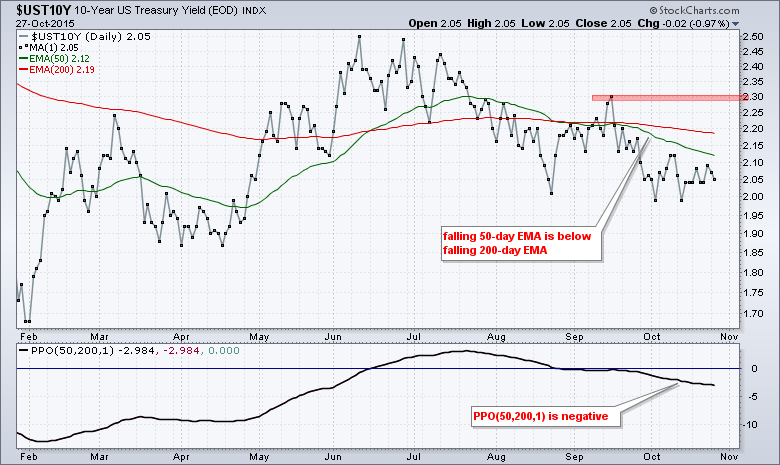
Treasury yields are in a clear downtrend since June, but a small anomaly is taking shape because the 30-year Treasury Yield ($UST30Y) did not confirm the lower low in the 10-year Treasury Yield ($UST10Y). The first chart shows the 10-yr yield peaking around 2... Read More
Don't Ignore This Chart! October 27, 2015 at 09:58 AM
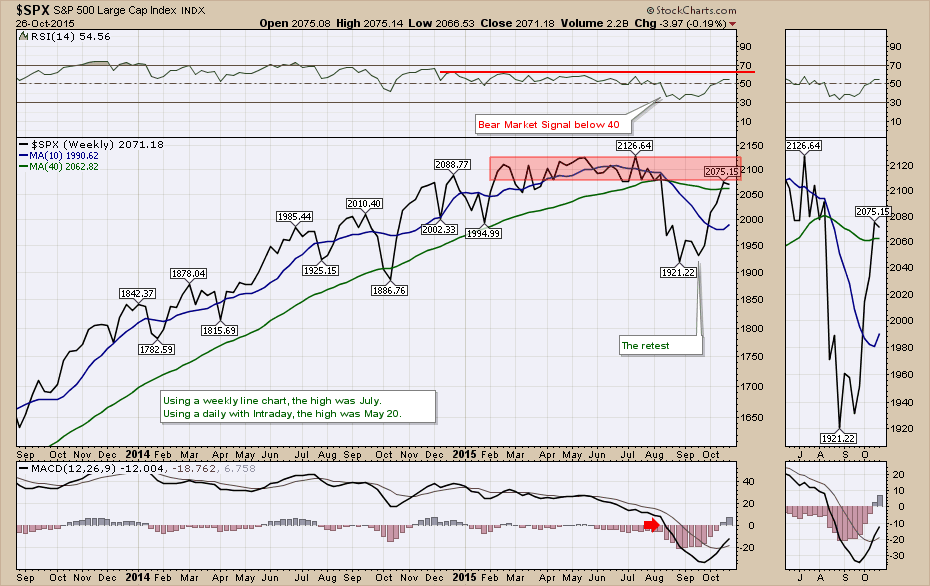
The market has given us some vicious reversals over the years from the 2009 lows. Arthur covered off some internal indicators in yesterday's article where he was looking for strength to show up... Read More
Don't Ignore This Chart! October 26, 2015 at 12:41 PM
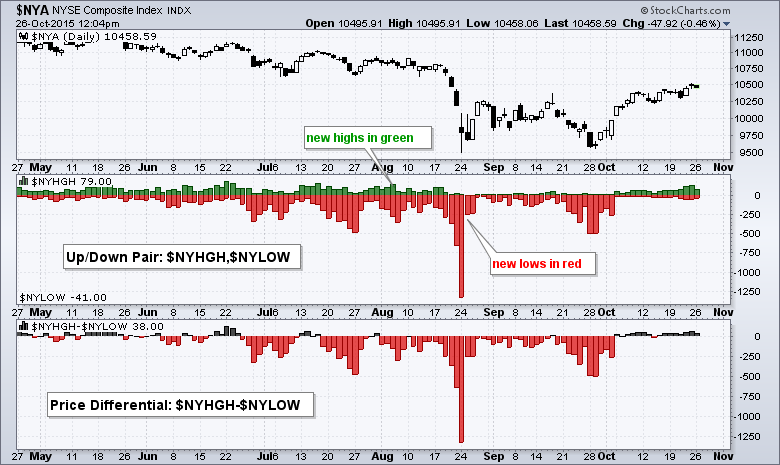
The percentage of NYSE net new highs remains at relatively low levels and chartists should watch this indicator for clues on follow through to the October surge. StockCharts users can plot new highs and new lows using SharpCharts... Read More
Don't Ignore This Chart! October 24, 2015 at 09:26 PM
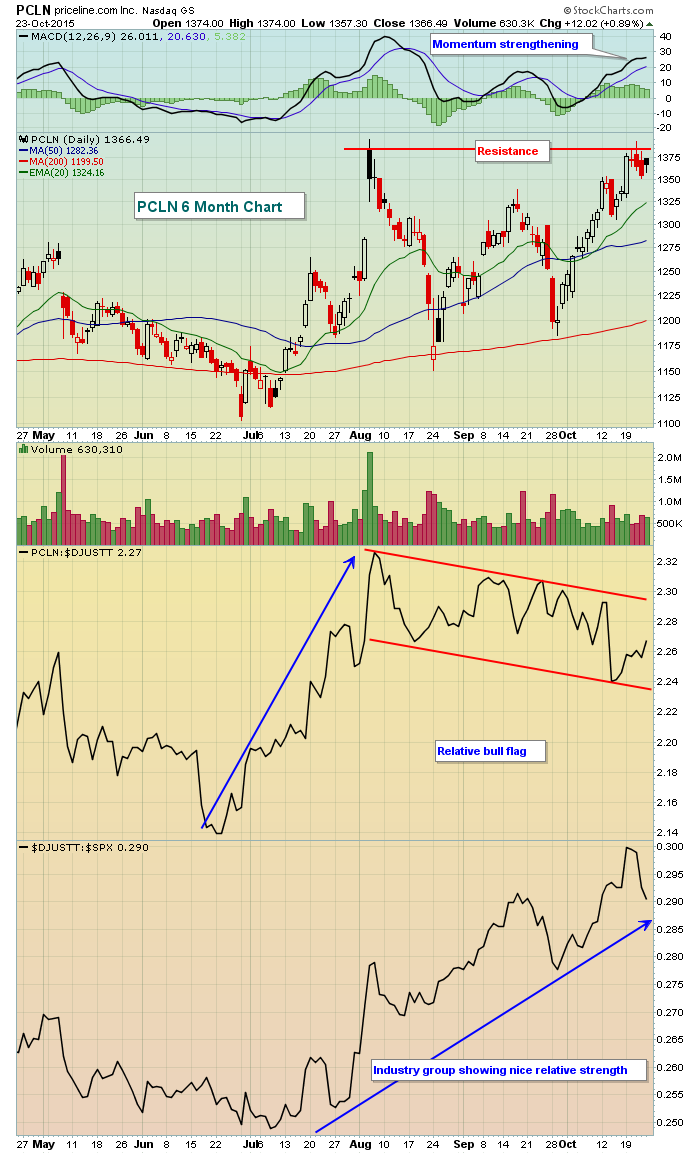
I don't like to place bets into earnings reports, but priceline.com (PCLN) sure does look to be a replica of Amazon (AMZN) and Google (GOOGL). AMZN and GOOGL both reported strong results in July and gapped significantly higher... Read More
Don't Ignore This Chart! October 23, 2015 at 10:24 AM
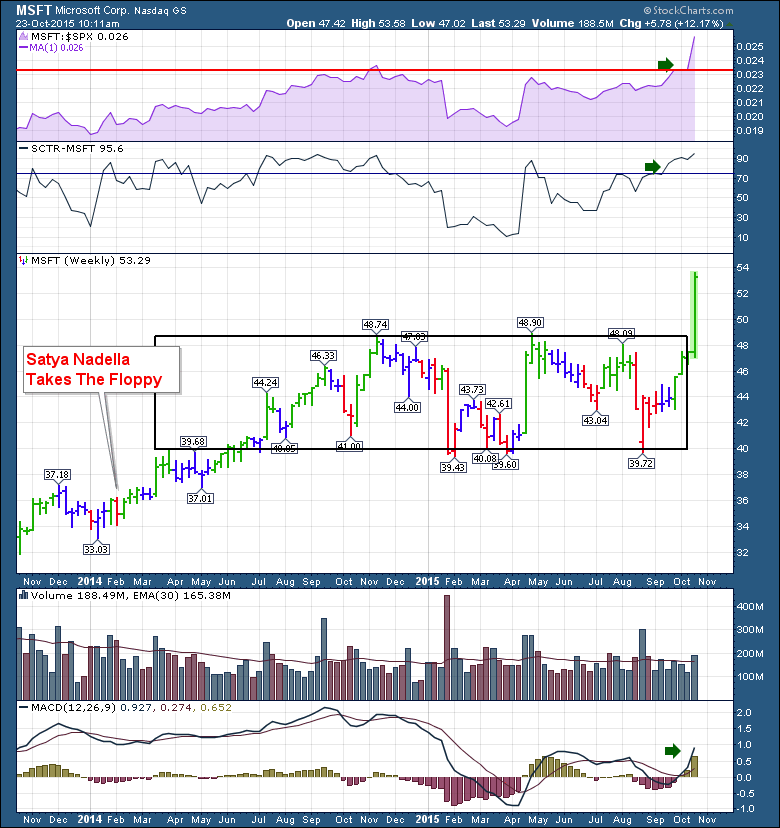
Microsoft reported outstanding earnings numbers yesterday and launched the stock near all-time highs this morning. After Satya Nadella took the floppy drive from Steve Ballmer on February 4, 2014, the stock ran up from $37 to $50... Read More
Don't Ignore This Chart! October 22, 2015 at 10:37 AM
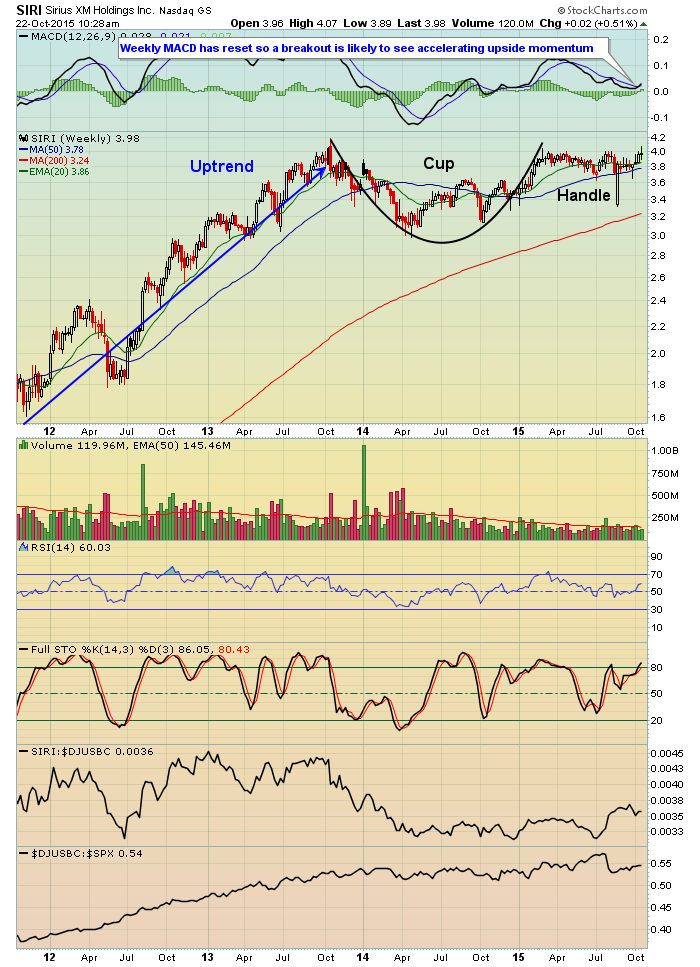
Sirius Satellite (SIRI) has been trying to clear the 4.00-4.10 resistance area for two years now. This consolidation or basing period is very bullish since it follows a period of rising prices. We need to see the breakout first, however... Read More
Don't Ignore This Chart! October 21, 2015 at 08:58 AM
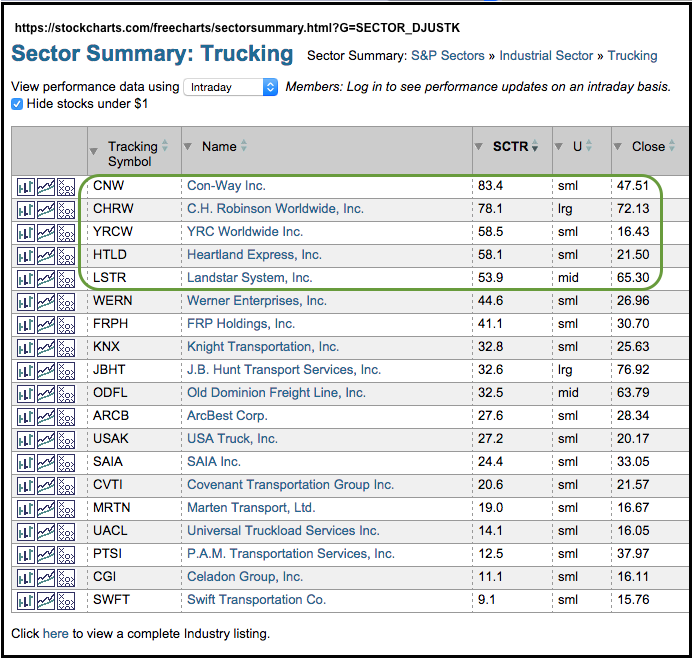
It has been a rough year for trucking stocks and most of these stocks are lagging the broader market. A look at the trucking stocks from the Sector Summary shows a handful with SCTRs above 50. The vast majority of SCTRs are 50... Read More
Don't Ignore This Chart! October 19, 2015 at 11:39 AM
It has been a rough two and a half months for the stock market with a major segment underperforming and one key industry group lagging. Semiconductors, however, are emerging as leaders within the technology sector... Read More
Don't Ignore This Chart! October 18, 2015 at 09:23 AM
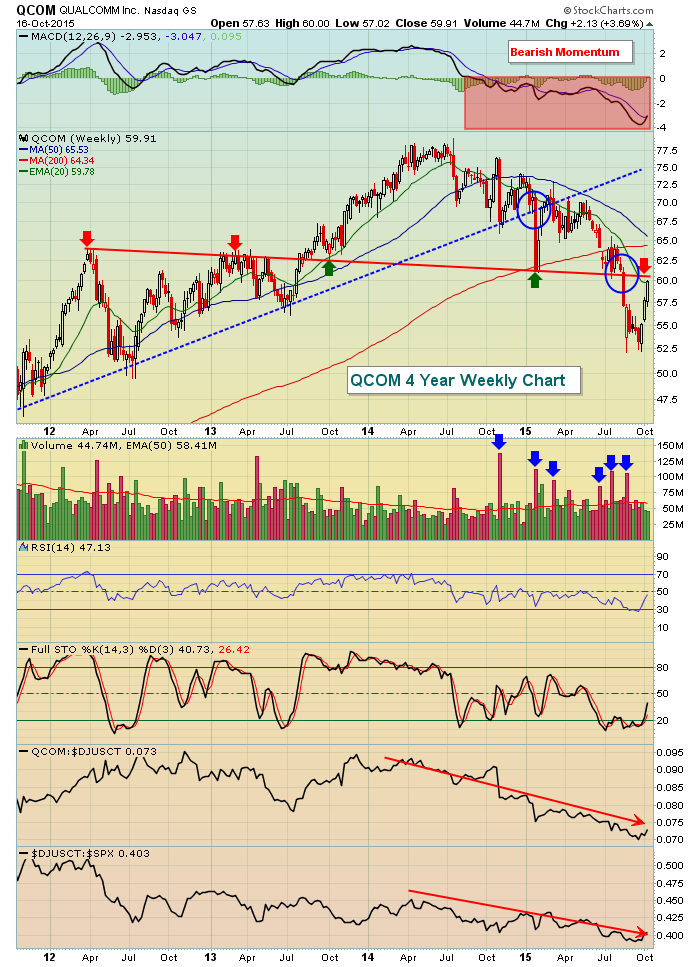
Over the past three weeks, Qualcomm (QCOM) has rallied from a low of 52.17 to Friday's close at 59.91 - barely eclipsing the falling 20 week EMA currently at 59.78... Read More
Don't Ignore This Chart! October 16, 2015 at 06:43 PM
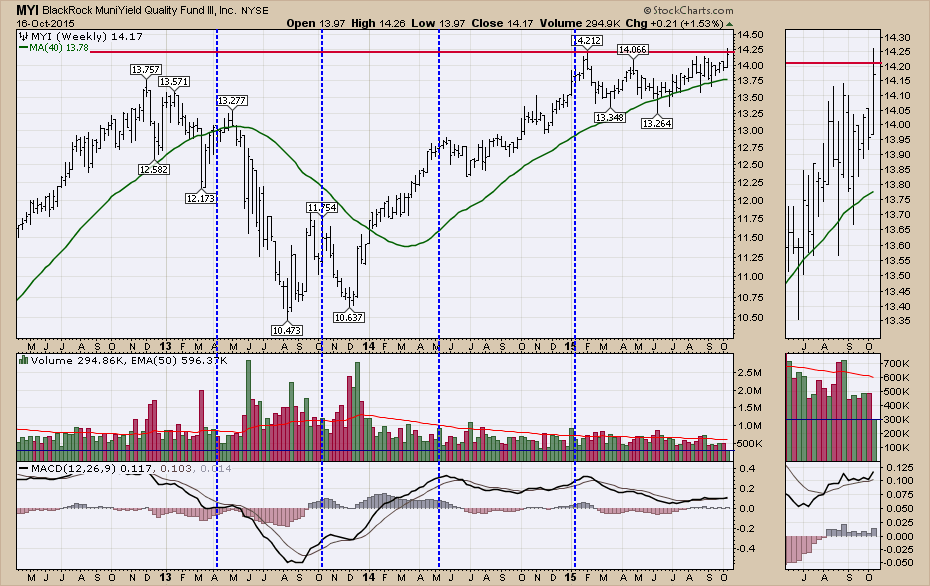
BlackRock runs a Municipal Bond Fund (MYI) that I follow. When these municipal bond funds are rallying to new 52 week highs, I interpret the leadership position as a defensive one, not an offensive one for the equities market generally... Read More
Don't Ignore This Chart! October 15, 2015 at 09:21 PM
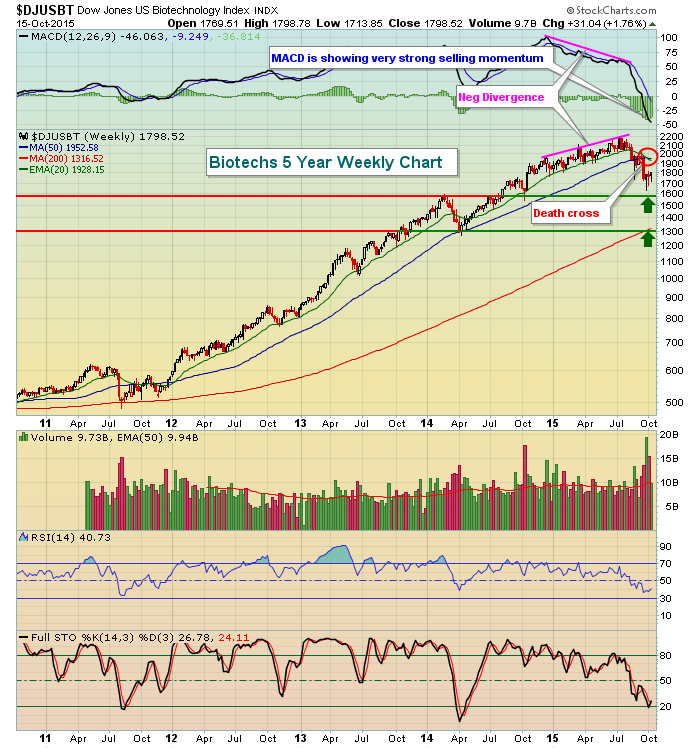
The technical conditions surrounding biotechs ($DJUSBT) are bad, no sugar-coating here. It's not pictured below but the DJUSBT did manage to clear 20 day EMA resistance on today's close... Read More
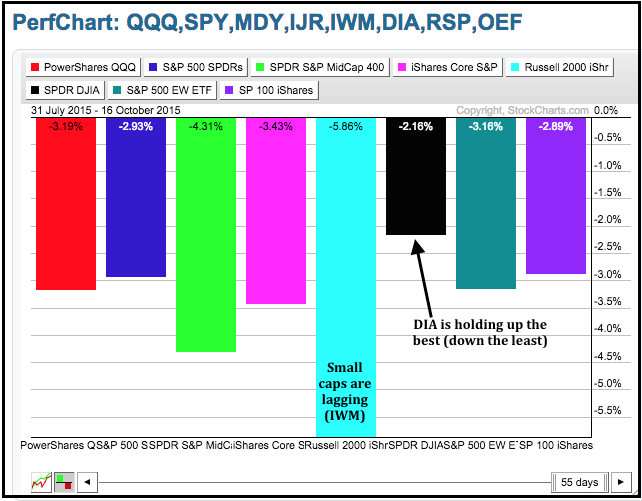
Don't Ignore This Chart! October 14, 2015 at 07:20 AM
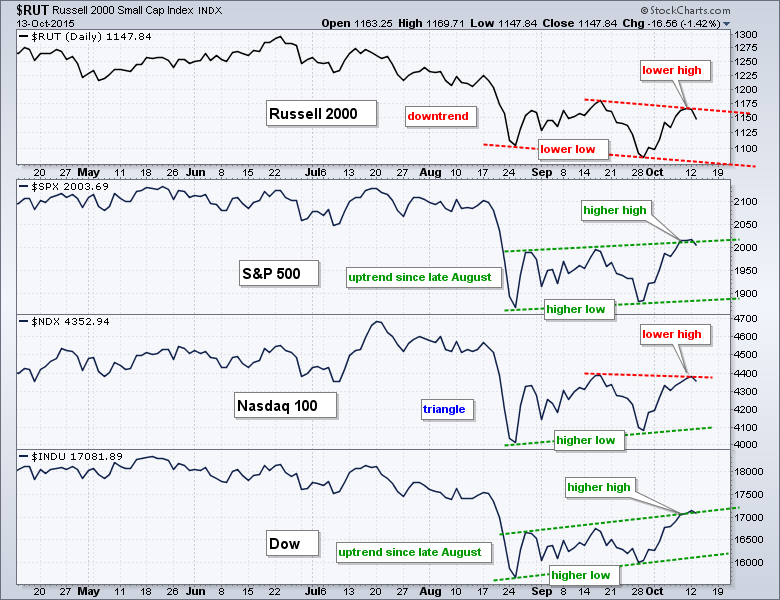
Price action has been rather volatile since the August breakdown, but some performance discrepancies are emerging in October and these could foreshadow broad market weakness... Read More
Don't Ignore This Chart! October 13, 2015 at 11:48 AM
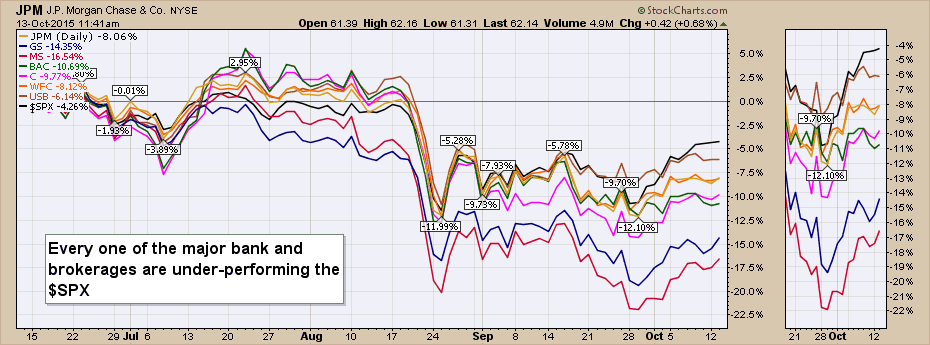
The earnings reports from companies roll out in earnest this week and the banks are one of the largest question marks. This performance chart shows all the major banks and brokers underperforming the $SPX since the test of the May high failed in June... Read More
Don't Ignore This Chart! October 12, 2015 at 11:09 AM
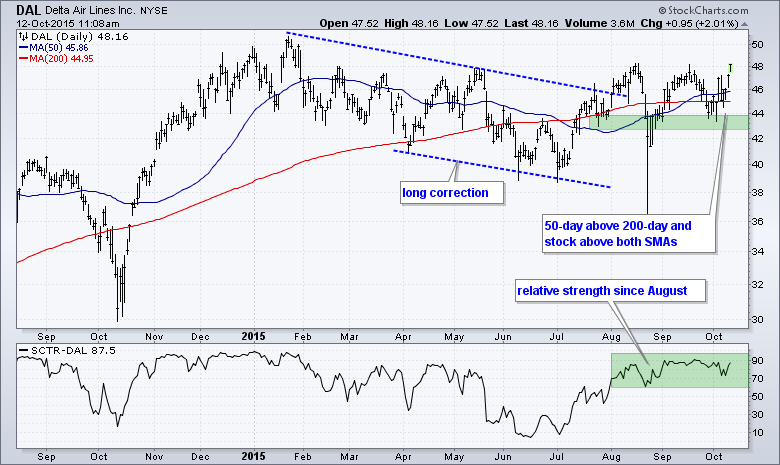
Airline stocks are on the move Monday with nice gains across the board. Hawaiian Airlines (HA) and Skywest (SKYW) are leading the way with breakouts and 52-week highs today... Read More
Don't Ignore This Chart! October 11, 2015 at 12:28 PM
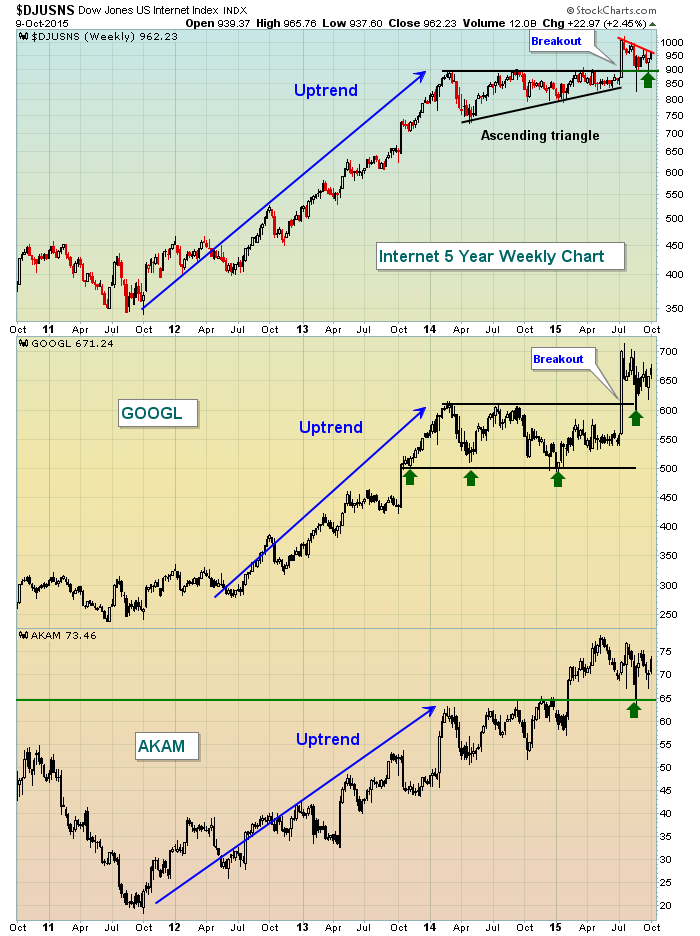
The long-term pattern is bullish. Short-term technical conditions are improving. And the season is right as October is the best calendar month of the year in terms of historical performance for internet stocks. The Dow Jones U.S... Read More
Don't Ignore This Chart! October 09, 2015 at 10:39 AM
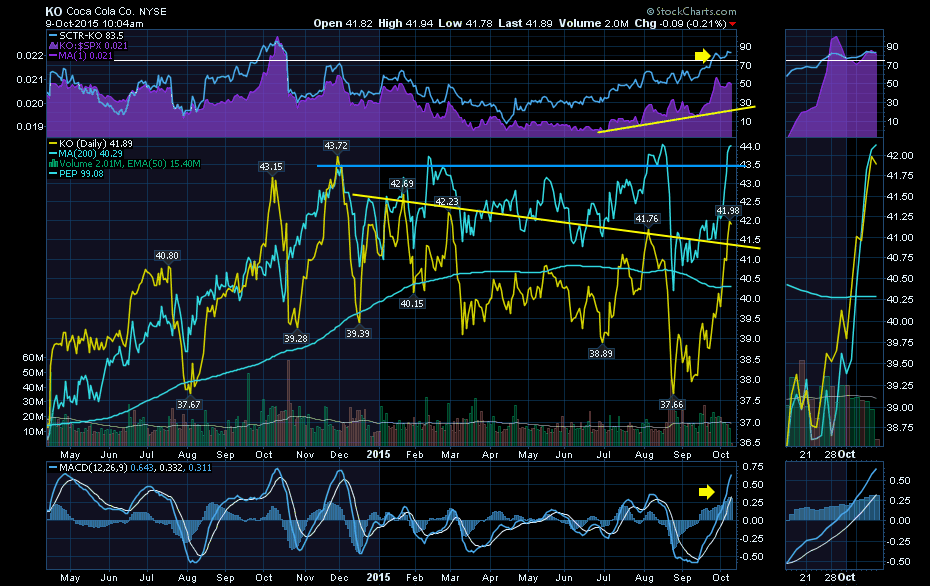
There has been some fizz in both Coke (KO) and Pepsi (PEP) as they both look to break above trend lines and prior highs. On the chart below, all the indicators are for KO shown in Yellow and you can see Coke is breaking above previous highs and the down sloping trend line... Read More
Don't Ignore This Chart! October 08, 2015 at 11:05 AM
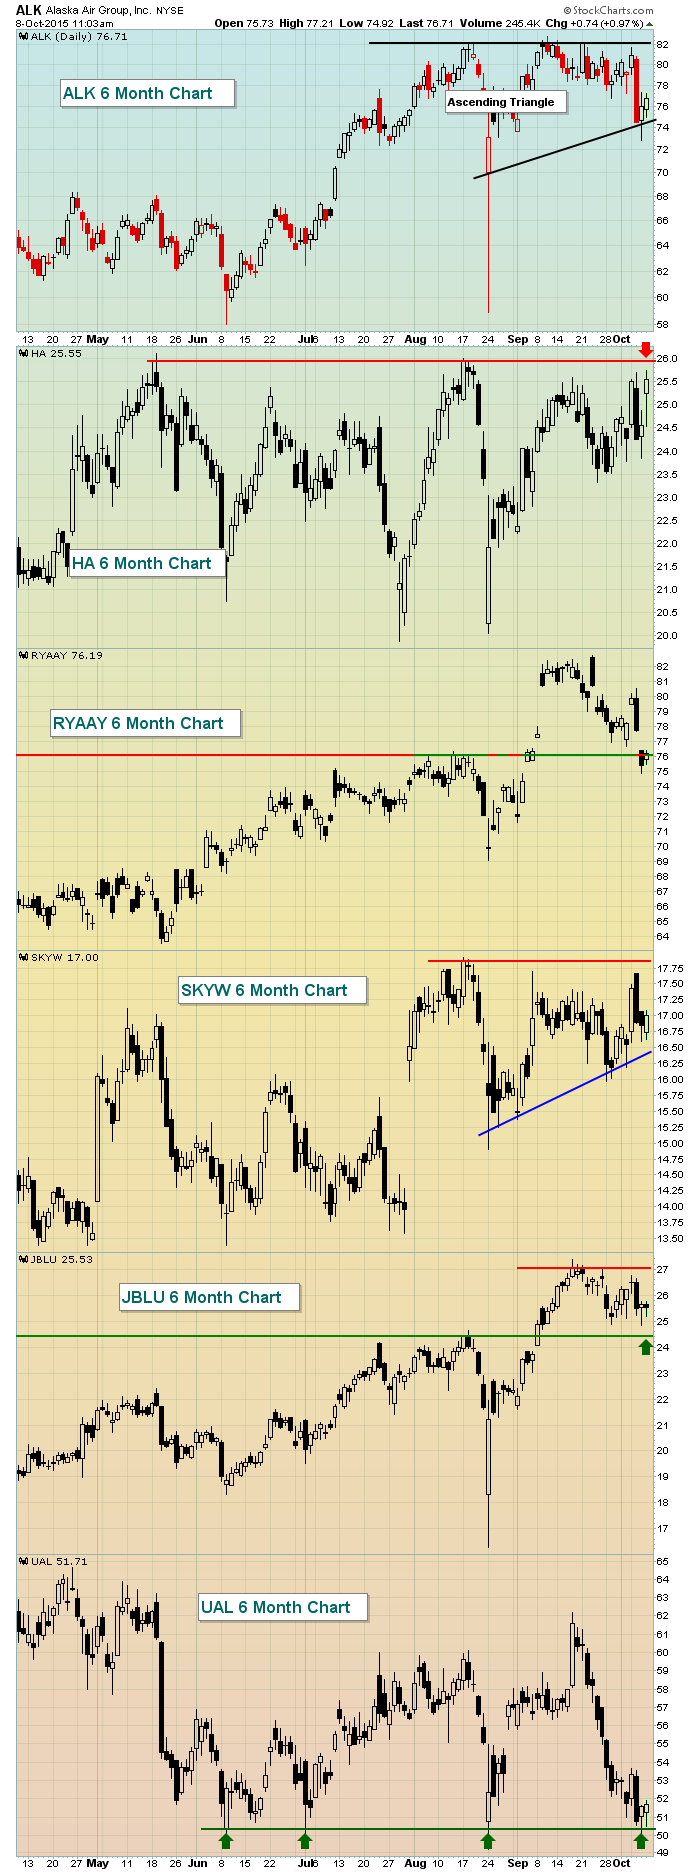
Airlines ($DJUSAR) have traded sideways to down most of 2015. Yet this industry group is one of the best performers historically in the month of October. Furthermore, several airline stocks are in bullish patterns OR are approaching key technical levels of support/resistance... Read More
Don't Ignore This Chart! October 07, 2015 at 08:47 AM
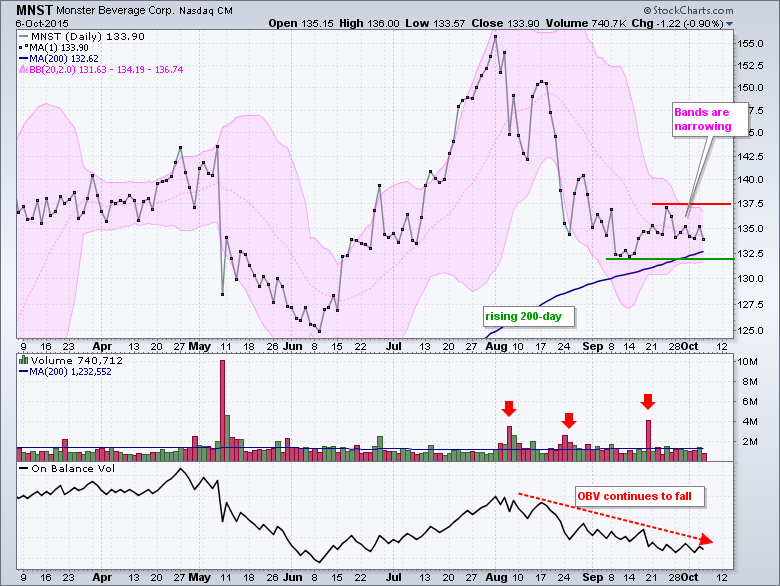
Monster Beverage (MNST) did not partake in the early October surge and a key volume indicator suggests that distribution is underway. Let's start with the price chart. MNST fell sharply in August and then firmed just above the rising 200-day moving average in September... Read More
Don't Ignore This Chart! October 06, 2015 at 11:17 AM
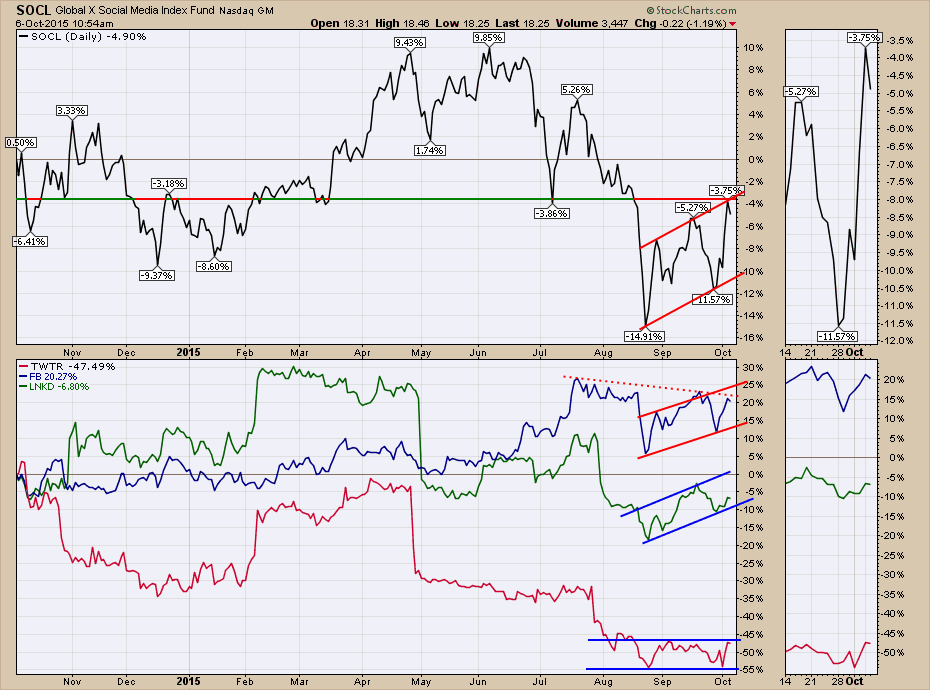
The Social Media ETF (SOCL) has been working lower for the last 3 months. Off the recent lows, the SOCL ETF has really pushed higher with big influence by Facebook (FB) and LinkedIn (LNKD). It is testing an important horizontal support/resistance level right now... Read More
Don't Ignore This Chart! October 05, 2015 at 11:09 AM
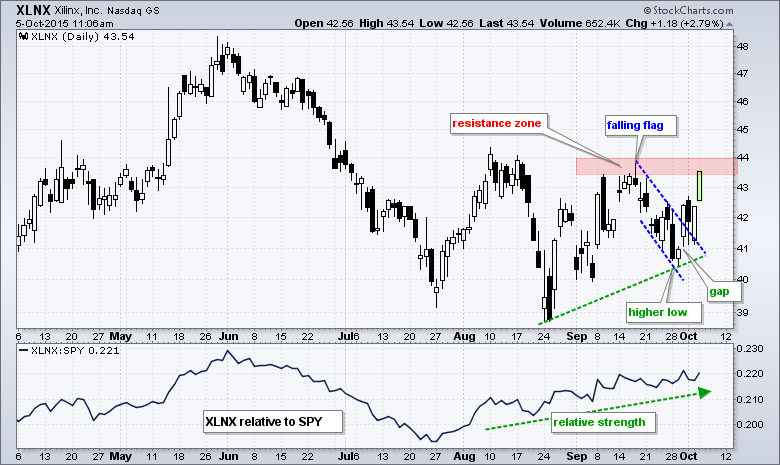
Stock market declines are good because they expose the weak hands and highlight potentially strong stocks. Stocks that hold up during a broad market decline show relative strength and this could lead to outperformance when the market turns up again... Read More
Don't Ignore This Chart! October 03, 2015 at 03:11 PM
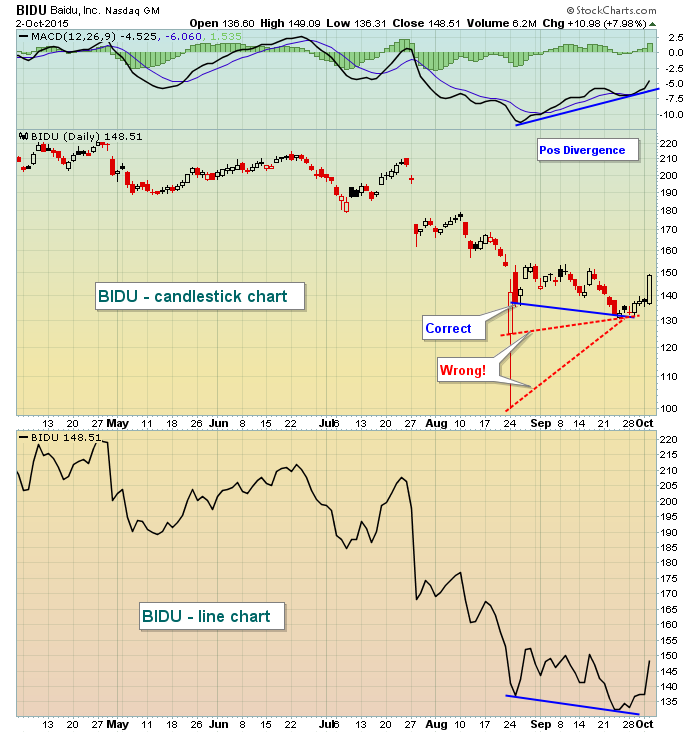
In evaluating whether a positive (or negative) divergence exists on a chart, you must remember to use closing prices. If you use candlesticks like I do, it's not always easy to spot divergences. I'll give you an example - Baidu (BIDU)... Read More
Don't Ignore This Chart! October 01, 2015 at 12:15 PM
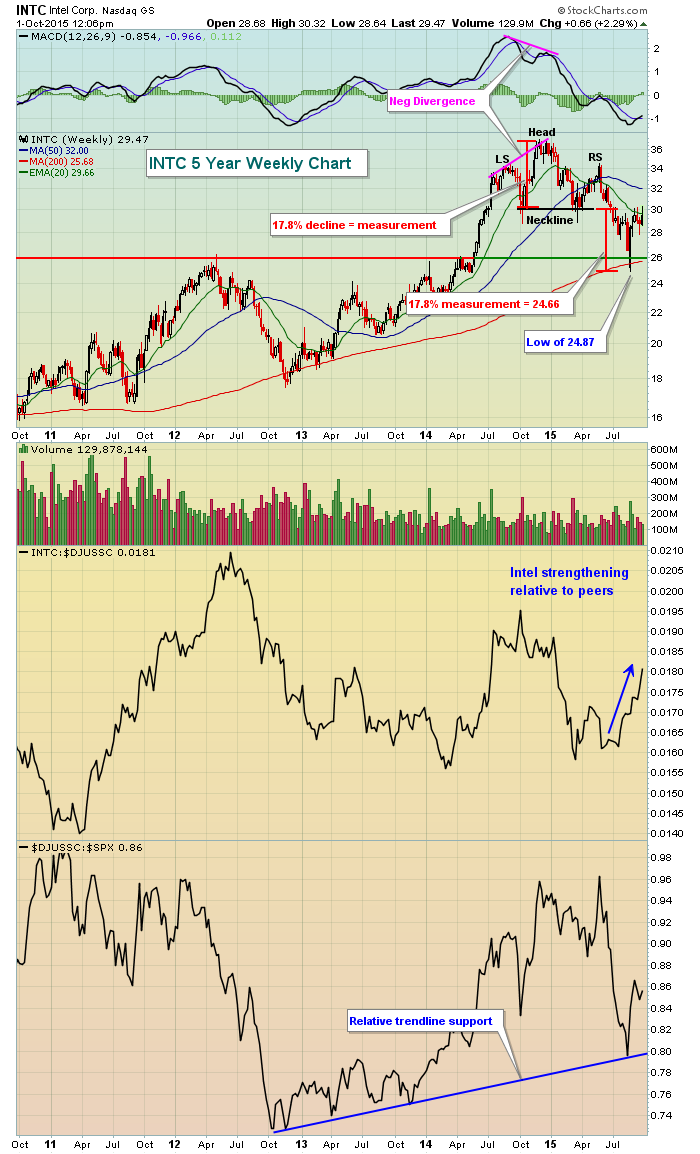
Actually, this chipmaker's chart looks very strong, especially longer-term. After a strong advance in late 2014, a negative divergence emerged and was followed by a topping head & shoulders pattern... Read More