Don't Ignore This Chart! November 30, 2015 at 11:45 AM
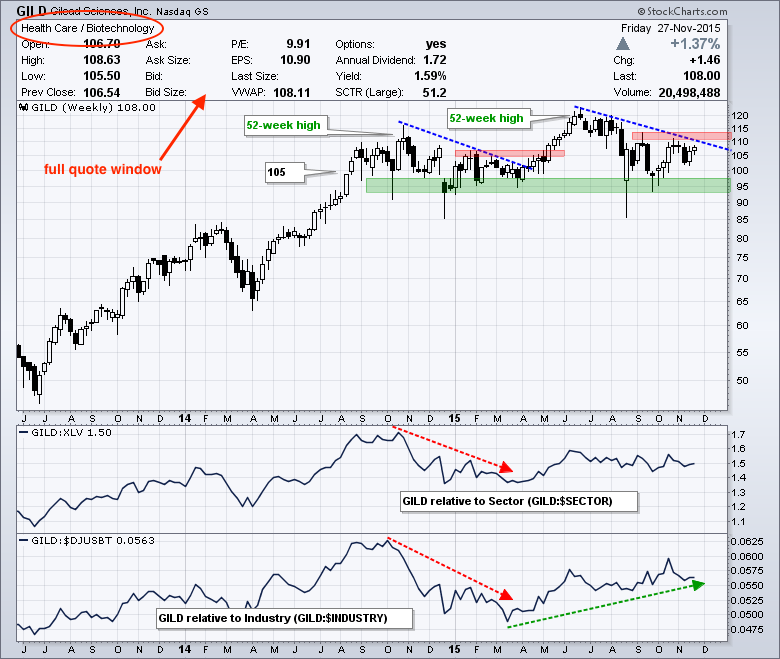
Gilead is up for the most boring biotech award because the stock has traded relatively flat since September 2014. Despite numerous crosses of the 105 area, the overall trend is still up and chartists should watch for a breakout to signal a continuation of this uptrend... Read More
Don't Ignore This Chart! November 29, 2015 at 12:14 PM
The first thing to investing or trading smarter is understanding your own personal strategy - what works best for you... Read More
Don't Ignore This Chart! November 26, 2015 at 08:55 PM
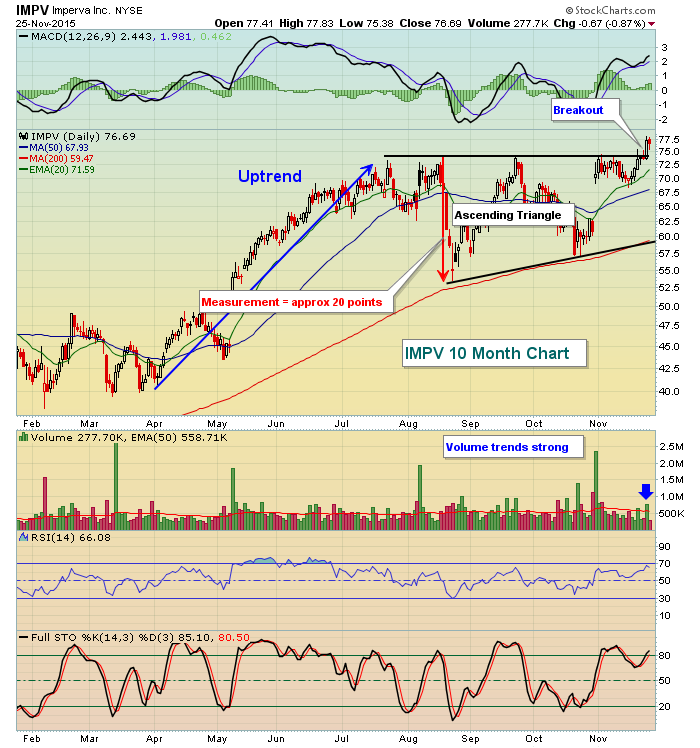
Imperva Inc (IMPV) made a steady move higher from April through July before consolidating in a very bullish ascending triangle continuation pattern over the past four months. On Tuesday, volume accelerated and triangle resistance near 74... Read More
Don't Ignore This Chart! November 26, 2015 at 12:50 PM
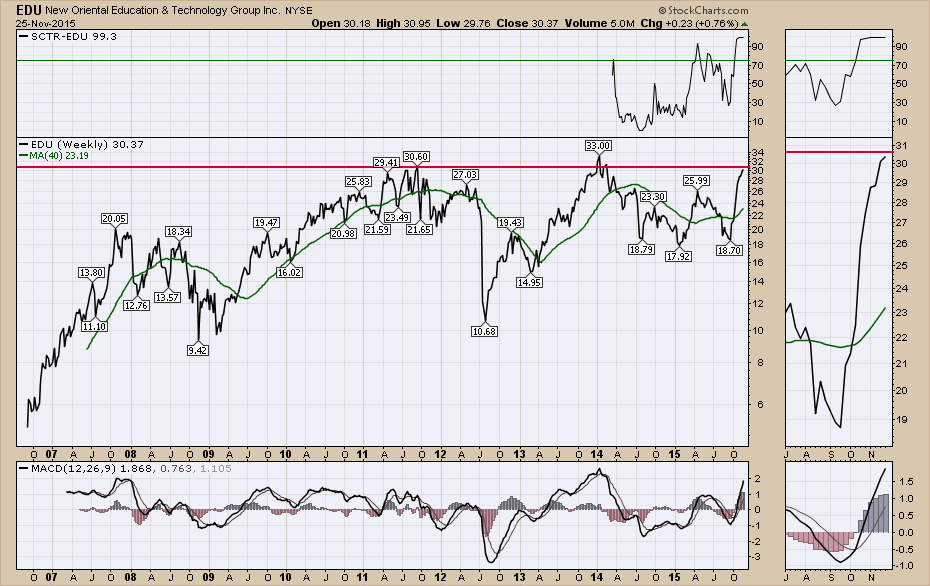
New Oriental Education and Technology (EDU) has been a high-flying stock before. StockCharts.com moved it into the Mid Cap Group for an SCTR ranking and that has currently surged to 99.3. That is a really strong ranking and we can see it made new 52 week highs in mid-October... Read More
Don't Ignore This Chart! November 25, 2015 at 11:40 AM
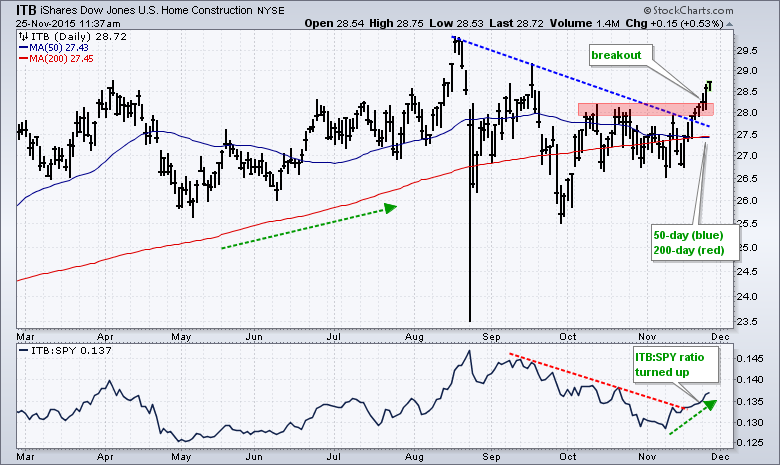
After lagging the market in October, the Home Construction iShares (ITB) is perking up with a breakout on the price chart and upturn in the price relative. ITB peaked in August and fell into September... Read More
Don't Ignore This Chart! November 24, 2015 at 12:46 PM
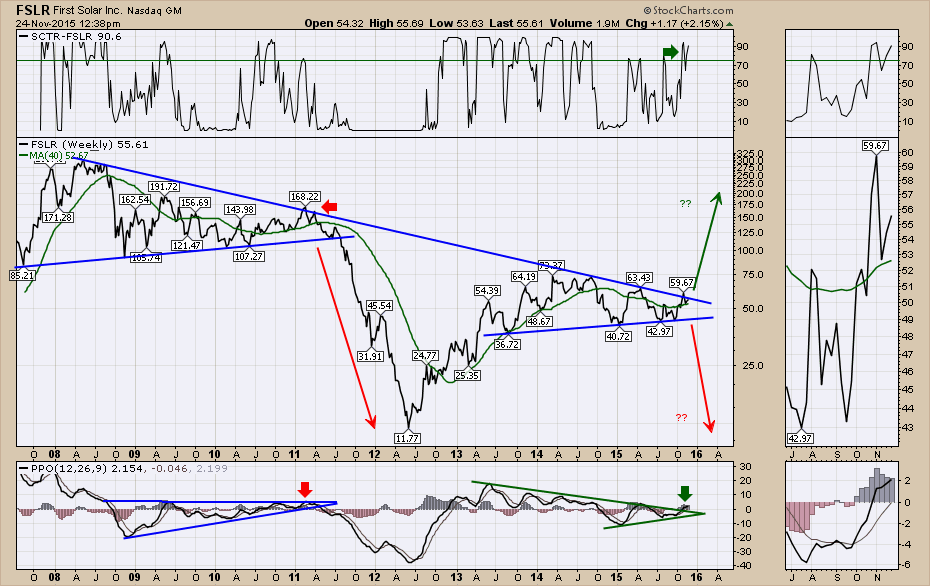
First Solar (FSLR) looks very interesting here. This stock has been down drafting on the back of lower energy across the industry group. However, it might be time to think about FSLR above $60. The SCTR is back above 75 so it might have the momentum to break out... Read More
Don't Ignore This Chart! November 23, 2015 at 10:48 AM
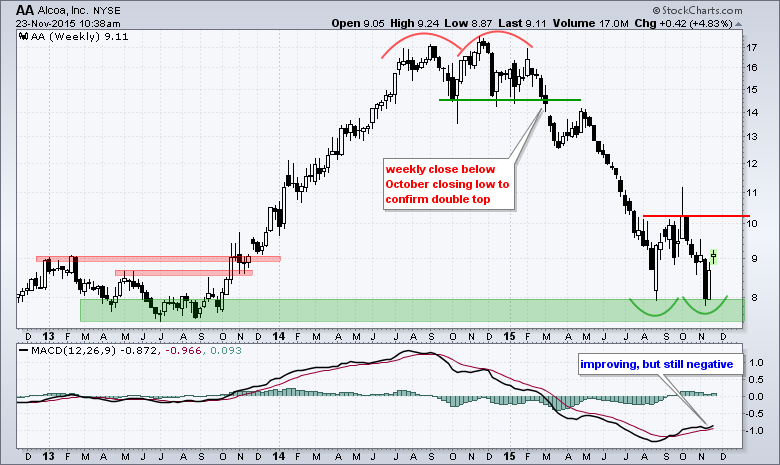
The overall trend for Alcoa is currently down, but the ETF is showing signs of life with a bullish reversal pattern taking shape. The chart shows AA making a round trip from 8 to 8 with a double top at 17 in between... Read More
Don't Ignore This Chart! November 22, 2015 at 08:50 AM
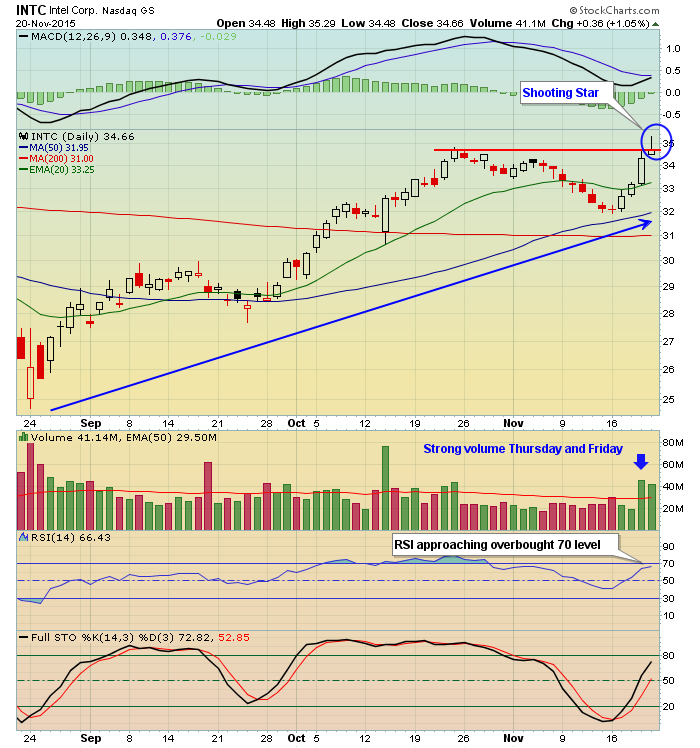
After gapping up off its recent uptrend, the buying continued on Intel (INTC) intraday on Friday as it surged to a high of 35.29. By day's end, however, INTC closed at 34.66 - EXACTLY where it closed on its recent high on October 23rd... Read More
Don't Ignore This Chart! November 20, 2015 at 10:04 PM
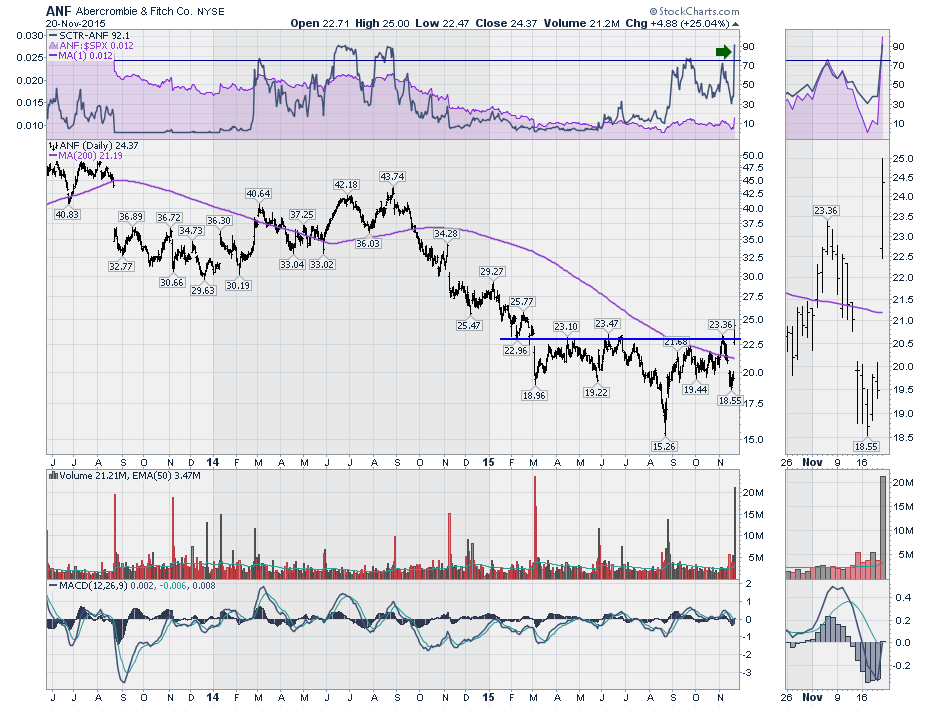
Abercrombie and Fitch (ANF) popped above an 8 month base in what can only be described as a breakout. The apparel retailer industry group only had one stock with an SCTR above 65 yesterday. What a difference a day makes. Now Abercrombie is leading the group... Read More
Don't Ignore This Chart! November 19, 2015 at 11:49 AM
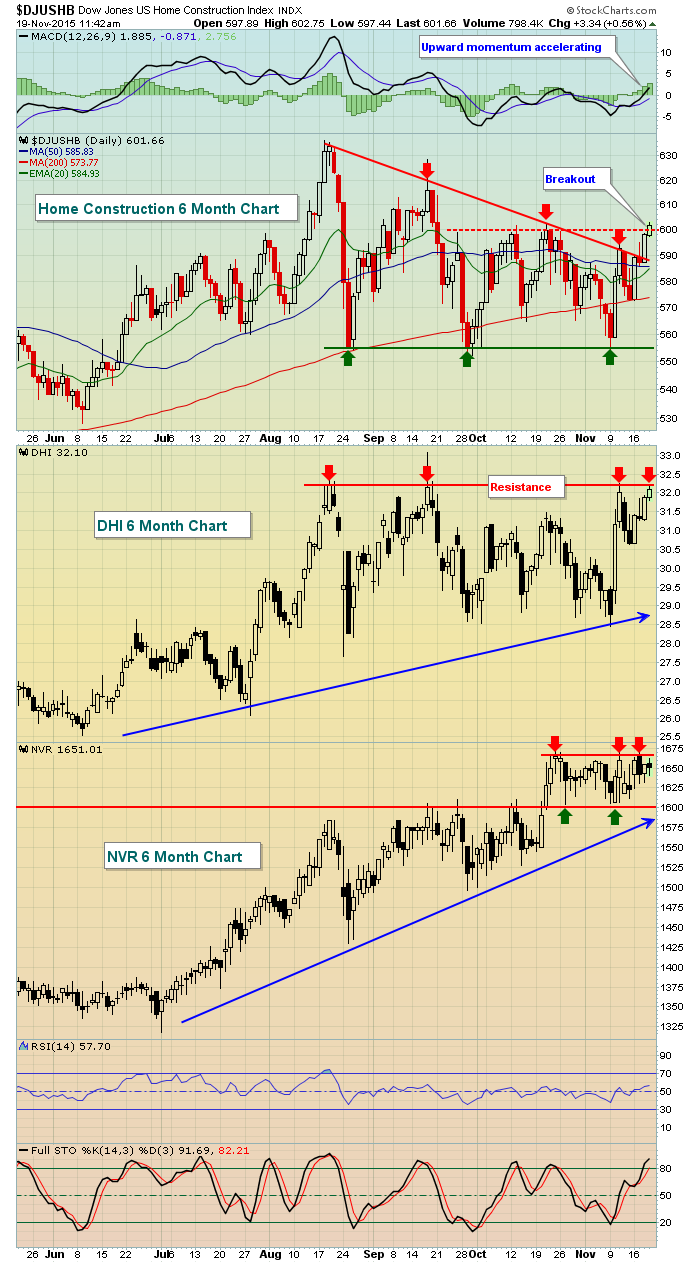
The Dow Jones U.S. Home Construction index ($DJUSHB) hit its highest level in two months this morning and a close above 600 would likely signal more strength to come... Read More
Don't Ignore This Chart! November 18, 2015 at 11:42 AM
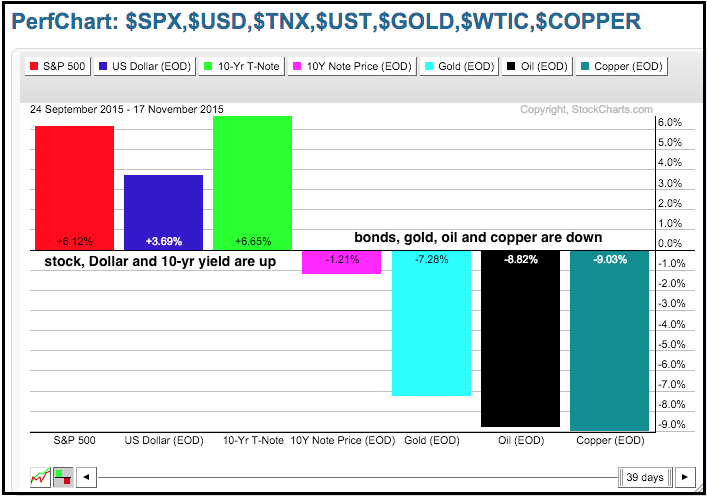
The PerfChart below tells the story for the Dollar, Treasury bonds and commodities since late September... Read More
Don't Ignore This Chart! November 17, 2015 at 10:09 AM
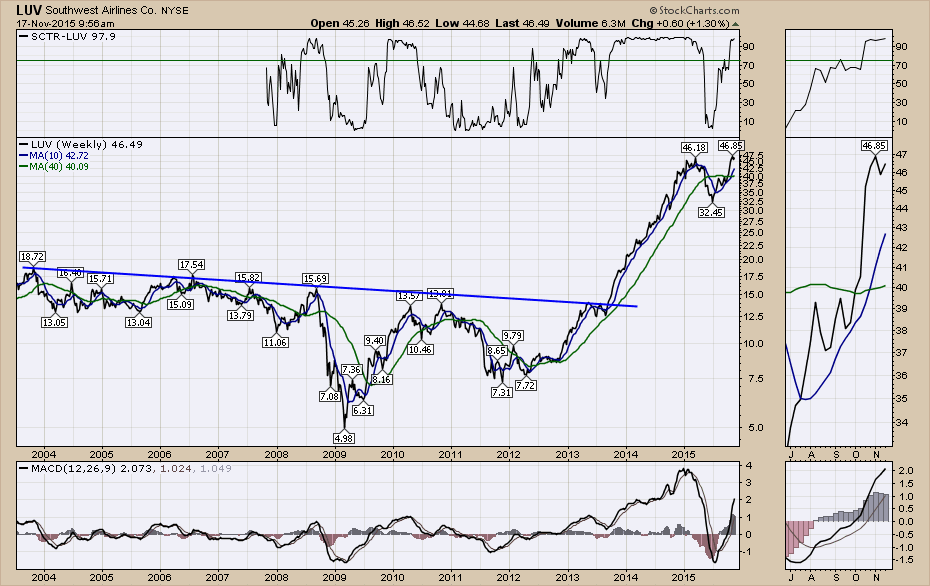
Southwest Airlines (LUV) has been one of the few airline stories where investors have been able to make money since 2012 from buy and hold. Through the summer of 2015 Southwest had one of its biggest selloffs in 3 years... Read More
Don't Ignore This Chart! November 16, 2015 at 12:08 PM
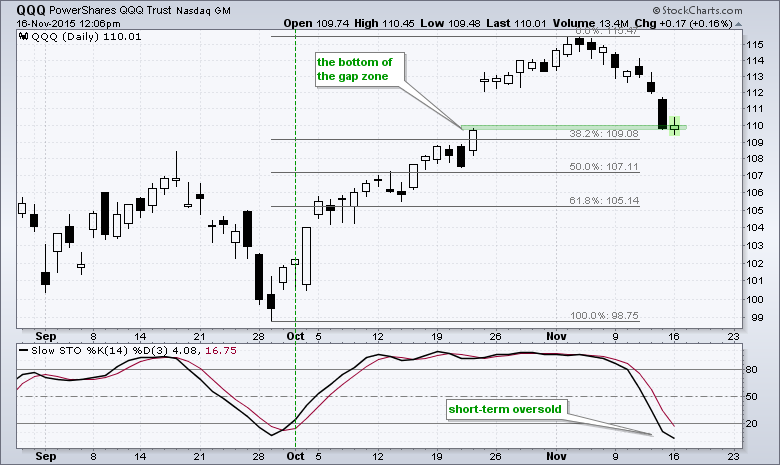
The Nasdaq 100 ETF (QQQ) was hit quite hard last week, but the ETF is making an attempt to firm on Monday and chartists should watch three things. First, the ETF gapped up and surged above 115... Read More
Don't Ignore This Chart! November 14, 2015 at 05:26 PM
Retailers were rocked on Friday with the five worst performing industry groups all in the retail space. The S&P Retail index (XRT) dropped nearly 4% on Friday and more than 8% last week... Read More
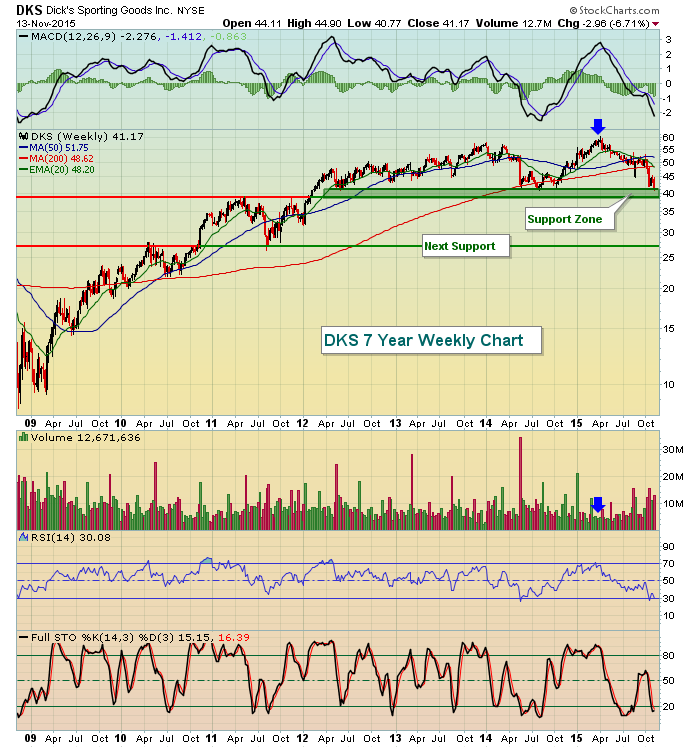
Don't Ignore This Chart! November 13, 2015 at 11:44 AM
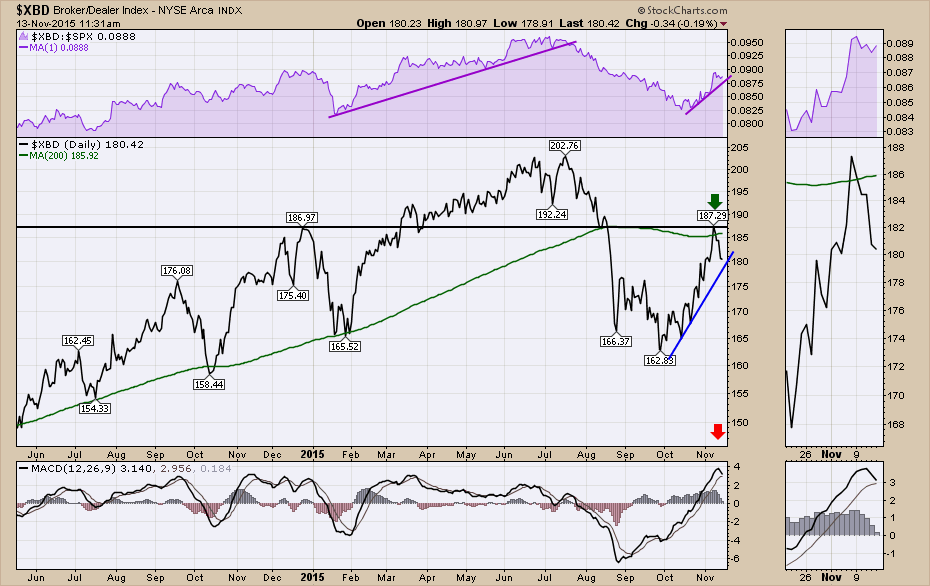
In bull markets, brokers do very well. On the back of the recent rate rise, the Broker-Dealer Index ($XBD) ran up to test the 200 DMA. Now the chart warrants close scrutiny... Read More
Don't Ignore This Chart! November 12, 2015 at 07:00 PM
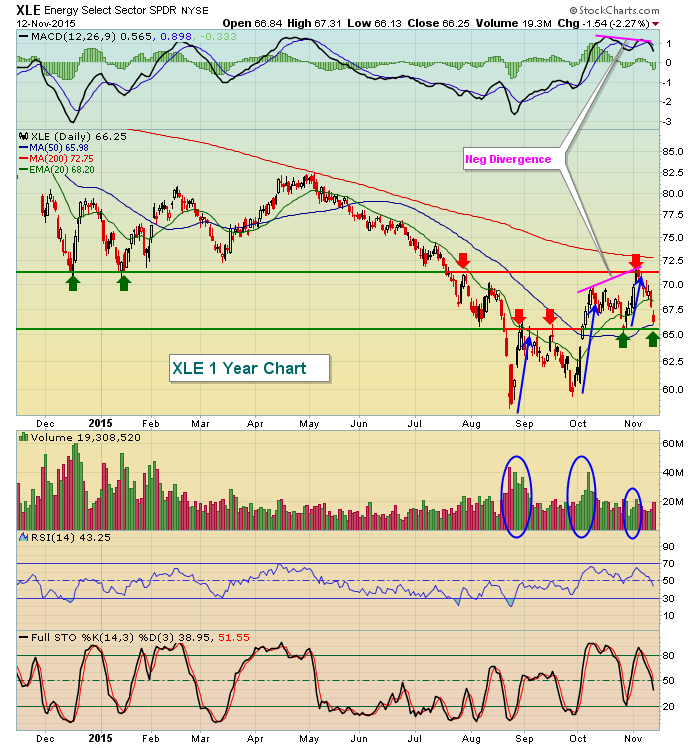
Prior to this week, energy had seen its strongest rebound since topping in June 2014. But a long-term negative divergence and slowing volume suggested the rally was long in the tooth. After hitting nearly 72.00, the XLE has retreated and the energy bulls will now be tested... Read More
Don't Ignore This Chart! November 11, 2015 at 12:21 PM
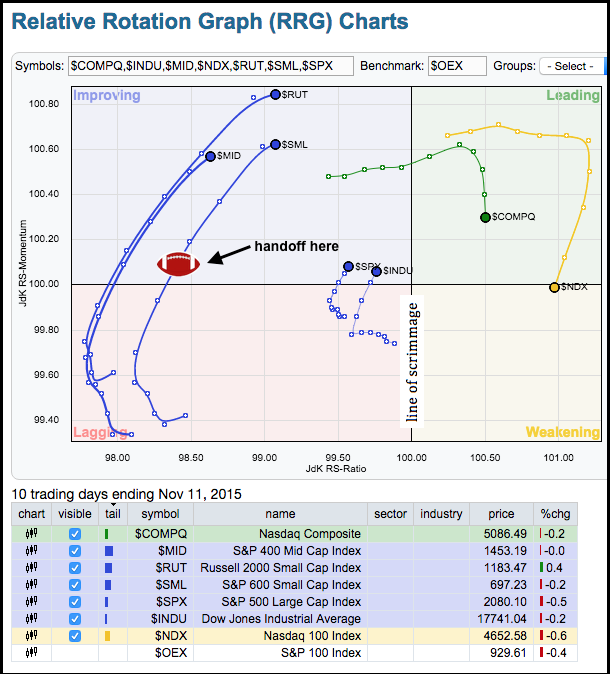
Small-caps are still underperforming large-caps, but the small and mid-cap indices moved into the improving quadrant on the Relative Rotation Graph (RRG) with a classic end-around play. Just go to YouTube if you need to review this play... Read More
Don't Ignore This Chart! November 10, 2015 at 10:35 AM
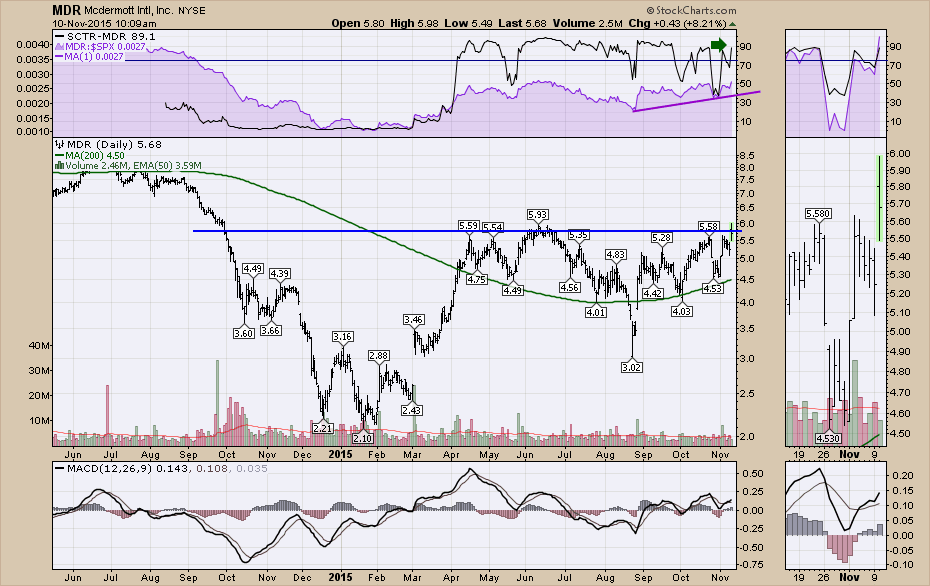
Scanning through the list of new highs this morning, I noticed McDermott International (MDR) had a really nice chart pattern. The stock had an initial thrust off the lows and has quietly built a base supported by the 200 DMA... Read More
Don't Ignore This Chart! November 09, 2015 at 11:06 AM
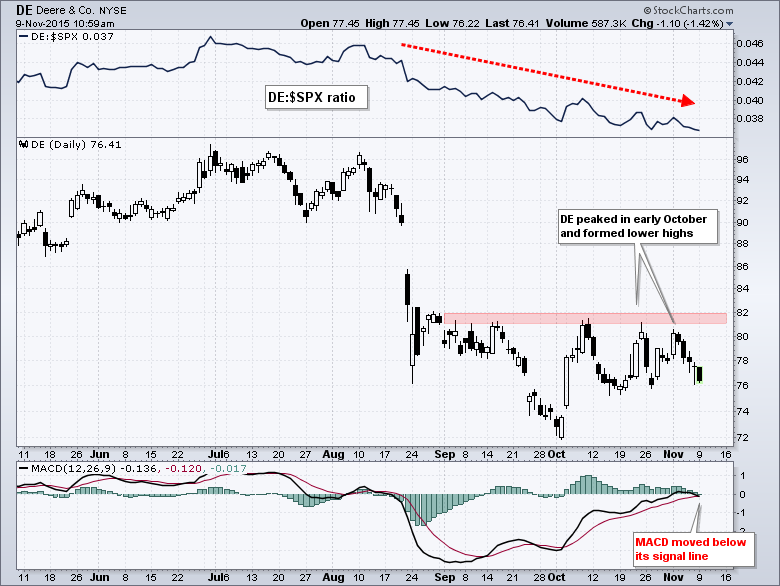
Deere (DE) is not keeping pace with broader market and a bearish momentum signal just triggered. Deere was hit with the rest of the stock market in August and fell sharply. This was normal because the broad market was under intense selling pressure... Read More
Don't Ignore This Chart! November 08, 2015 at 10:15 PM
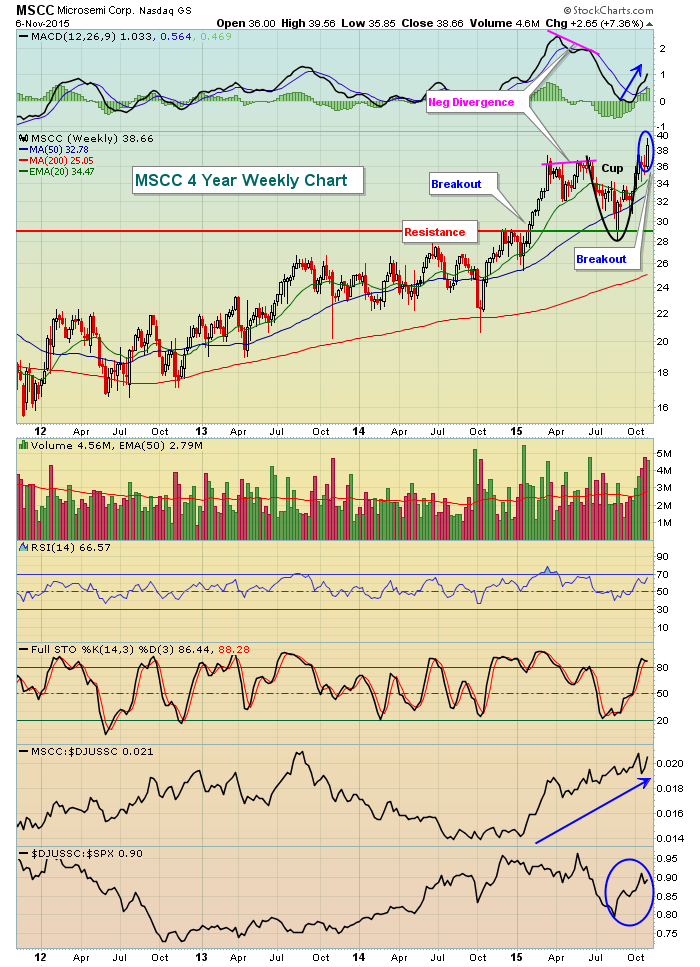
Semiconductors have been one of the hottest areas of the market off the August low and especially during the month of October. That's created a number of trading opportunities in the space... Read More
Don't Ignore This Chart! November 06, 2015 at 11:59 AM
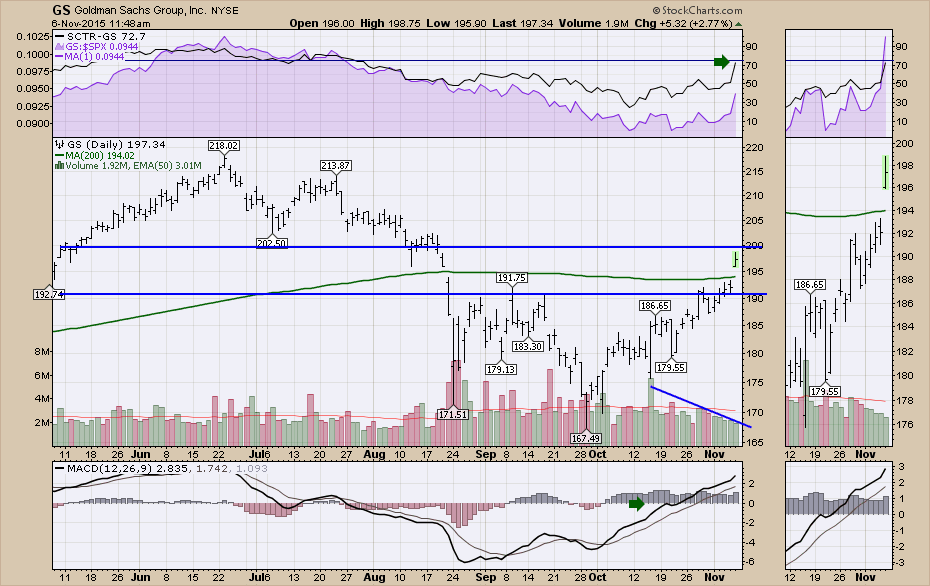
With the jobs report this morning being so good, the financials were off to the races on the news of a probable interest rate rise from the Fed in December. Goldman Sachs (GS) has been struggling to get back above the September highs even with the October surge... Read More
Don't Ignore This Chart! November 05, 2015 at 01:10 PM
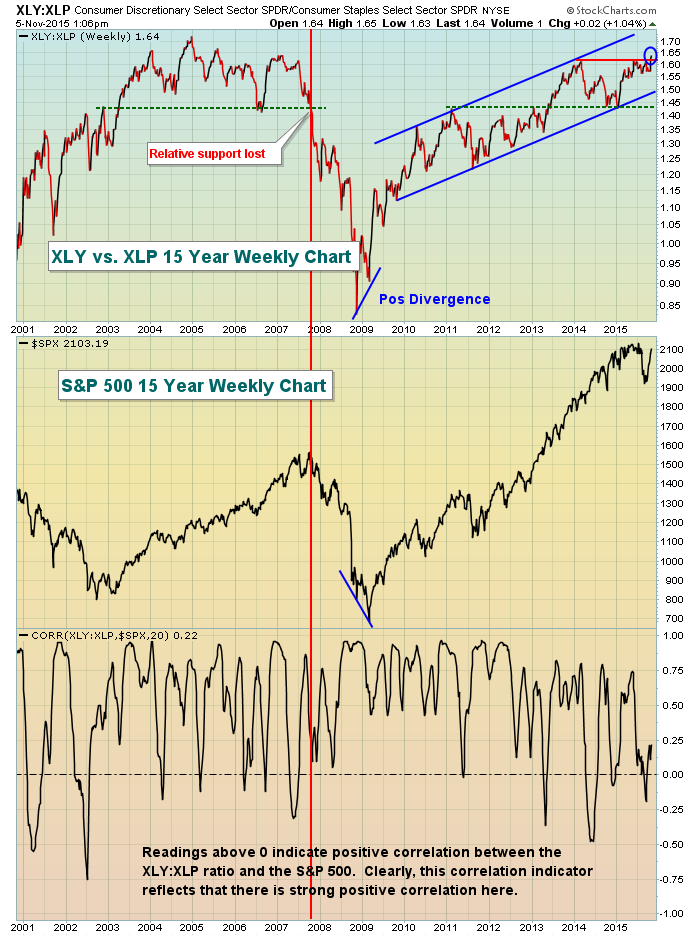
No signal is perfect, but the relative performance of consumer stocks is one to watch. The reason is simple... Read More
Don't Ignore This Chart! November 04, 2015 at 12:06 PM
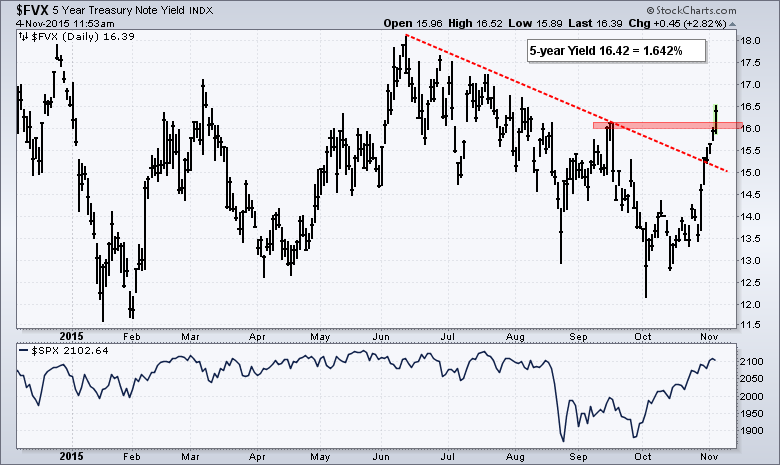
Short-term Treasury yields surged over the last six days and recent breakouts suggest that the Fed will raise short-term rates in December. Yes, it sounds blasphemous, but the bond market tends to lead the Fed in these matters... Read More
Don't Ignore This Chart! November 03, 2015 at 01:40 PM
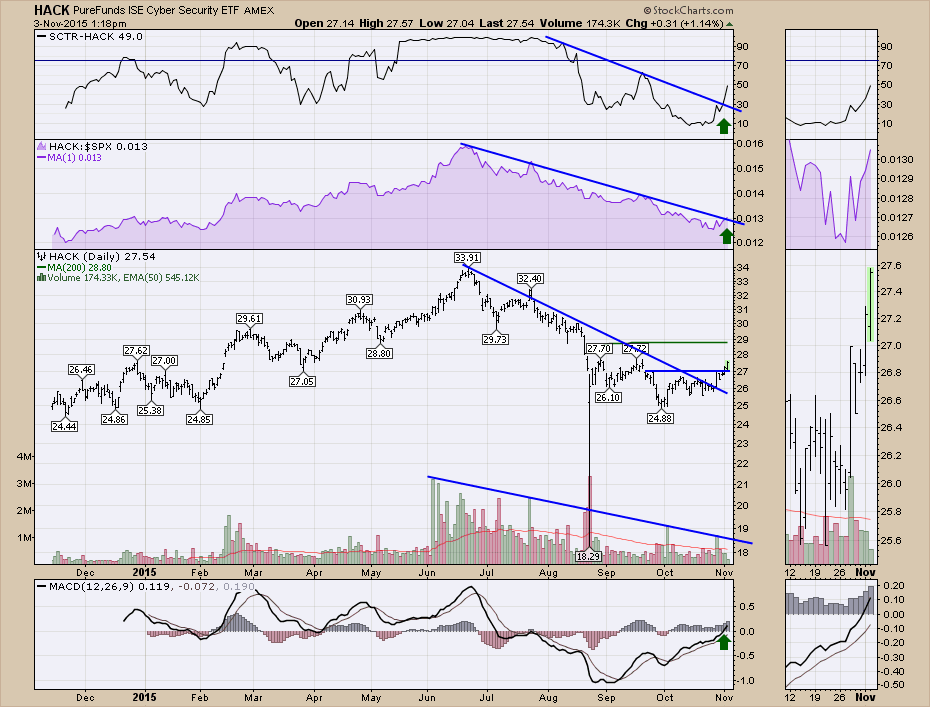
Cyber Security is a growing problem in the technology world. The companies that sell cyber security solutions are associated with high multiples and strong growth as almost every client increases their cyber security spending each year... Read More
Don't Ignore This Chart! November 02, 2015 at 12:11 PM
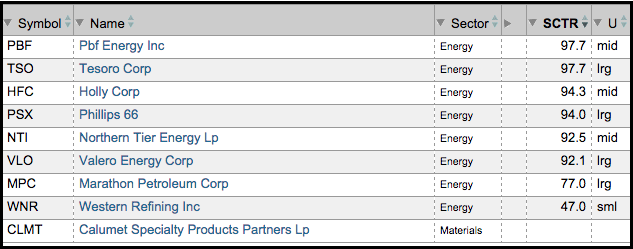
Refiner stocks are showing relative strength and absolute strength. The table below shows nine refiner stocks from the Oil Refiners ETF (CRAK). Eight of the nine are part of our StockCharts Technical Rank (SCTR) universe and six of the nine have SCTRs above 90... Read More
Don't Ignore This Chart! November 01, 2015 at 05:19 PM
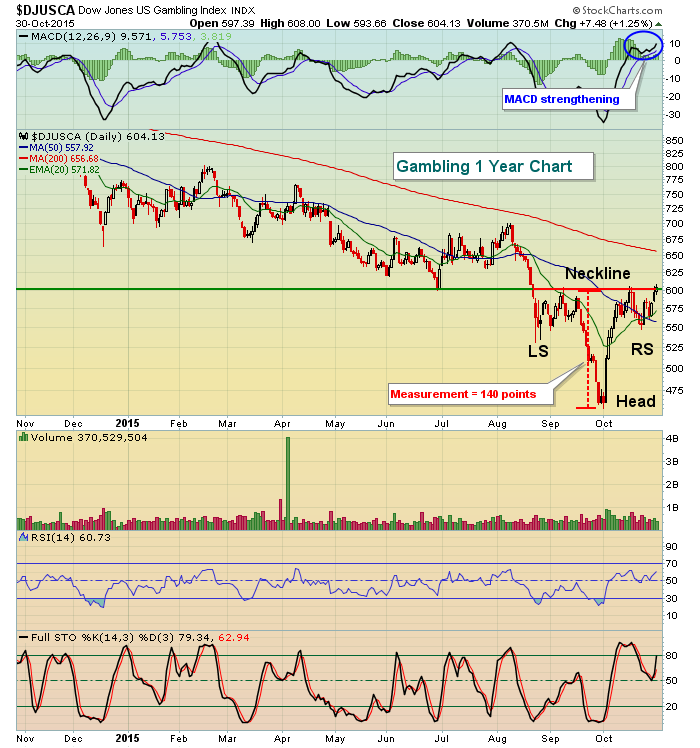
Gambling stocks ($DJUSCA) have been BY FAR the worst performing industry group within the consumer discretionary sector over the past year, dropping 27.72%... Read More