Don't Ignore This Chart! May 31, 2017 at 11:32 AM
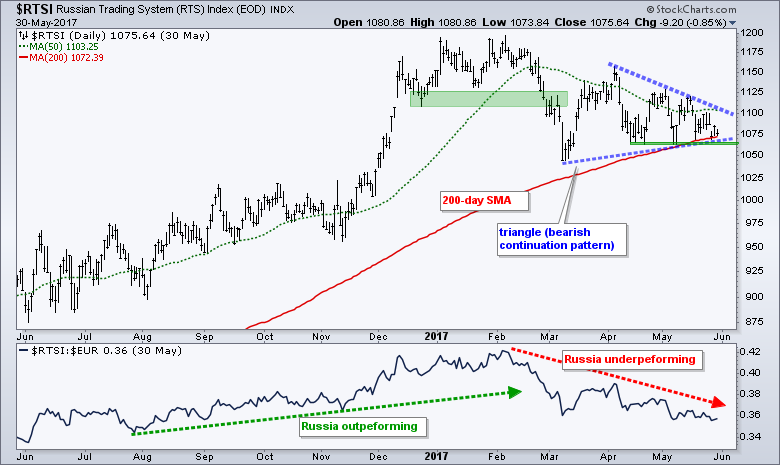
The Russian Trading System Index ($RTSI) is struggling this year and down around 6.5% year-to-date. In contrast, the S&P 500 is up over 7% year-to-date and the Eurotop 100 ($EUR) is up around 6.5%... Read More
Don't Ignore This Chart! May 30, 2017 at 12:40 PM
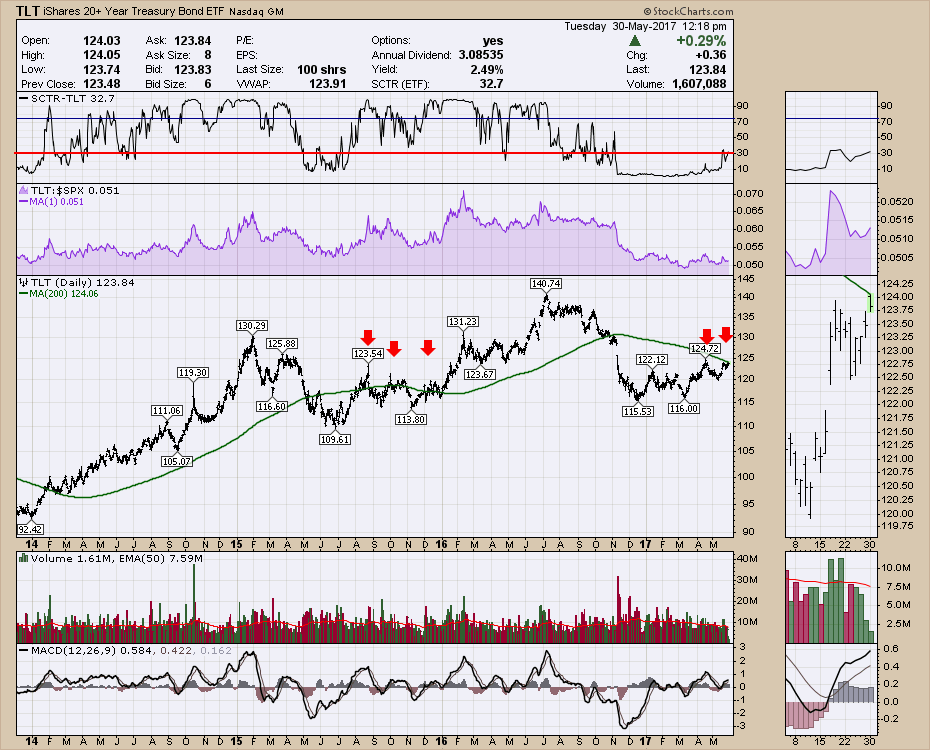
The long bond is an emotional beast. There has been lots of discussion about how the long bond price should be falling through the floor with the Fed raising rates. The TLT ETF represents the 20 + Year (Long) bonds... Read More
Don't Ignore This Chart! May 28, 2017 at 10:09 PM
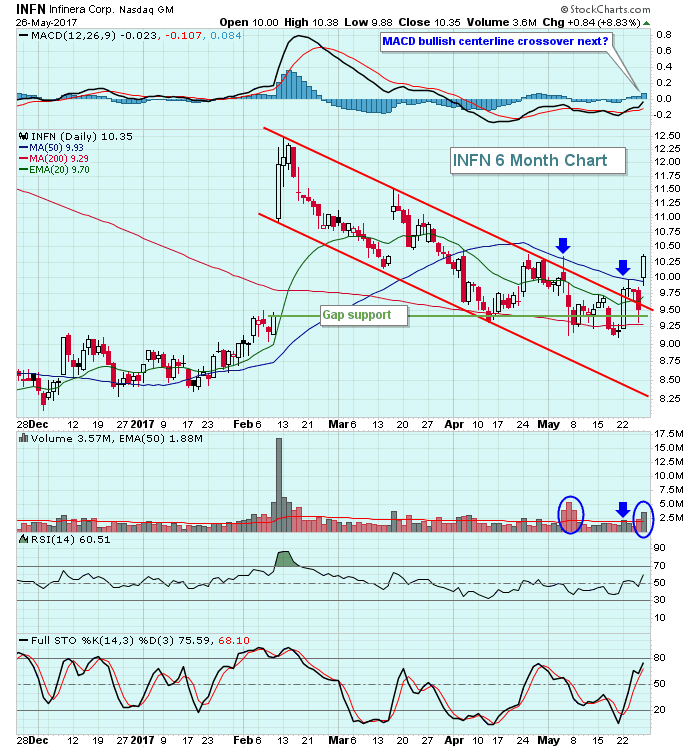
Infinera (INFN) gapped higher in February on massive volume, but has been falling in a descending channel ever since. Volume accelerated on Friday as INFN clearly broke this down channel. The reversal also is taking place after a key gap support level was filled and tested... Read More
Don't Ignore This Chart! May 26, 2017 at 09:30 AM
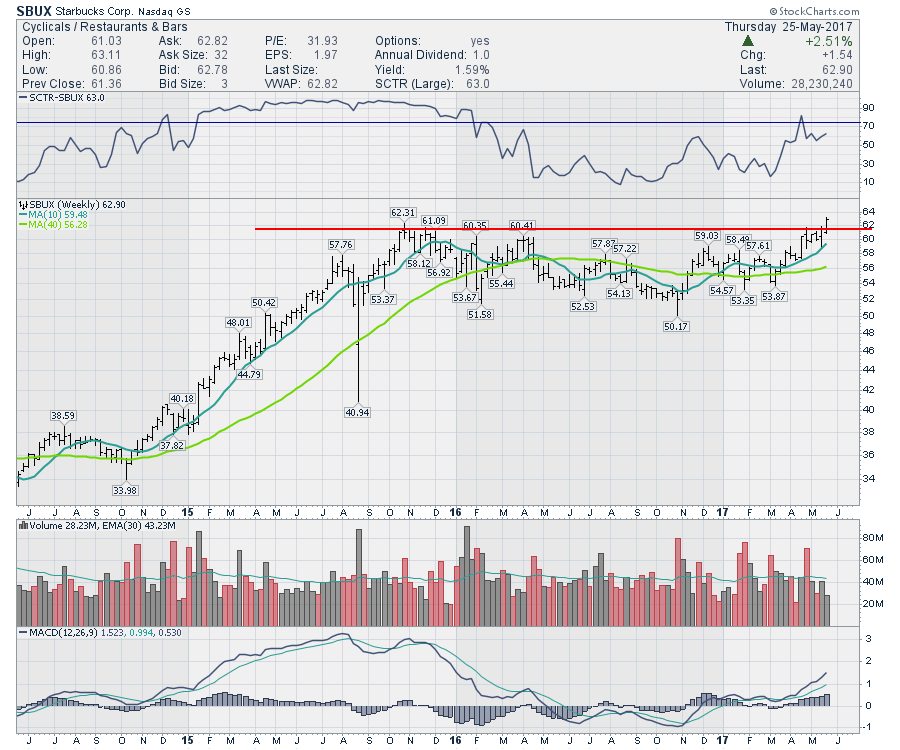
Starbucks (SBUX) continues to brew higher highs. Recently the stock was under pressure because their new pre-order mobile app was too successful. While it is a problem, it is a good problem... Read More
Don't Ignore This Chart! May 25, 2017 at 03:25 PM
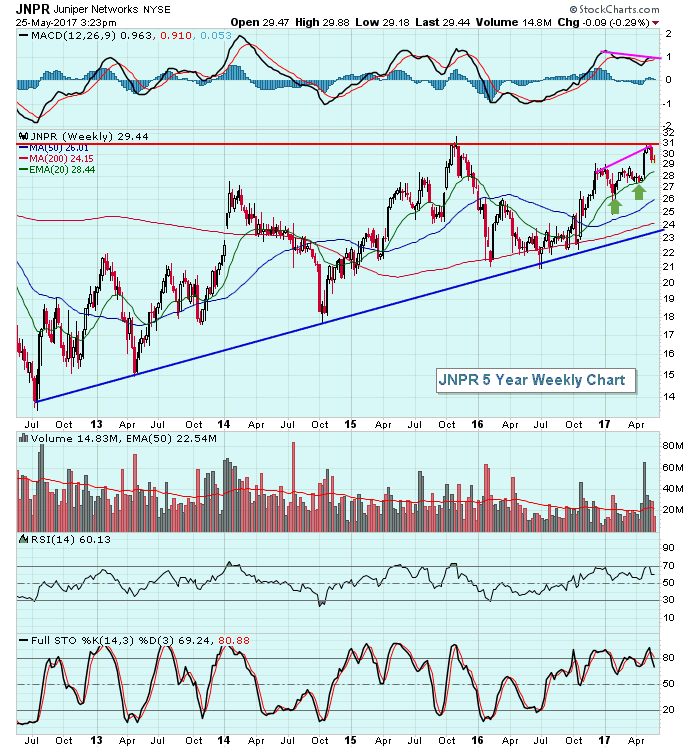
Recently, competitor Cisco Systems (CSCO) broke out to a 15 year high. While Juniper Networks (JNPR) hasn't seen its price move to decade and a half highs, it is on the verge of breaking to a six year high amid very heavy volume... Read More
Don't Ignore This Chart! May 24, 2017 at 09:11 AM
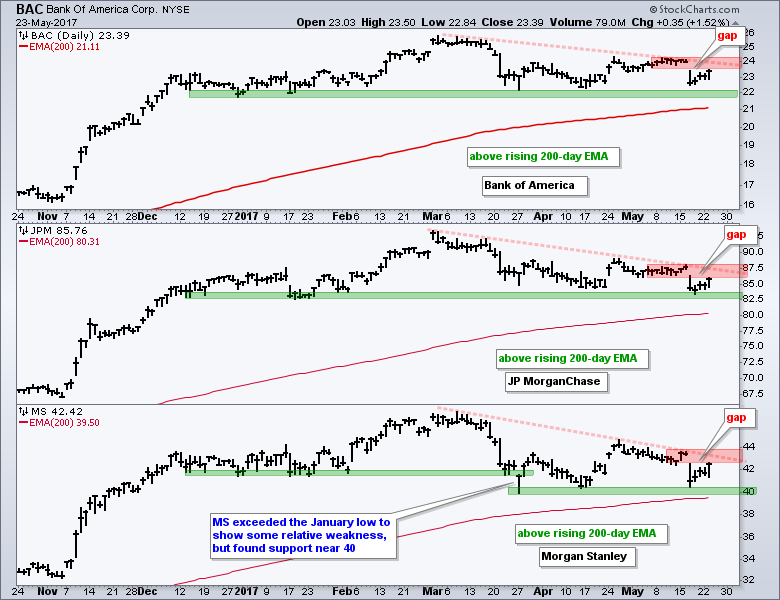
Banking stocks bounced on Tuesday as the 20+ YR T-Bond ETF (TLT) fell and the 10-yr T-Yield ($TNX) moved higher. These bounces reinforce the positive correlation with TLT and the negative correlation with $TNX... Read More
Don't Ignore This Chart! May 23, 2017 at 11:24 AM

Caterpillar continues to track higher on the price charts but in May the chart has reached an interesting level. Caterpillar broke above a 6 year consolidation in late April and has been consolidating since then... Read More
Don't Ignore This Chart! May 22, 2017 at 05:07 PM
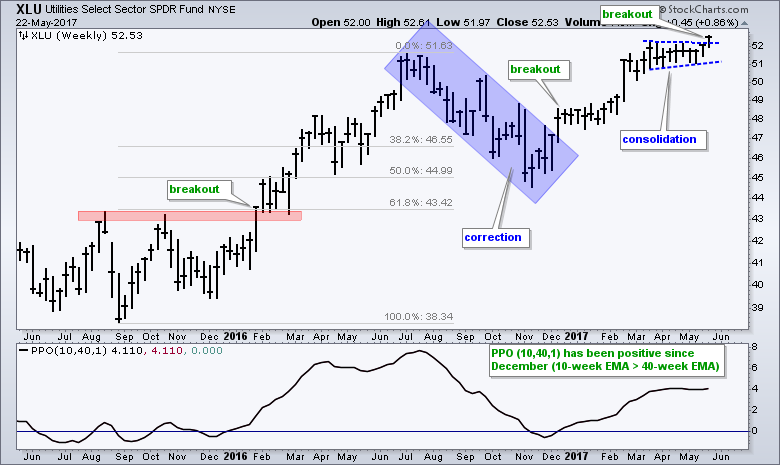
The Utilities SPDR (XLU) is clearly one of the leading sectors in 2017 because it is trading at its highest level of the year. XLU, by the way, is the only sector SPDR that hit a year-to-date high on Monday... Read More
Don't Ignore This Chart! May 21, 2017 at 09:52 PM
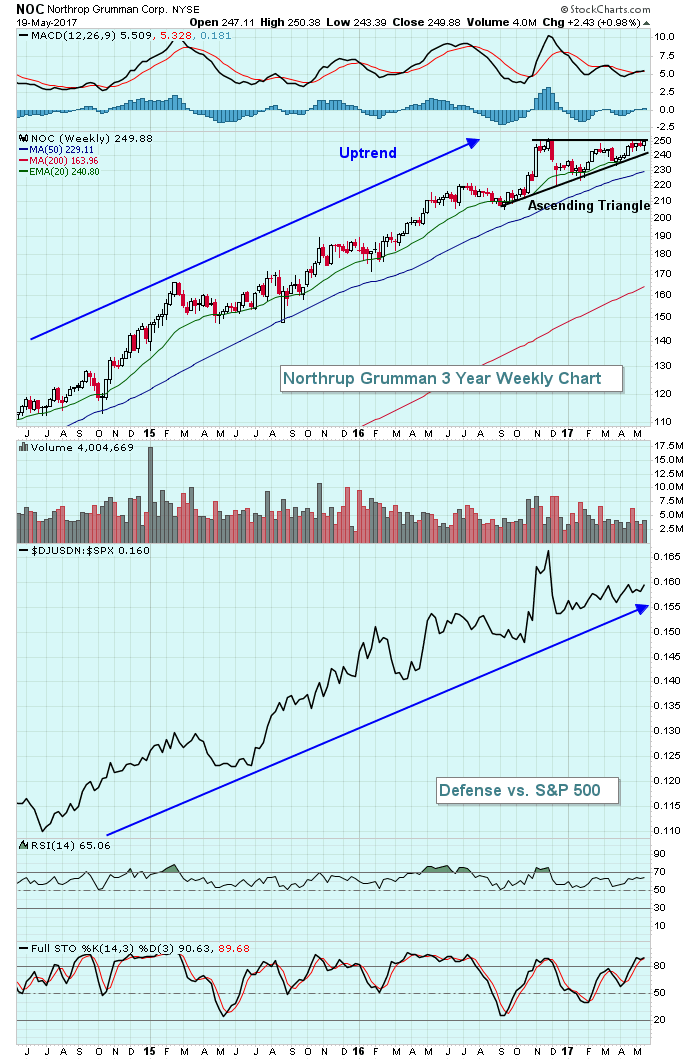
Northrop Grumman (NOC) has risen ten fold since this bull market began in 2009 and its current bullish pattern suggests that this defense company is not ready to roll over just yet... Read More
Don't Ignore This Chart! May 20, 2017 at 02:13 PM
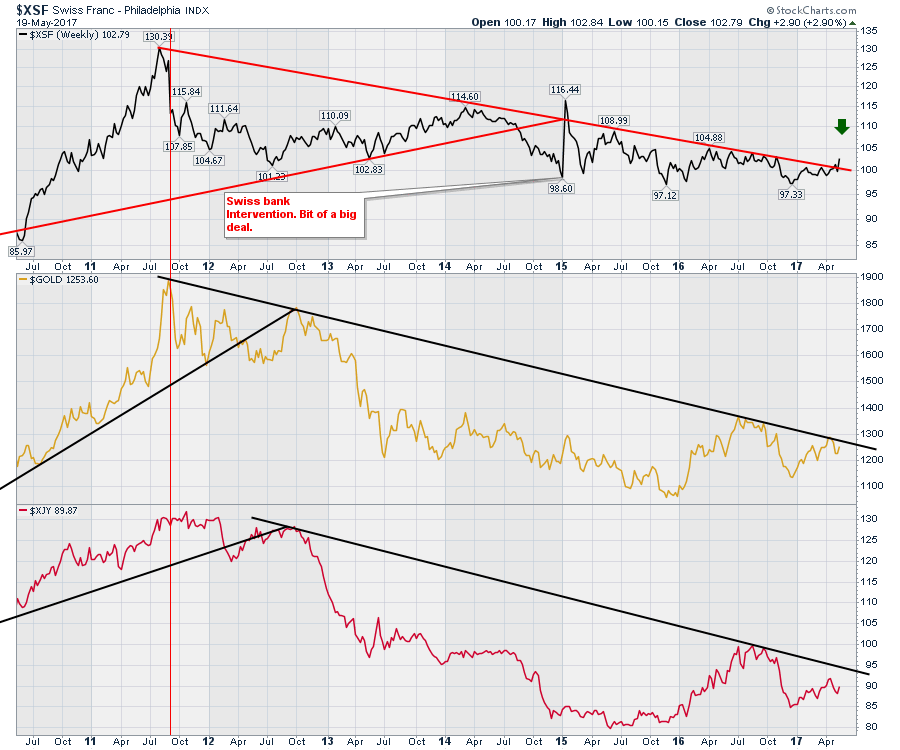
The Swiss Franc ($XSF) made a meaningful break of the downtrend this week. The correlation of the Swissie to other asset classes is worth noting... Read More
Don't Ignore This Chart! May 18, 2017 at 05:47 PM
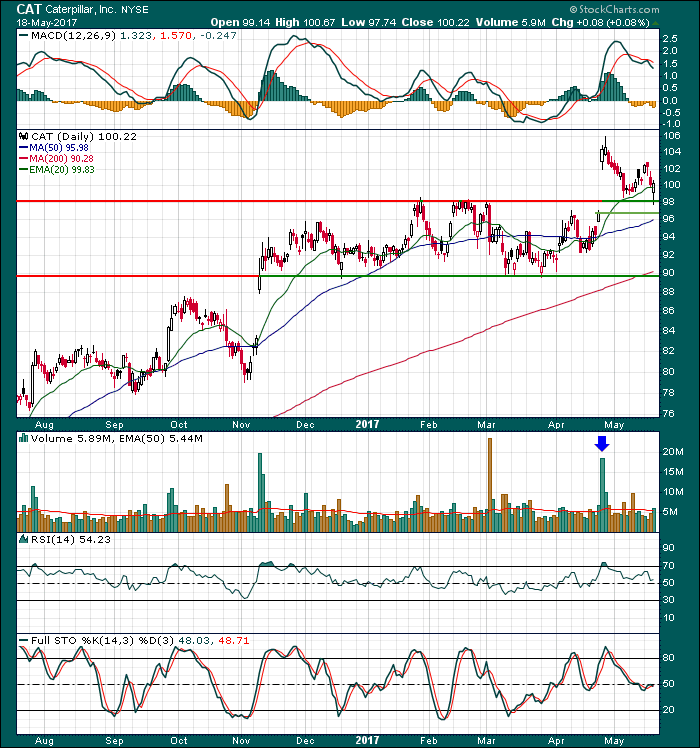
Caterpillar (CAT) was one of many beneficiaries of the latest quarterly earnings season. With its revenues and EPS topping Wall Street estimates, CAT surged higher on April 25 from its April 24 close of 96.81... Read More
Don't Ignore This Chart! May 17, 2017 at 08:38 AM
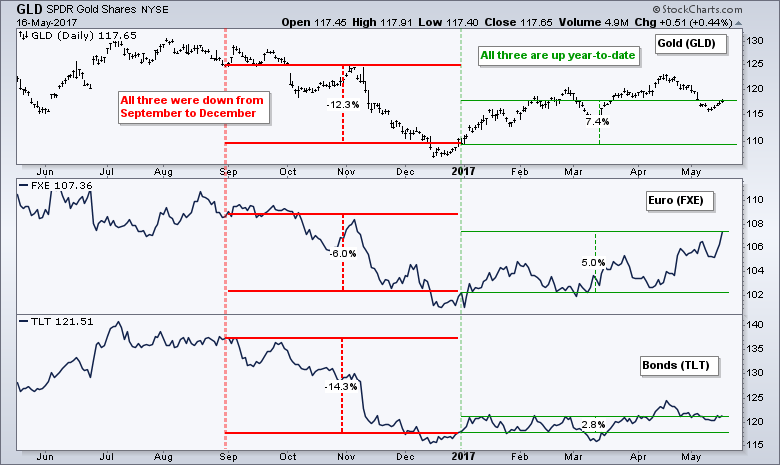
The Gold SPDR (GLD), Euro ETF (FXE) and the 20+ YR T-Bond ETF (TLT) are all up year-to-date and showing positive correlation. This is not a big surprise because gold is negatively correlated to the Dollar and negatively correlated to the 10-yr T-Yield ($TNX)... Read More
Don't Ignore This Chart! May 16, 2017 at 04:10 PM
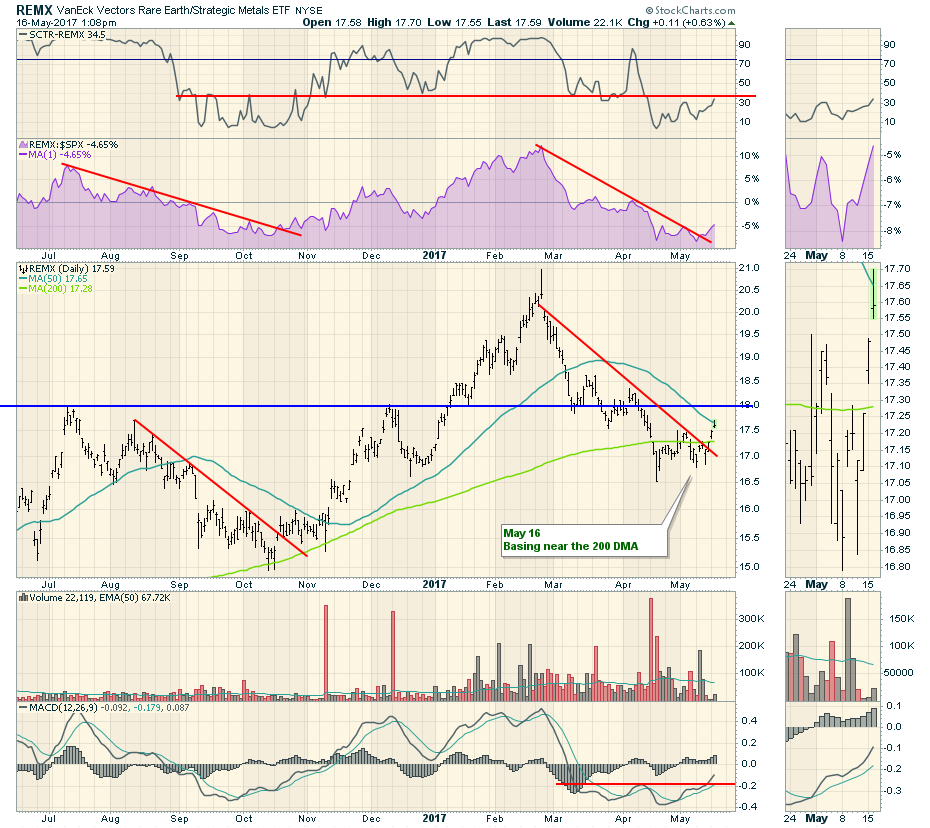
The Rare Earth Metals ETF (REMX) had glory days from October to February. Then a slide ensued where a lot of the basic materials were falling down. Today the REMX ETF looks interesting as the chart has a new pattern of higher lows and higher highs with todays upside push... Read More
Don't Ignore This Chart! May 15, 2017 at 11:20 AM
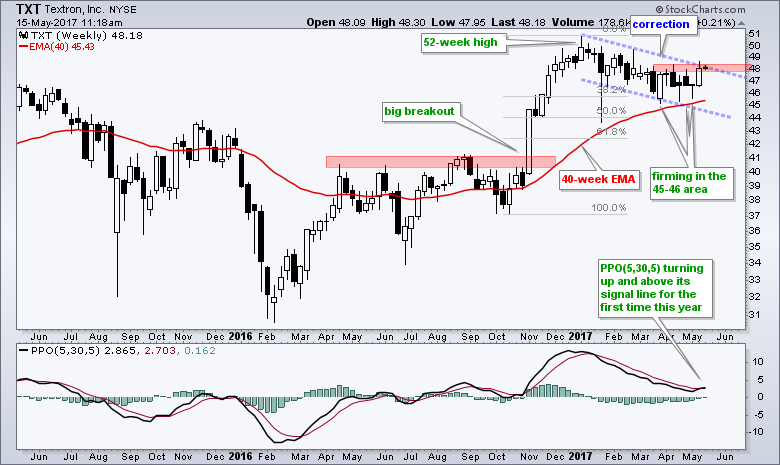
Textron (TXT), which is part of the industrials sector and the defense-aerospace industry, surged to new highs after the election and then declined in 2017... Read More
Don't Ignore This Chart! May 13, 2017 at 01:36 PM
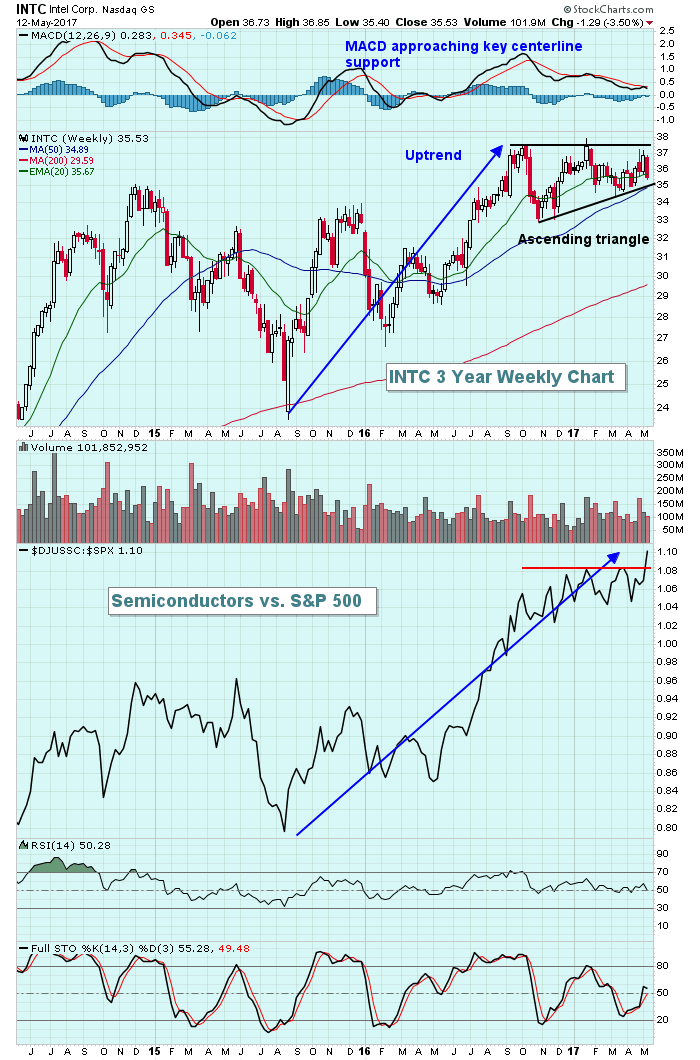
Intel (INTC) has been trading in bullish sideways fashion since topping in October. The Dow Jones U.S. Semiconductor Index ($DJUSSC) has continued to rise and lead the benchmark S&P 500 on a relative basis - even while INTC consolidates... Read More
Don't Ignore This Chart! May 12, 2017 at 12:44 PM
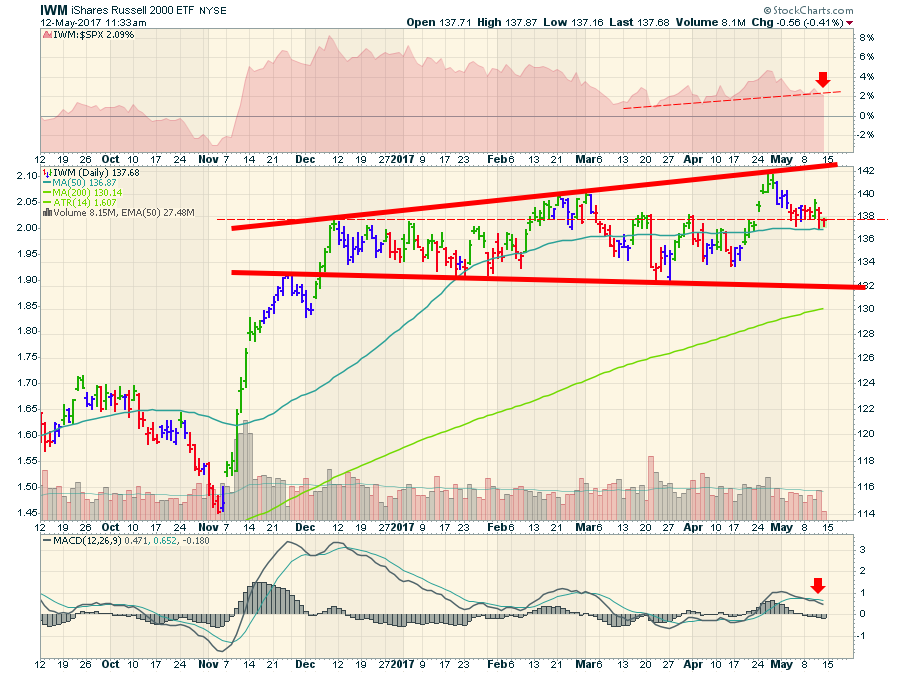
A lot of people who analyze the market including portfolio managers will talk about supply and demand, or the battle between buyers and sellers. This could not be more evident in the Russell Tracking ETF (IWM)... Read More
Don't Ignore This Chart! May 10, 2017 at 04:07 PM
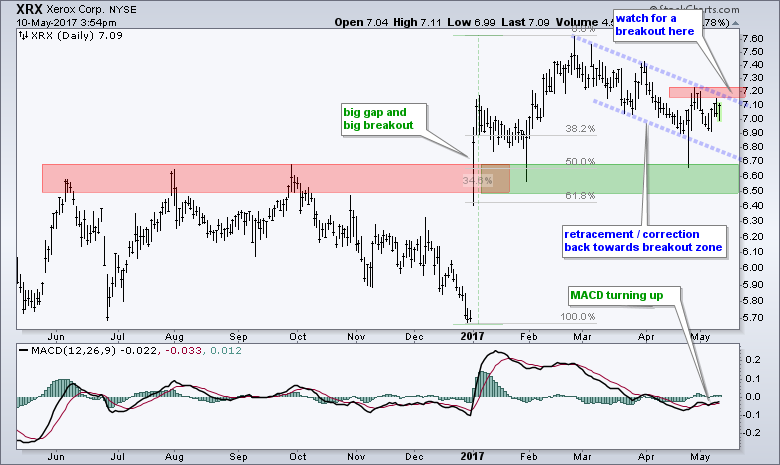
I was running through some charts today and came across and interesting setup - in Xerox of all names. It has been a long time since Xerox crossed my path. The company provides document management solutions with both hardware and services. It is a $7... Read More
Don't Ignore This Chart! May 09, 2017 at 09:15 AM
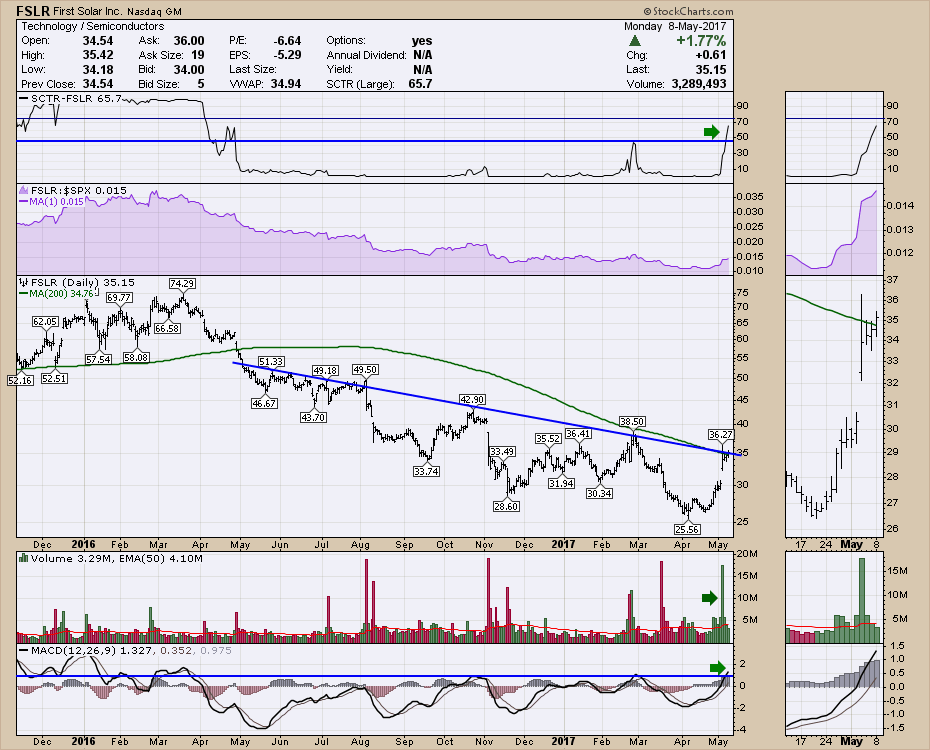
First Solar (FSLR) has been beaten down for a while. Last week finally delivered a huge up day with lots of volume accompanying the move. Some of that volume was short sellers covering but the chart is getting ready to test breaking through a year long trend line... Read More
Don't Ignore This Chart! May 08, 2017 at 12:49 PM
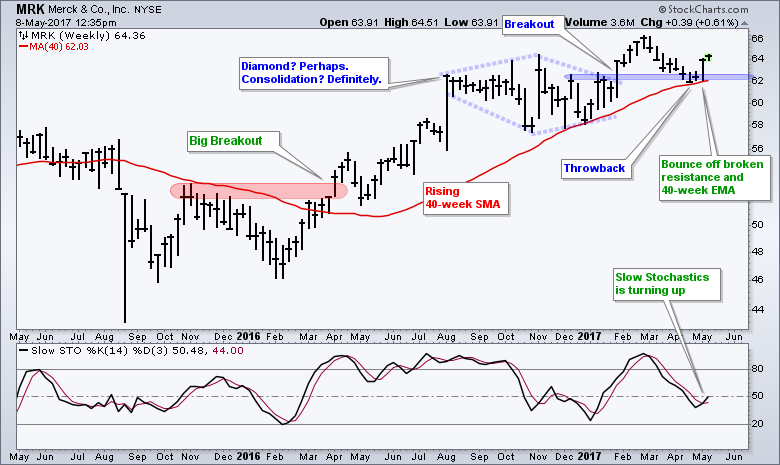
Merck is showing signs of life as it bounces off a breakout zone and the Stochastic Oscillator turns up. The overall trend is up because the stock hit a 52-week high in February and is above the rising 40-week moving average... Read More
Don't Ignore This Chart! May 07, 2017 at 08:18 PM
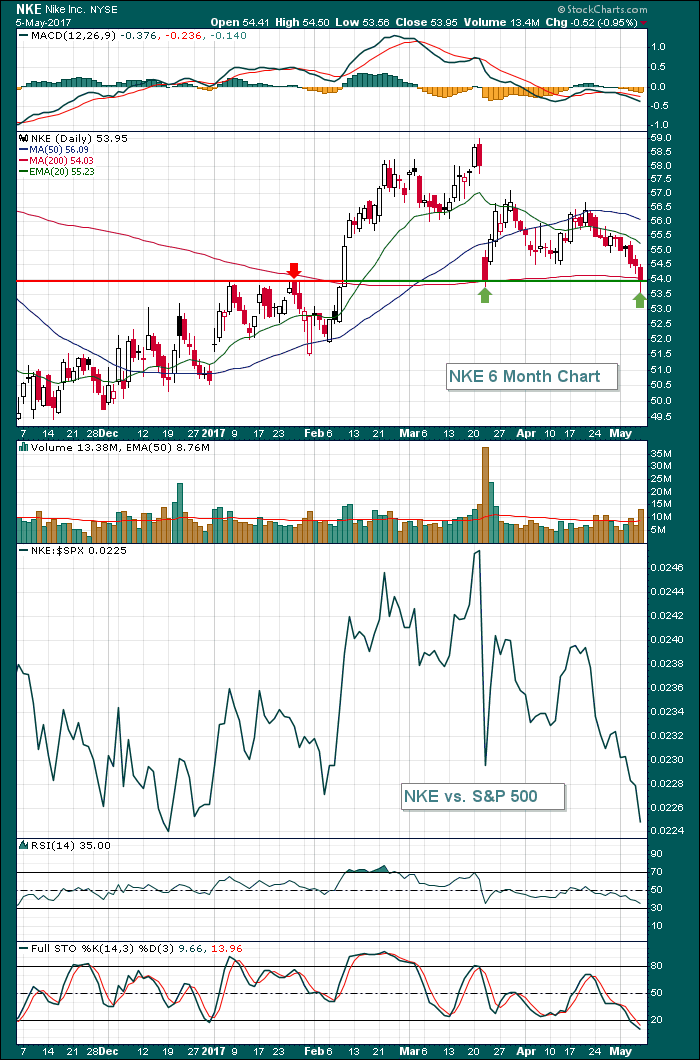
As technicians, we look for prior price resistance to act as solid support once the resistance has been broken. That principle came into play on Nike, Inc. (NKE) as it tested a major price support just beneath 54.00 on Friday... Read More
Don't Ignore This Chart! May 06, 2017 at 12:19 AM
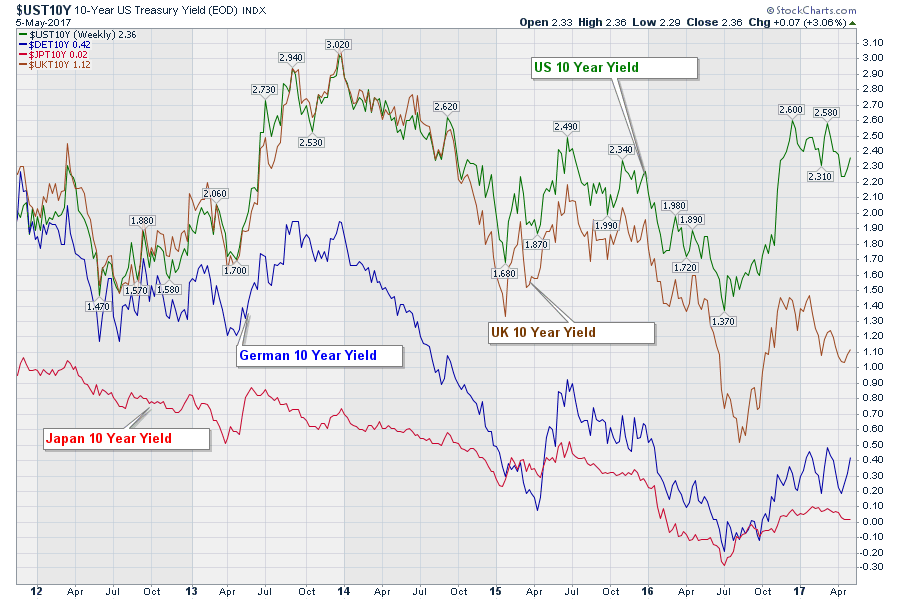
There are many opinions in the market and that is what makes the market so interesting. Without question one of the perplexing areas of the market has been the 10 Year Treasury Yield for a lot of investors... Read More
Don't Ignore This Chart! May 03, 2017 at 11:06 AM
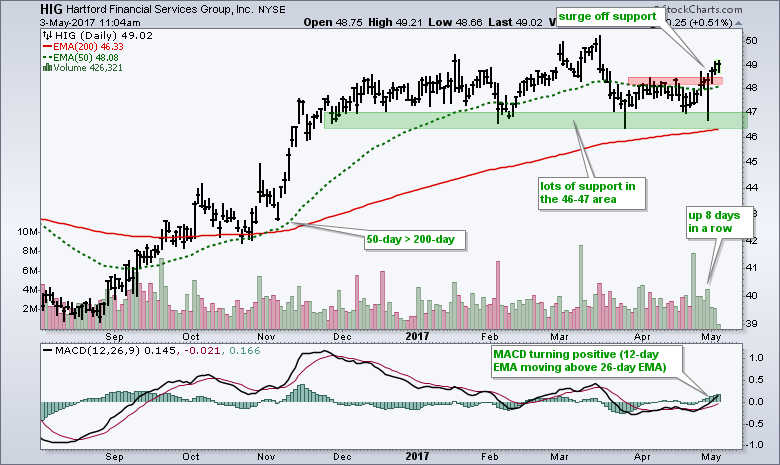
Hartford (HIG) is a big insurance concern and part of the Insurance SPDR (KIE), which is one of the best performing industry group ETFs over the last six months... Read More
Don't Ignore This Chart! May 02, 2017 at 10:53 AM
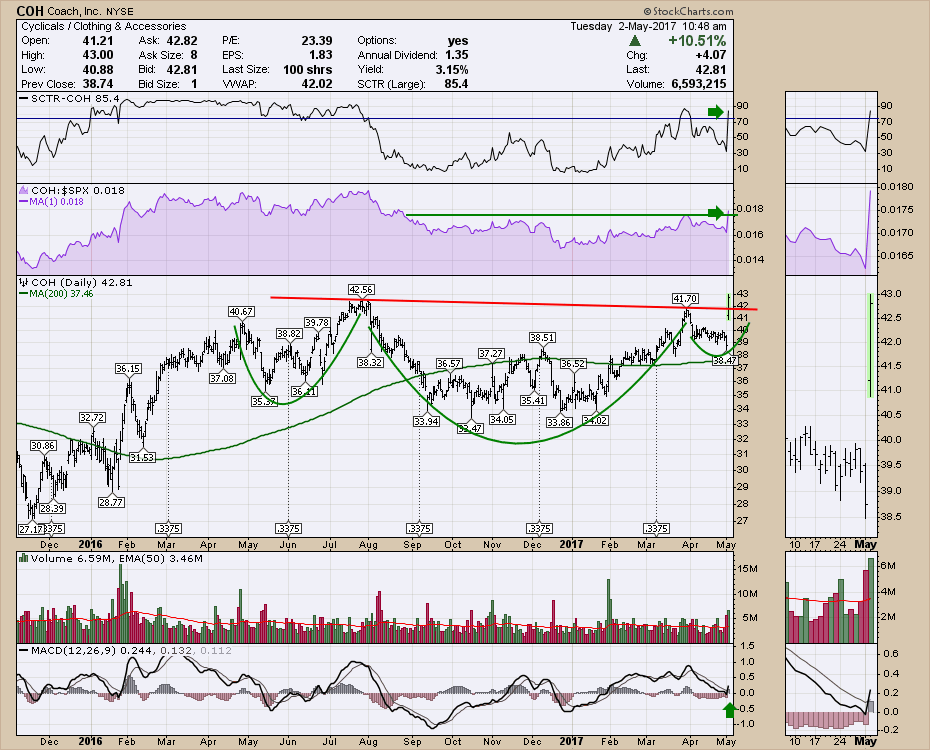
Coach (COH) has been on a roll lately. This morning it was "All Aboard" the stagecoach! The stocked popped to new highs and is currently holding up there. The dividend is healthy above 3%. The SCTR gave a nice kick and it looks strong here... Read More
Don't Ignore This Chart! May 01, 2017 at 12:12 PM
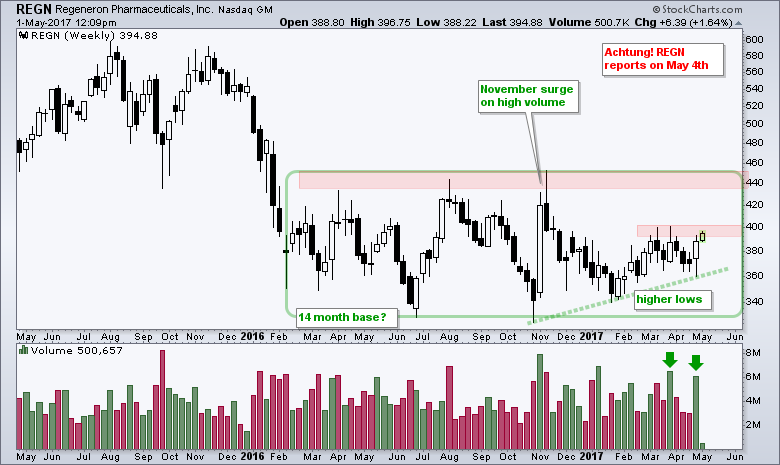
Regeneron has gone nowhere since February 2016, but recent volume bars suggest that this may be a massive base. The stock surged off the 325 area with big volume in November. After falling back into January, the stock held above the October low and turned up the last 14 weeks... Read More