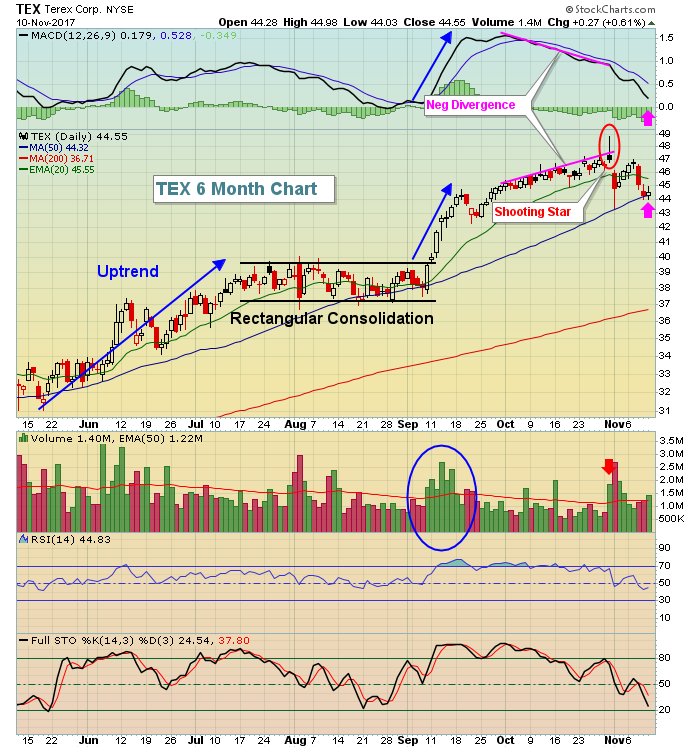
In September, Terex Corp (TEX) saw big volume accompany a breakout of a bullish rectangular consolidation phase. After weeks of trending higher, momentum began to slow and TEX printed a "death" candle - a shooting star on big volume to end the uptrend. If there's one signal that screams at me to sell, it's the combination of a negative divergence and a reversing candle on volume. Look at the chart below:
 TEX is a great chart to teach Technical Analysis. There's a clear uptrend leading to a top in early August. Then we see a continuation pattern and following an uptrend, these patterns are bullish and we should expect them to confirm with a breakout to the upside. That breakout occurred in the first half of September and volume accelerated to confirm the breakout. High volume breakouts reek of accumulation. Stocks under accumulation are tremendous trade candidates on pullbacks.
As TEX moved up throughout October, it was a slow grind and a negative divergence emerged on the MACD. This is a sign of slowing price momentum. But if you look at the volume during the second half of October, you'd also note that volume was slowing, a confirming signal of slowing momentum. At the very top, a shooting star candle printed. These are short-term bearish signals where, after an uptrend, we see a gap higher with additional movement higher intraday to print the long "tail" to the upside. But heavy volume accompanies the reversal and TEX closes near the low of the day. Shooting star candles take the shape of upside down hammers. Hammers are bullish short-term signals if they follow a period of selling and the hammer prints with heavier than normal volume. After negative divergences print, I look to rising 50 day SMAs as a potential target and I also look for the weakness to "reset" the MACD at or near centerline support (pink arrows).
One final thought. Look at the RSI throughout this six month uptrend. During uptrends, RSI 40-50 tends to provide excellent entry points. Each significant low throughout this uptrend was accompanied by an RSI in this range. Where's the current RSI reading? 44.83.
Want to see individual stock trade setups? I publish these at the beginning of every week. They are educational in nature so please do your own due diligence before investing. CLICK HERE to view my 11 trade setups for this week.
Happy trading!
Tom
