Norfolk Southern put in a weak break to new highs today. In the zoom box on the right, the candle was a nice clean break out but at the end of the day, it had fully reversed and closed lower than the open. It did close up compared to Monday, so it will show as bullish volume, but its a little suspect.
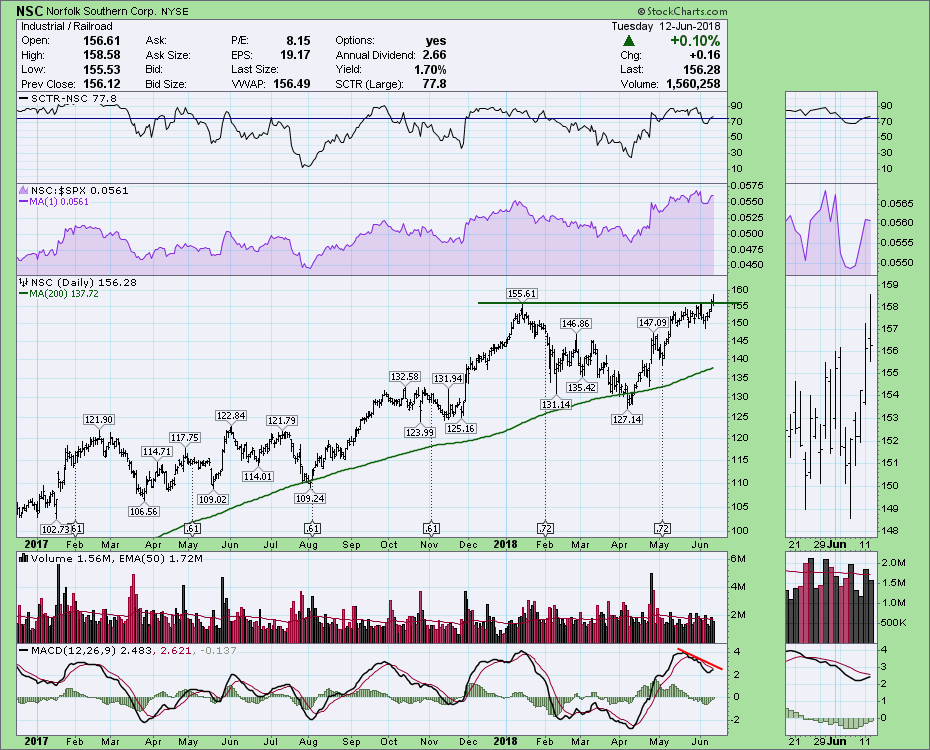
A few things to note on the chart. The MACD is making a lower high here as the price tries to break out. Rather than suggesting NSC won't go higher, it just might need a little pullback and reset the momentum oscillators. One other clue I don't like is how deep the MACD went on the Feb , March 2018 lows. Sometimes this can be an indication of losing buyers. So on the next rally after the deeper pullback, you may find the stock hasn't got the buying interest to hold new highs and this end up marking an intermediate high.
With the overall market in full speed ahead mode, this candle and momentum setup looks weak. I'd keep a tight stop if I owned and would wait for a better entry if I didn't.
I produced a Commodities Countdown video on the weekend. You might find some important information tucked into this hour long recording.
I host a new TV show on StockCharts.com called The Final Bar. It airs Thursdays at 5 PM ET and is repeated throughout the week on StockCharts TV. You can also catch it on my Vimeo channel or on the StockCharts.com YouTube Channel.
Lastly,
I'll be the keynote speaker on Thursday, June 14th at Noon EDT for the CSTA annual general meeting in Toronto. If you would like to attend as a member or a guest, please register here. CSTA Annual General Meeting and Awards Event. Please take the time to introduce yourself. We look forward to seeing you there!
Good trading,
Greg Schnell, CMT, MFTA
Senior Technical Analyst, StockCharts.com
Book: Stock Charts for Dummies
Twitter: Follow @Schnellinvestor
