 Alphabet (GOOGL) fell around 10% from a recent high and this decline looks like a pretty normal correction within a bigger uptrend. Note that GOOGL is the biggest component (23.15%) in the new Communication Services SPDR (XLC). Facebook (FB) is the second largest weighting (17.69%) and Disney (DIS) is a distant third (4.65%).
First and foremost, the long-term trend is up because Alphabet recorded a 52-week high in July and price is well above the rising 200-day SMA. This is the big trend is at work and it sets my trading bias, which is bullish.
The stock gapped up and hit a new high above 1280 in July and then fell around 10% with a decline to the 1160 area. This stock firmed in the 1160-1180 area for a couple weeks and this is a potential reversal zone for two reasons. First, the blue area highlights a broken resistance zone that turns into support. Second, the gray horizontal lines mark the key retracements and GOOGL retraced 38-50% of the prior advance. An uptrend often ebbs and flows with two steps forward and one step backward. This pullback represents one step backward.
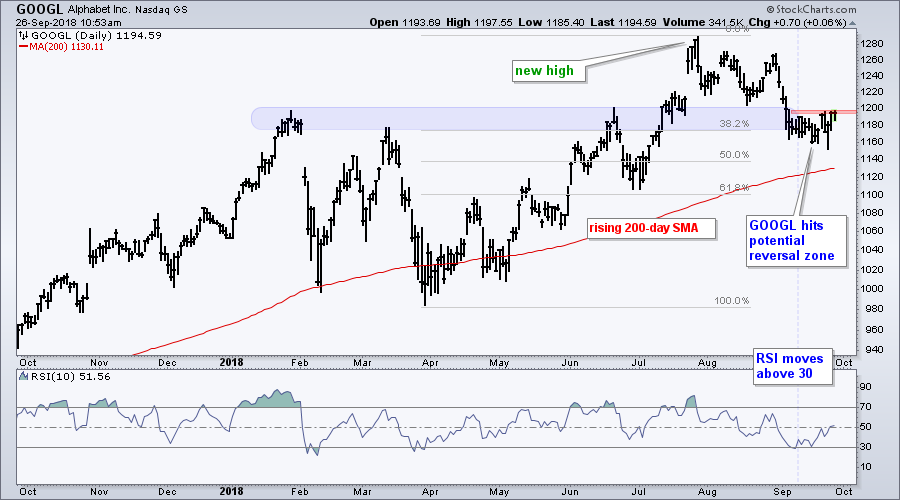
In addition to the retracements and support, note that RSI (10) dipped below 30 to become short-term oversold in early September and moved back above 30. A short-term oversold condition within a bigger uptrend represents an opportunity. Returning to the price chart, GOOGL established short-term resistance at 1200 and a breakout here would suggest an end to the correction. A breakout would also signal a resumption of the bigger uptrend and new highs would be expected.
On Trend on Youtube
Available to everyone, On Trend with Arthur Hill airs Tuesdays at 10:30AM ET on StockCharts TV and repeats throughout the week at the same time. Each show is then archived on our Youtube channel.
Topics from Tuesday, September 25th:
- SPY and QQQ Lead as IJR and MID Stall.
- Exploring Changes in XLK and XLY (plus XLC).
- Top 10 Stocks in XLK and XLC (GOOGL, AAPL, FB, AMZN...).
- Tech ETFs Still Strong (SKYY, FDN, IGN, HACK, SOXX).
- #AskArthur (Coppock, XLC and XLRE, Monthly vs Daily).
- Stocks to Watch: ADSK, WDAY, NOW, VRTX.
- Click here to Watch
Plan Your Trade and Trade Your Plan.
- Arthur Hill, CMT
Senior Technical Analyst, StockCharts.com
Book: Define the Trend and Trade the Trend
Twitter: Follow @ArthurHill
