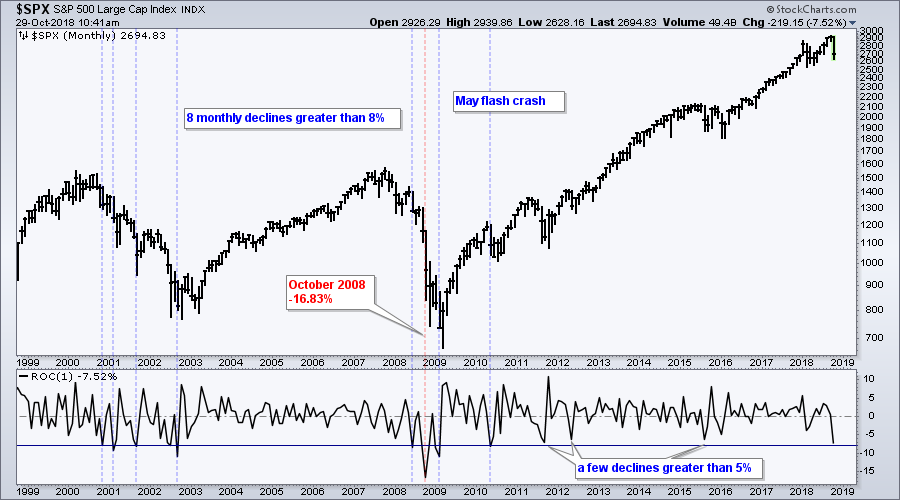
The S&P 500 is down around 7.5% so far this month and this is shaping up to be the worst monthly decline in over five years. Keep in mind that there are still a few days left in October and the last monthly bar will not complete until the close on Wednesday.
The seven blue lines and one red line show eight monthly declines that exceeded 8%. The first four occurred during the bear market in 2001-2002, the next three in the bear market in 2008-2009 and the last in early May 2010 (flash crash). The biggest monthly decline in the last 20 years occurred in October 2008, which was smack dab in the middle of the last bear market and the financial crisis.
While it is hard to infer from just nine data points and October is still in play, monthly declines in excess of 8% represent clear shocks to the system. At best, the market needs some time to stabilize. At worst, this shows strong selling pressure that could persist.
Plan Your Trade and Trade Your Plan.
- Arthur Hill, CMT
Senior Technical Analyst, StockCharts.com
Book: Define the Trend and Trade the Trend
Twitter: Follow @ArthurHill

