Oil has fallen the last few days and really taken a significant move lower. After at least two weeks of falling, oil was down 6.3% at the close today. After topping October 3rd intraday, and falling for more than a month in almost a straight cascade, today saw massive volume to punctuate a bad day. It seems very hard to bet against the huge down pressure, but this might be the time to start adding names to consider on the long side with setups building over the next month. Today marked the potential for a significant low in many respects.
On the USO chart, oil slammed down from the 50% retracement and dropped to the 61.8% retracement. At this point some bounce would be expected. Will it be the final low? That is hard to believe with the selling pressure. But a major retracement level gives us a good number to shoot against especially when it comes with capitulatory volume. This 61.8% retracement is a big number to trade against. Notice looking left, the range between the 38.2% and 61.8% ended up being a place where price oscillated between and set up the middle of the final range. Thats pretty interesting.
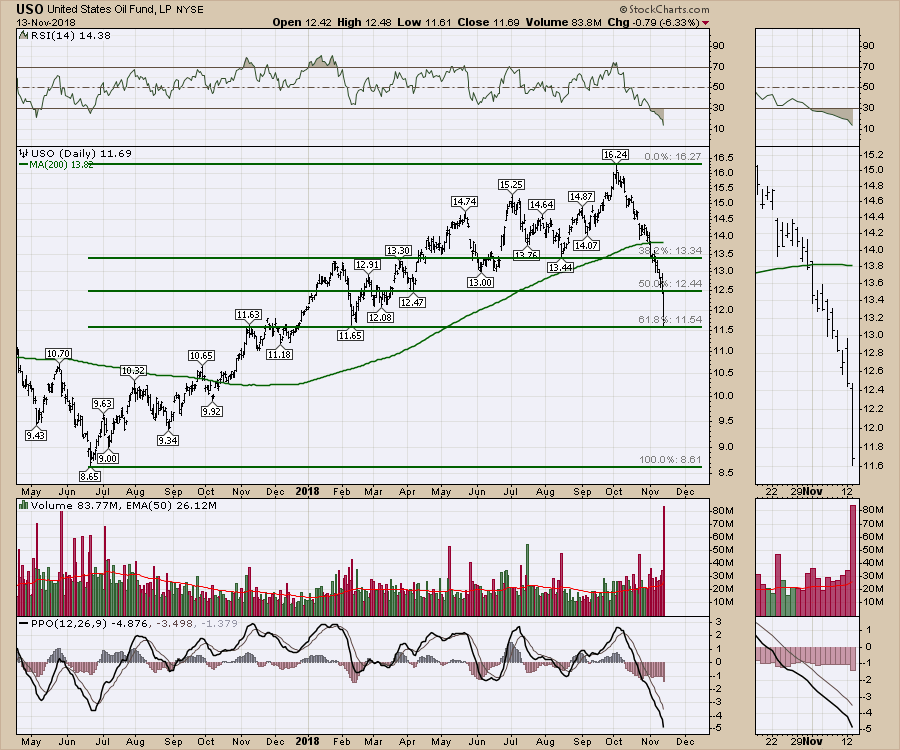 This is probably a setup for a relief rally and the down trend continues. For swing traders, this could be a nice set up for a 15 or 20% rally over a week or two.
What is more important is using todays low as a major sentiment low and watching which oil patch stocks end up creating positive divergence when oil hits its final low. If you are not an extremely short term trader, better to wait for the final lows to set up a base before trying to get long oil stocks. We have other reference charts that will help us get in near the lows. I'll be covering those charts every week on the weekend video review where I cover all four asset classes. If you would like to check out my videos, you can follow the links below.
Here is this week's broad market review video.
The Canadian Technician video shows the bounce off the late October lows in Canada. Canada is back below the 2008 highs. Tough ten years for investors.
This video covers off some of the recent price action since the late October lows. It also covers the areas where we may expect resistance through the upcoming week. The drop in oil has been huge and this is discussed on the video.
If you are looking for a small gift, you might have family or friends that would like to learn more about the basics of charting. The first section of the book walks through all the chart settings to get the charts you want. The second section is why you might use charts for investing and the third section is putting it all together.
Click here to buy your copy today! Stock Charts For Dummies.
If you are missing intermarket signals in the market, follow me on Twitter and check out my Vimeo Channel often. Bookmark it for easy access!
Good trading,
Greg Schnell, CMT, MFTA
Senior Technical Analyst, StockCharts.com
Author, Stock Charts for Dummies
Hey, have you followed me on Twitter? Click the bird in the box below!
Want to read more from Greg? Be sure to follow his StockCharts blog:
The Canadian Technician
