The Semiconductor stocks were trying to lead to the upside in Tuesday's big down day. That's a short term bullish sign. Six semi stocks were in the top 22 from the S&P 500.
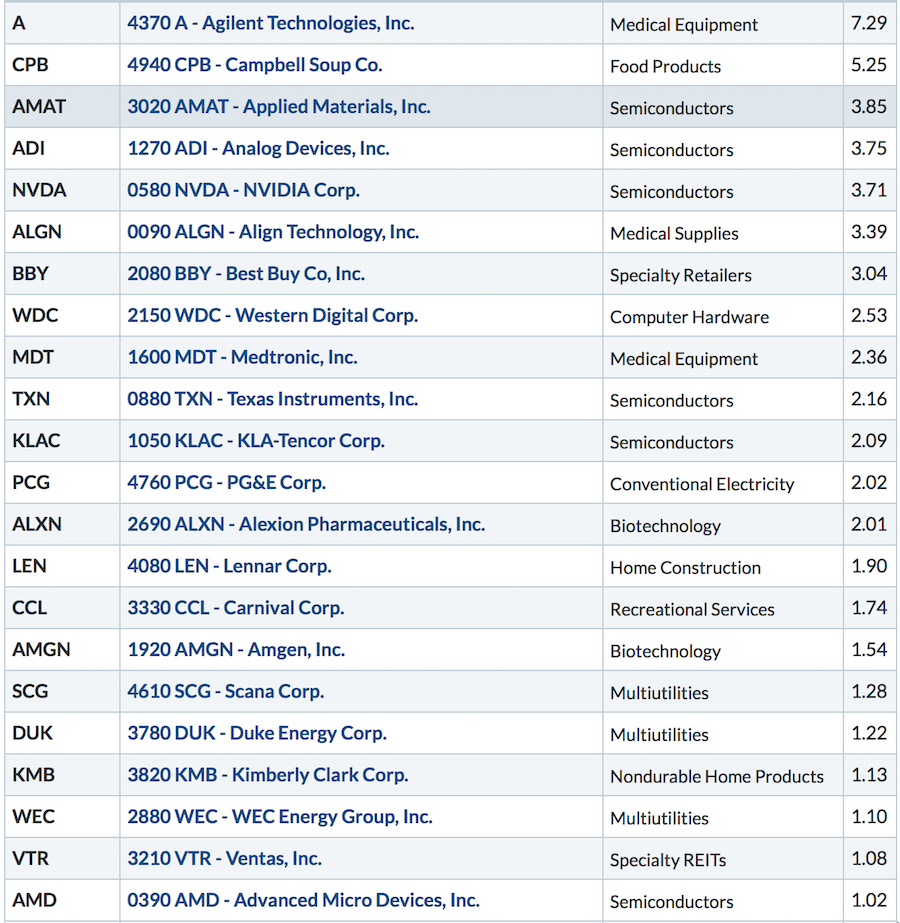 Considering how low in the hole they were to start the day, that is a big improvement.
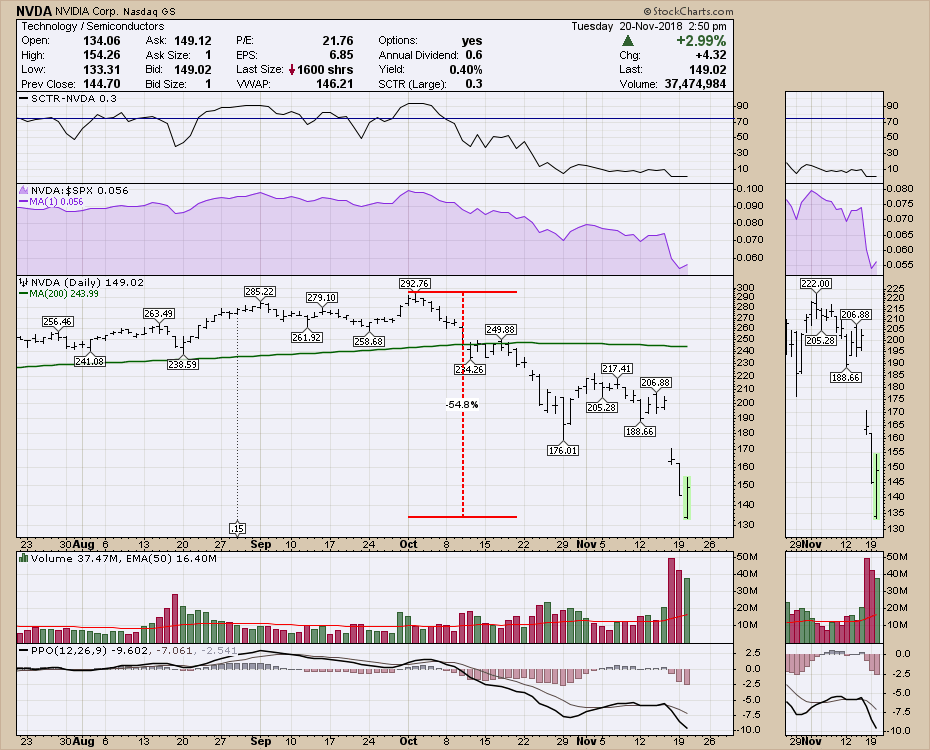
Looking at NVDA, it was down 55% off the highs, but came back and at the time of publishing was above yesterdays close. That's a pretty big rebound.
 These big name stocks are trying to bottom. Facebook and Amazon both got back into positive territory after steep drops on the open. So this wild environment shows some buyers are stepping in here in the beaten down tech sector. Just a heads up suggesting things could be turning.
I think the video is much watch every week, but if you like these setups please watch the video. I caution that extreme moves come both ways when the charts are setup with this much tension.
Here is this week's broad market review video.
This video covers off some of the recent price action including Gold and a return to some of the growth sectors.
If you are looking for a small gift, you might have family or friends that would like to learn more about the basics of charting. The first section of the book walks through all the chart settings to get the charts you want. The second section is why you might use charts for investing and the third section is putting it all together.
Click here to buy your copy today! Stock Charts For Dummies.
The Canadian Technician video shows the bounce off the late October lows in Canada. Canada is back below the 2008 highs. Tough ten years for investors.
If you are missing intermarket signals in the market, follow me on Twitter and check out my Vimeo Channel often. Bookmark it for easy access!
Good trading,
Greg Schnell, CMT, MFTA
Senior Technical Analyst, StockCharts.com
Author, Stock Charts for Dummies
Hey, have you followed me on Twitter? Click the bird in the box below!
Want to read more from Greg? Be sure to follow his StockCharts blog:
The Canadian Technician
