Don't Ignore This Chart! January 31, 2019 at 04:55 AM
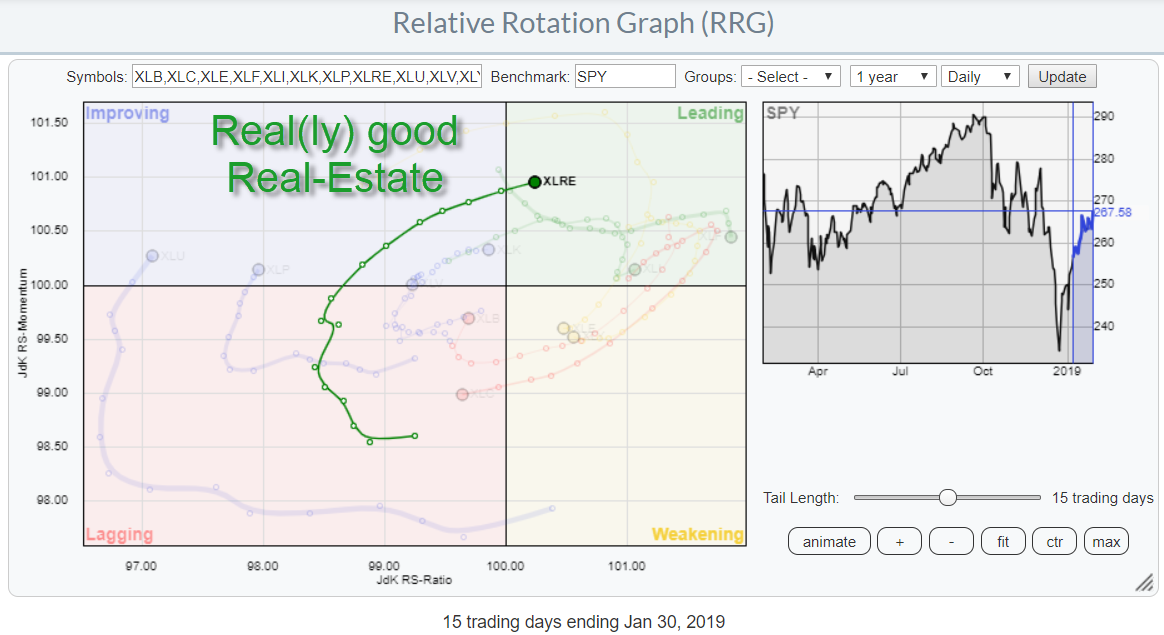
The Relative Rotation Graph for US sectors shows a remarkably steady rotation for the Real-Estate sector. This is a daily RRG showing a 15 day tail, or three weeks... Read More
Don't Ignore This Chart! January 30, 2019 at 09:11 AM

Autozone (AZO) is a leading stock because it recorded a 52-week high in December and remains above the rising 200-day SMA. The S&P 500, on the other hand, recorded a 52-week low in December and remains below its 200-day SMA... Read More
Don't Ignore This Chart! January 29, 2019 at 04:35 PM
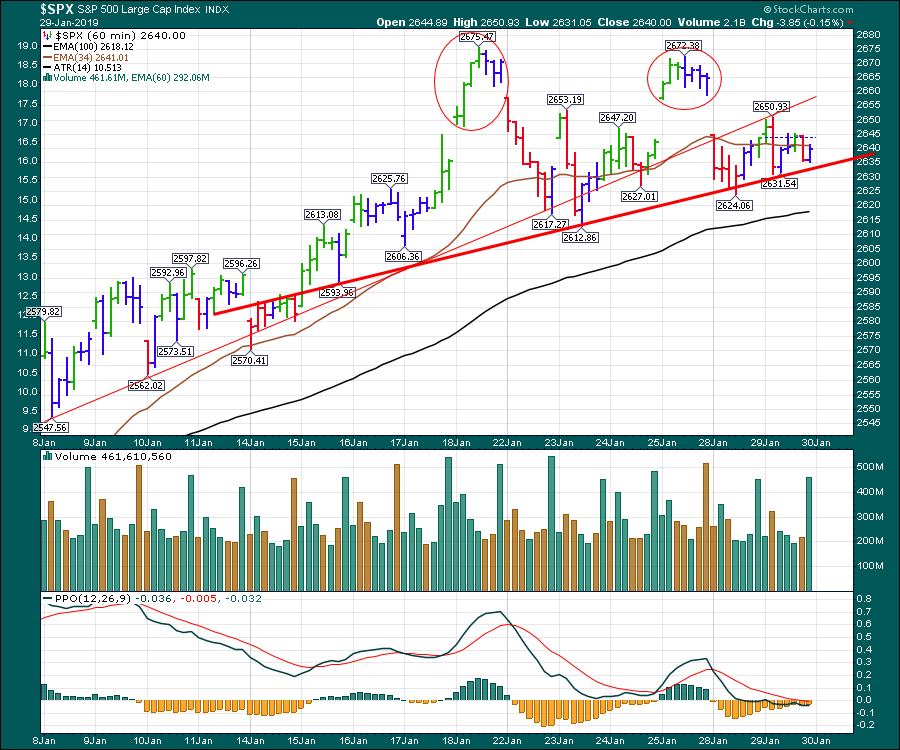
Well, what's it going to be - up or down? The market made its high on Options Expiration Friday and has been unable to take out that high for 6 days... Read More
Don't Ignore This Chart! January 28, 2019 at 10:19 AM
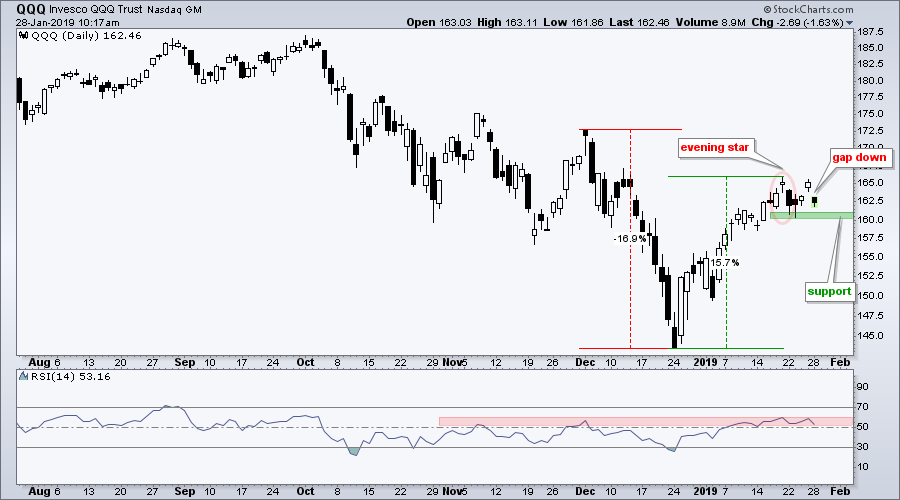
Last week (Monday) I featured an evening star reversal pattern in QQQ. This pattern did not foreshadow further weakness as QQQ firmed in the 161 area the next day and gapped up on Friday. This gap did not last long as QQQ gapped down on Monday morning and filled Friday's gap... Read More
Don't Ignore This Chart! January 27, 2019 at 10:30 AM
There are a lot of bases forming currently inside the great wall of China. After suffering a huge downtrend, these charts are setting up for new buy signals each and every day... Read More
Don't Ignore This Chart! January 24, 2019 at 05:53 AM
One of the pages that I often visit on Stockcharts.com is the sector summary. It gives a tabular overview of the price changes that occurred over a certain period (you can choose)... Read More
Don't Ignore This Chart! January 23, 2019 at 06:50 AM
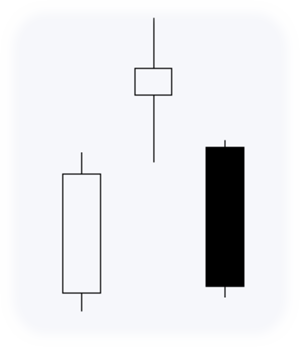
Despite a 15% surge the prior 17 days, the Nasdaq 100 ETF (QQQ) remains below its flattening 200-day SMA and the ETF formed a rare evening star candlestick pattern over the last three days. First and foremost, I think the long-term trend is down for QQQ... Read More
Don't Ignore This Chart! January 22, 2019 at 08:34 PM
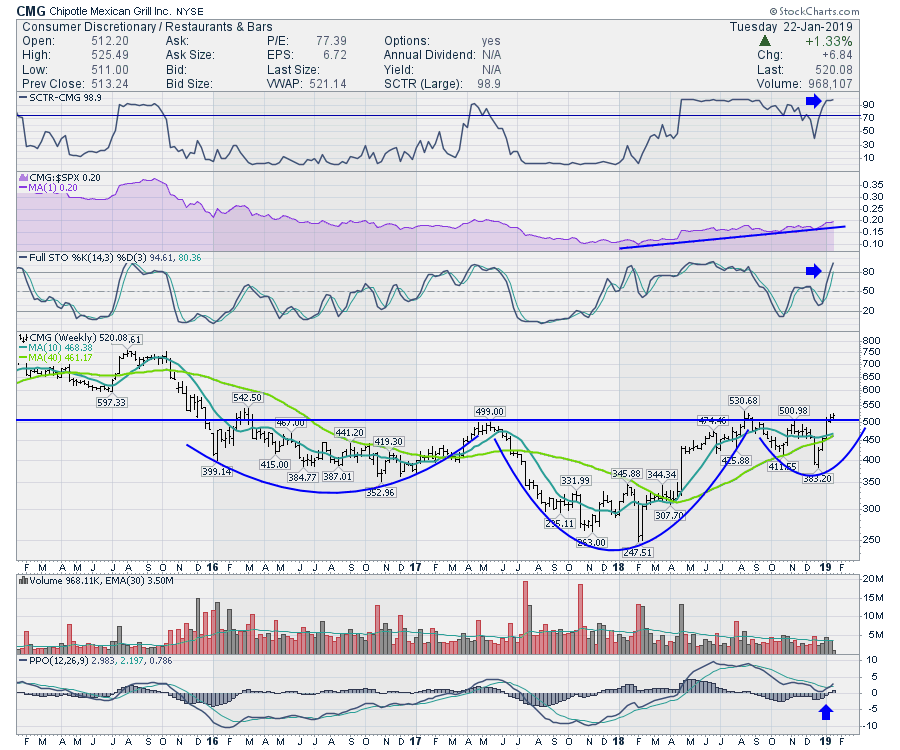
Chipotle has been building a very large base over the last couple of years. With Tuesday's move, it is now trying to break out above the consolidation. The SCTR has resumed its strong presence, while the relative strength in purple continues to run to the upside... Read More
Don't Ignore This Chart! January 18, 2019 at 09:45 AM
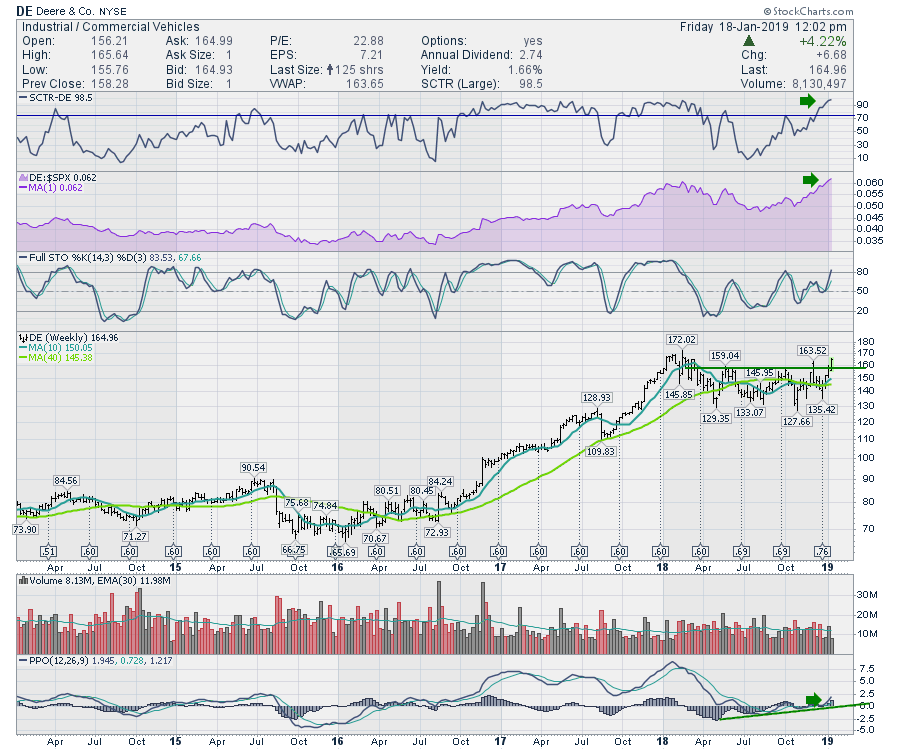
There's been a nice surge in the Commercial Vehicles group over the past month. One of the leaders in the group is Deere & Co. (DE) which outperformed all of 2017 and consolidated through 2018... Read More
Don't Ignore This Chart! January 17, 2019 at 04:04 AM
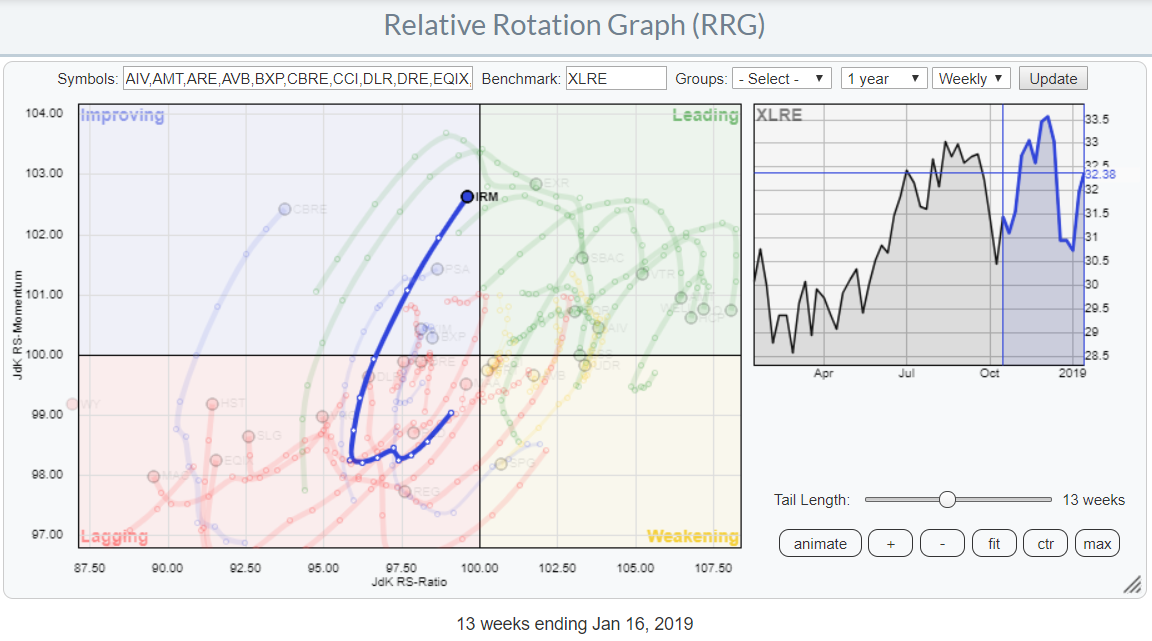
The Relative Rotation Graph above highlights the rotation of IRM (Iron Mountain Inc.) in comparison to the other stocks in the S&P Real-Estate sector (XLRE)... Read More
Don't Ignore This Chart! January 16, 2019 at 08:10 AM

Most stocks have struggled since November, but Palo Alto Networks managed to reverse at a key area and break above a resistance zone. The chart below shows PANW with weekly bars over the last 3 years... Read More
Don't Ignore This Chart! January 15, 2019 at 02:38 PM
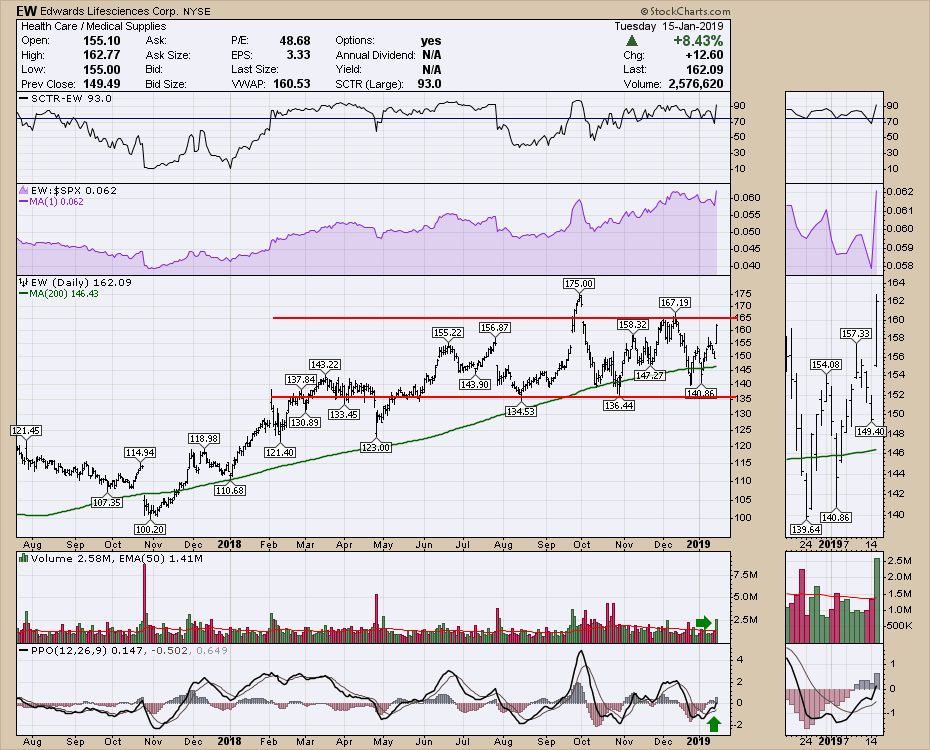
Edwards LifeScience (EW) had a big move this week - having been inside a trading range for most of 2018, EW is now testing the top of the consolidation... Read More
Don't Ignore This Chart! January 14, 2019 at 11:04 AM

Stocks surged over the last 12 days with the S&P 500 gaining over 10% and moving above its late December high. Coca-Cola (KO) was leading the market with a new high in November, but did not partake in the broad market rally here in January. SPY is up around 3... Read More
Don't Ignore This Chart! January 13, 2019 at 11:33 PM
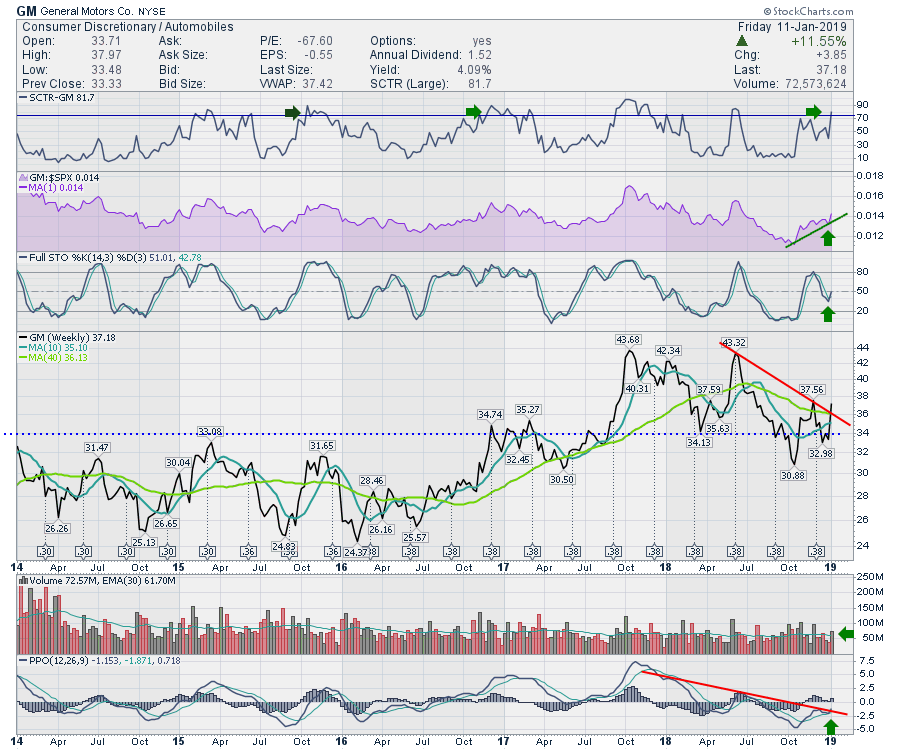
General Motors had a great week. The real question is whether it can fire on all cylinders? I like the chart as the whole industry group had a great week... Read More
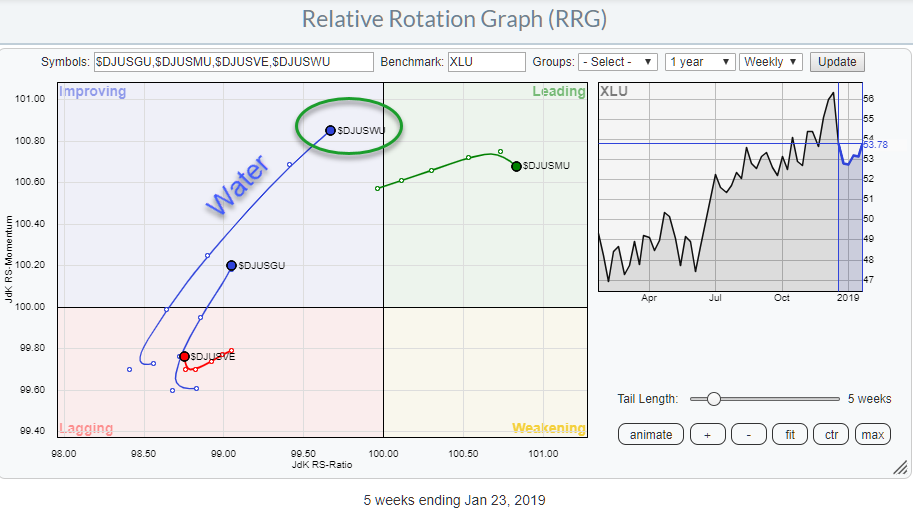
Don't Ignore This Chart! January 10, 2019 at 08:21 AM
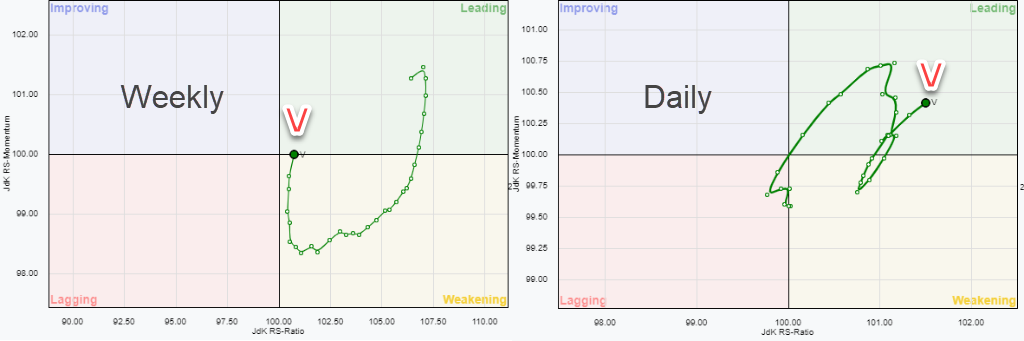
Visa is showing up, just, inside the leading quadrant on the Relative Rotation Graph vs $INDU above. These images are zoomed in from the RRG holding all the 30 DJ Industrials stocks (benchmark $INDU)... Read More
Don't Ignore This Chart! January 09, 2019 at 06:18 AM

Netflix was the first of the five FAANG stocks to peak in June 2018 and is now the first of the five to break its December high. Thus, Netflix is leading the FAANGs here in January because it is the only one with a higher high... Read More
Don't Ignore This Chart! January 08, 2019 at 04:59 PM
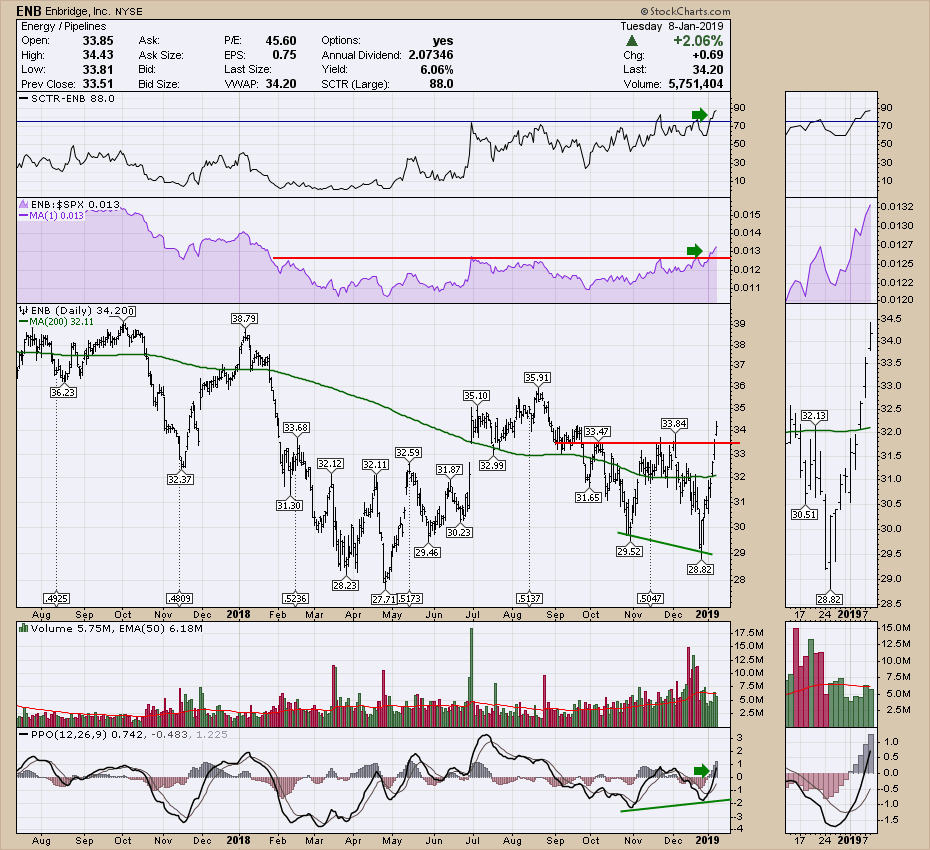
This pipeline business is a stable cash flow generator that also pays a healthy dividend of 6%. Enbridge is a large North American pipeline company with some projects in the works that should come on stream in 2019... Read More
Don't Ignore This Chart! January 07, 2019 at 11:17 AM

The broad market environment remains rather negative overall with the S&P 500 well below its falling 200-day SMA and volatility increasing over the last few months. Note that the different environments were highlighted in ChartWatchers this weekend... Read More
Don't Ignore This Chart! January 04, 2019 at 11:22 PM
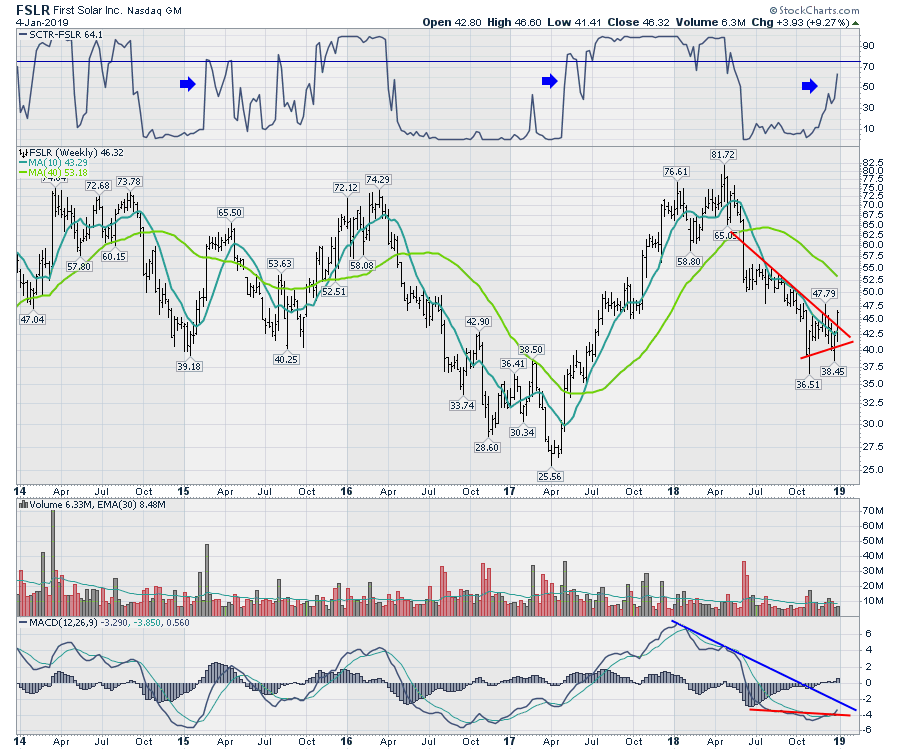
First Solar has been a volatile stock. When it trends well, it can make incredible runs. However, the stock had been dropping into the fourth quarter... Read More
Don't Ignore This Chart! January 03, 2019 at 05:18 AM
With the US stock market declining investors (may) need to look for alternatives in order to preserve capital. Sure enough, there are good opportunities in the US with bonds, IEF is doing very well, and cash is a very viable alternative if you do not "need" to be invested... Read More
Don't Ignore This Chart! January 02, 2019 at 09:12 AM

With December complete, chartists can now examine monthly close-only charts for an assessment of the long-term trend and stock market risk. Spoiler: it is not a pretty picture. Before looking at the chart, let's review the concept behind Price Channels... Read More
Don't Ignore This Chart! January 01, 2019 at 07:11 PM
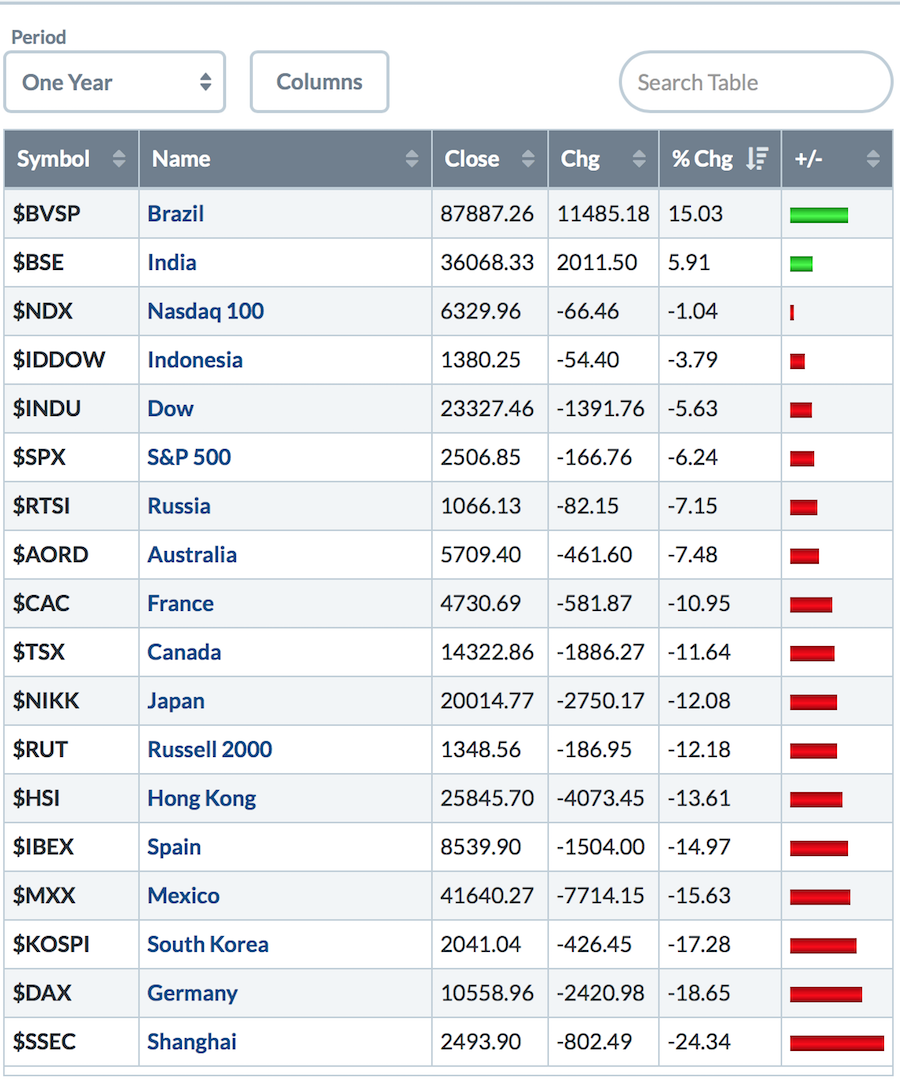
It was a tough year around the globe. The indexes were hit with a downdraft. Notice the NASDAQ 100 finished marginally in the red. Two bright spots were Brazil and India; the little bar in India at 5... Read More