Don't Ignore This Chart! March 29, 2019 at 01:20 PM
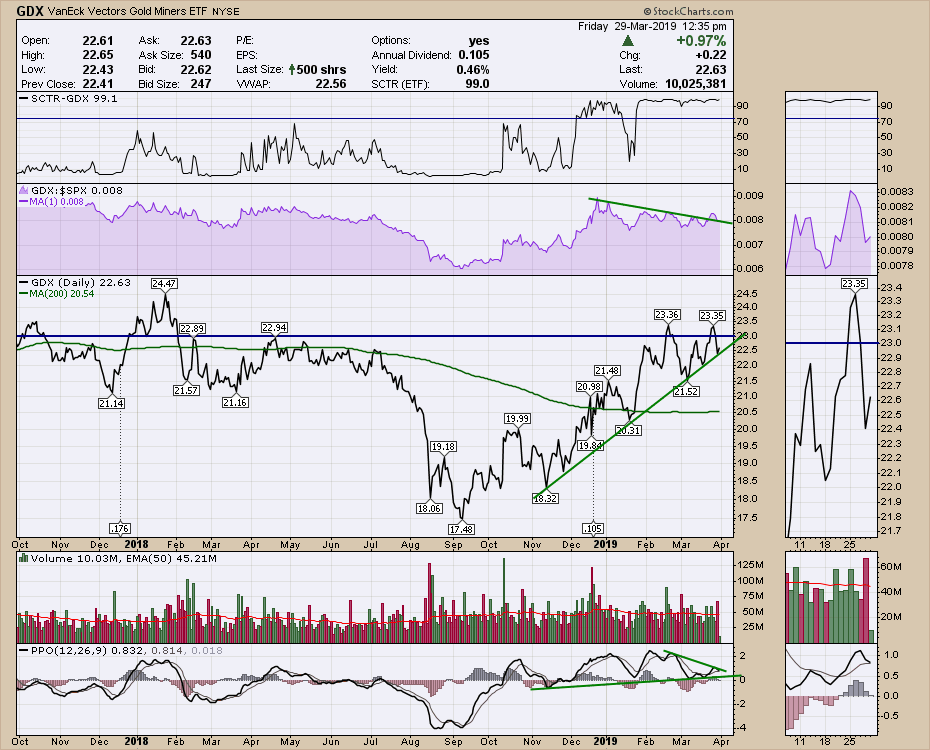
On Tuesday, I published an article on the breakout in the gold miners, wherein I showed three charts that supported the thesis of Gold and gold miners going higher. One of the benefits of technical analysis is knowing when you are wrong... Read More
Don't Ignore This Chart! March 28, 2019 at 05:46 AM
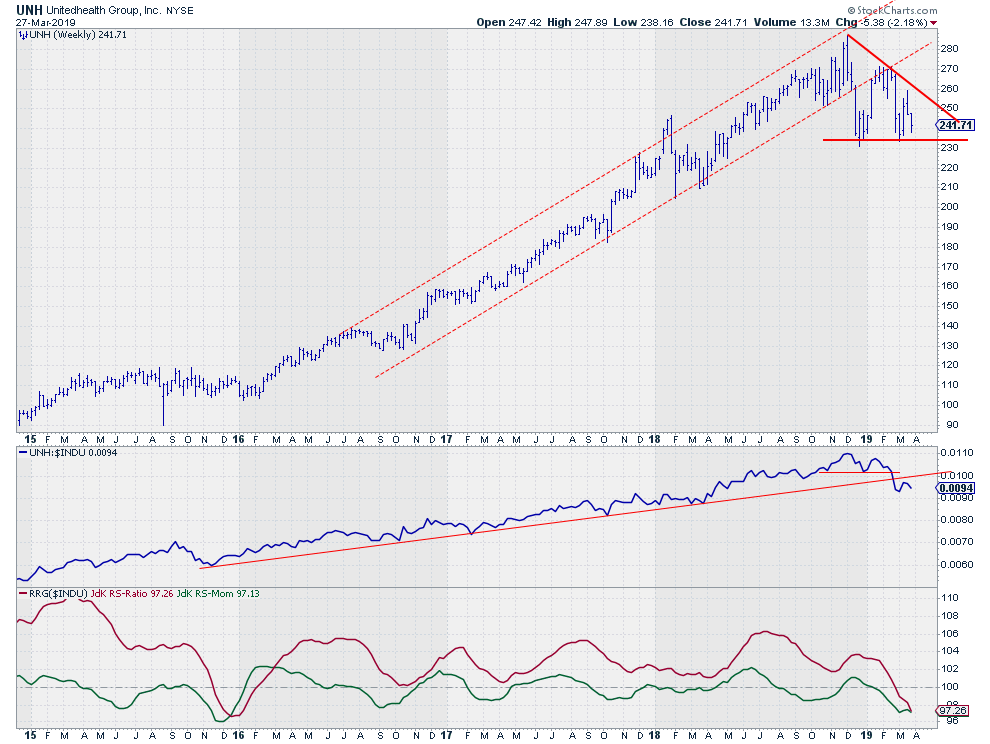
The weekly chart for UnitedHealth (UNH) shows a steady uptrend in both price and relative (vs $INDU) since the start of 2016. That three-year move just came to an end. The uptrend in relative strength emerged out of the low that was set in late 2015... Read More
Don't Ignore This Chart! March 26, 2019 at 09:41 PM
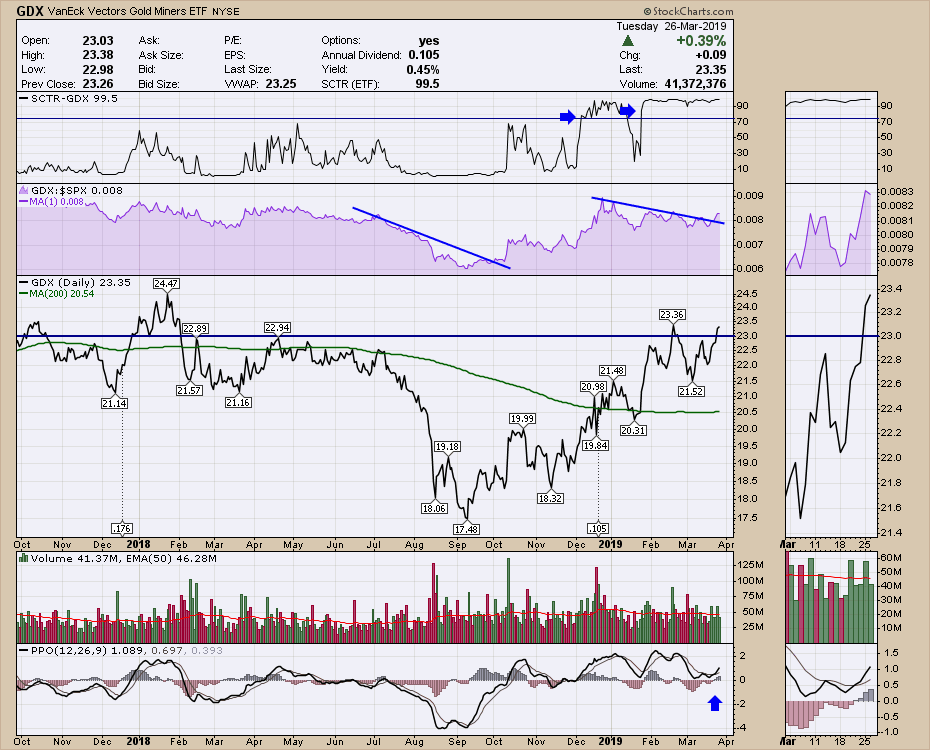
Gold miners have really started to shine of late. The SCTR ranking of GDX, which represents the gold miners as an ETF, pushed up a couple of months ago. After surging to new 52-week highs in February, the gold miners quickly pulled back... Read More
Don't Ignore This Chart! March 25, 2019 at 12:30 PM

TJX Companies (TJX) is part of the S&P 500 and the Consumer Discretionary SPDR (XLY). It is also part of two growth ETFs (PWB and PXLG)... Read More
Don't Ignore This Chart! March 24, 2019 at 10:52 PM
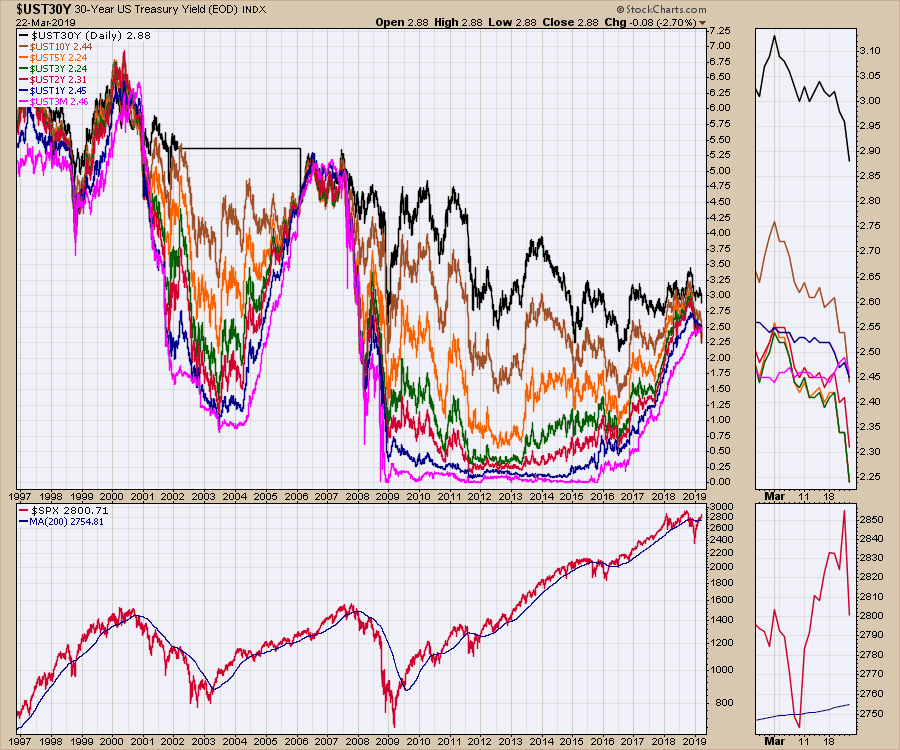
Much has been made of the 10-year yield dropping below the 3-month yield. In this week's case, it was particularly acute. The equity market (stocks) plummeted as the yields fell hard. US banks dropped significantly... Read More
Don't Ignore This Chart! March 21, 2019 at 06:36 AM
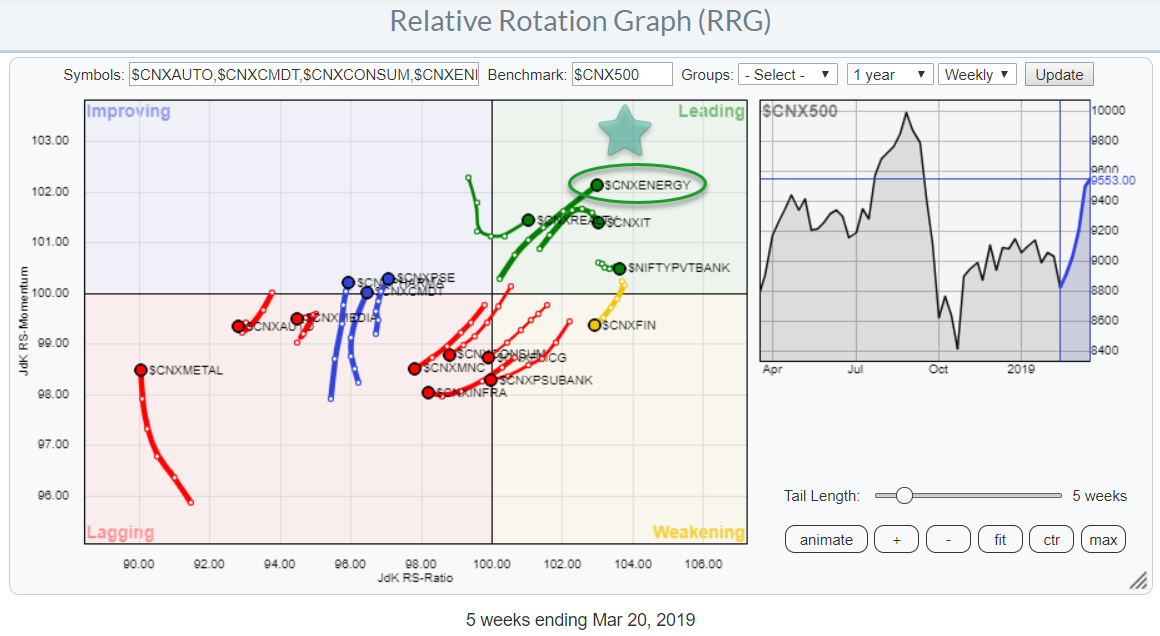
The list of pre-defined groups in the RRG-menu has been expanded with the universe covering Indian sectors against the Nifty 500 index as the benchmark. Very recently also the universe of individual stocks making up the Sensex 30 index was added... Read More
Don't Ignore This Chart! March 20, 2019 at 08:29 AM

Advance Auto Parts (AAP) hit a new high in November and then moved into a corrective phase. Keep in mind that a correction can involve a decline or a consolidation, or even a combination of the two... Read More
Don't Ignore This Chart! March 19, 2019 at 06:10 PM
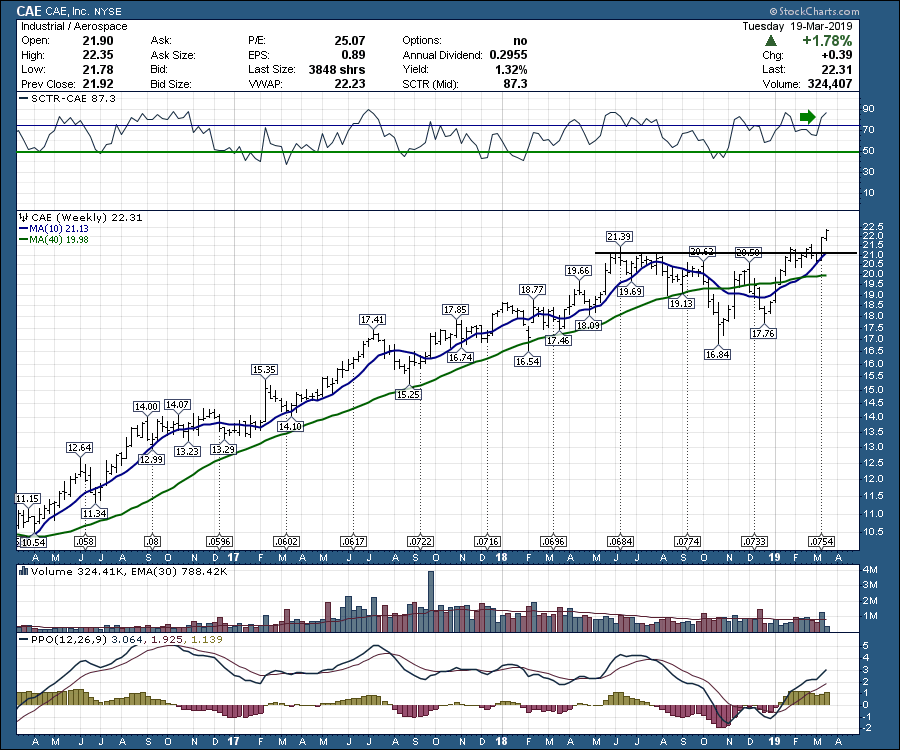
In the aftermath of the Boeing 737 Max 8 issues, I was looking around the industry to see charts that might be affected by the subsequent grounding of the aircraft. Last week, a beautiful breakout occurred on CAE Systems (CAE), which makes flight simulators to train pilots on... Read More
Don't Ignore This Chart! March 18, 2019 at 06:56 AM

Amazon is lagging the Nasdaq 100 ETF (QQQ) and the broader market over the last two months because it has yet to clear its January high and remains below the 200-day SMA... Read More
Don't Ignore This Chart! March 15, 2019 at 01:11 PM
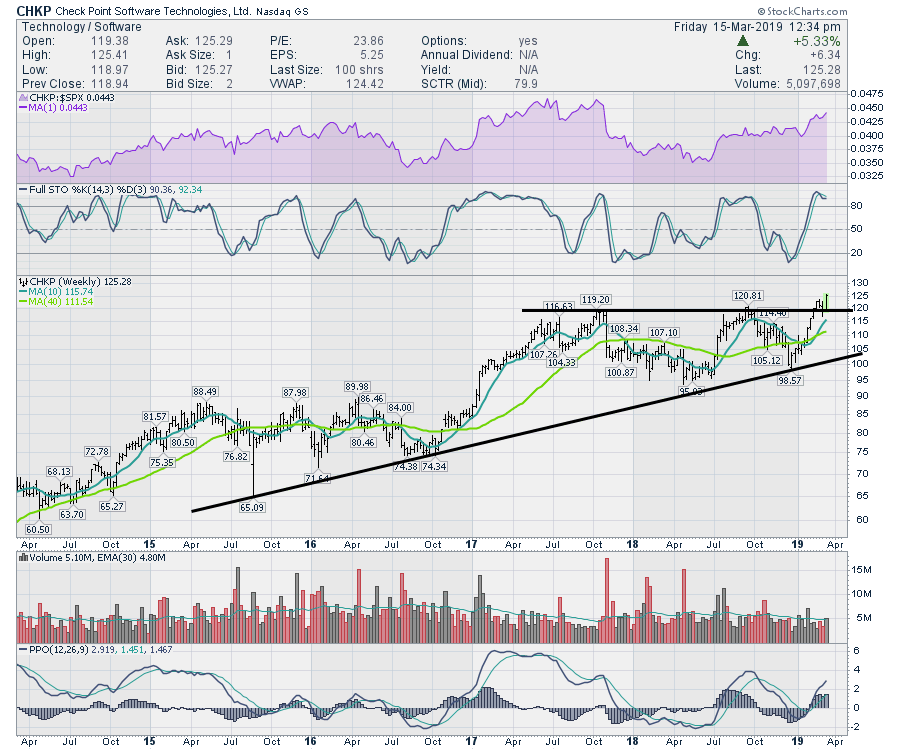
Check Point Software (CHKP) has been a consistently strong stock over the years. For the last 18 months, the stock has been consolidating and, as of this week, looks ready to make its next move to higher highs. As long as the breakout holds above $120, the stock looks great... Read More
Don't Ignore This Chart! March 14, 2019 at 11:02 AM
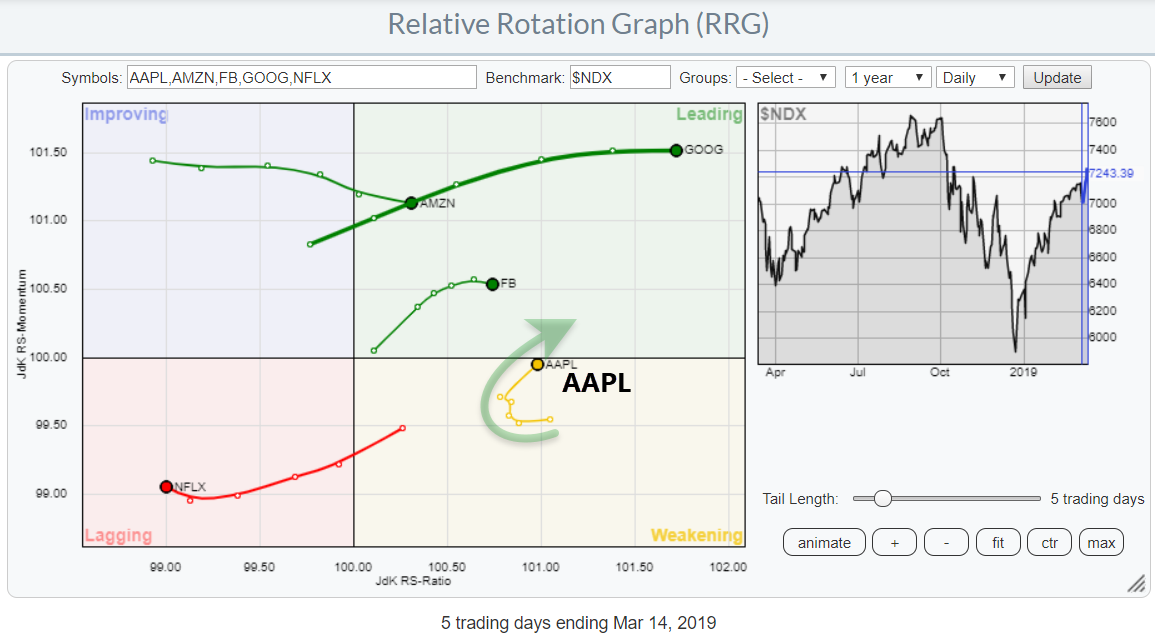
The Relative Rotation Graph shows the FAANG stocks against $NDX on a daily basis. The strong move of GOOG is evident and tracks the recent break of resistance... Read More
Don't Ignore This Chart! March 13, 2019 at 09:06 AM
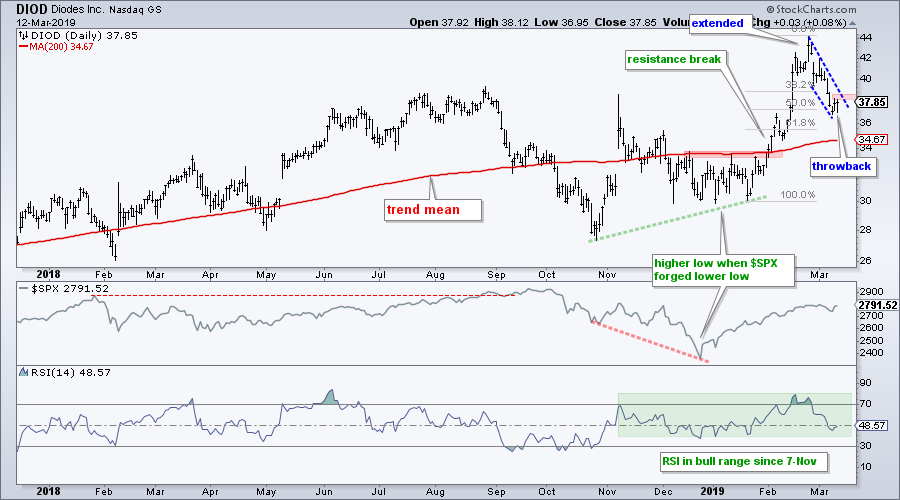
Diodes (DIOD), a semiconductor stock, is returning to the trend mean and this could provide a bullish setup to take part in the long-term uptrend. The chart below shows DIOD with a breakout and surge to new highs in February... Read More
Don't Ignore This Chart! March 13, 2019 at 12:56 AM
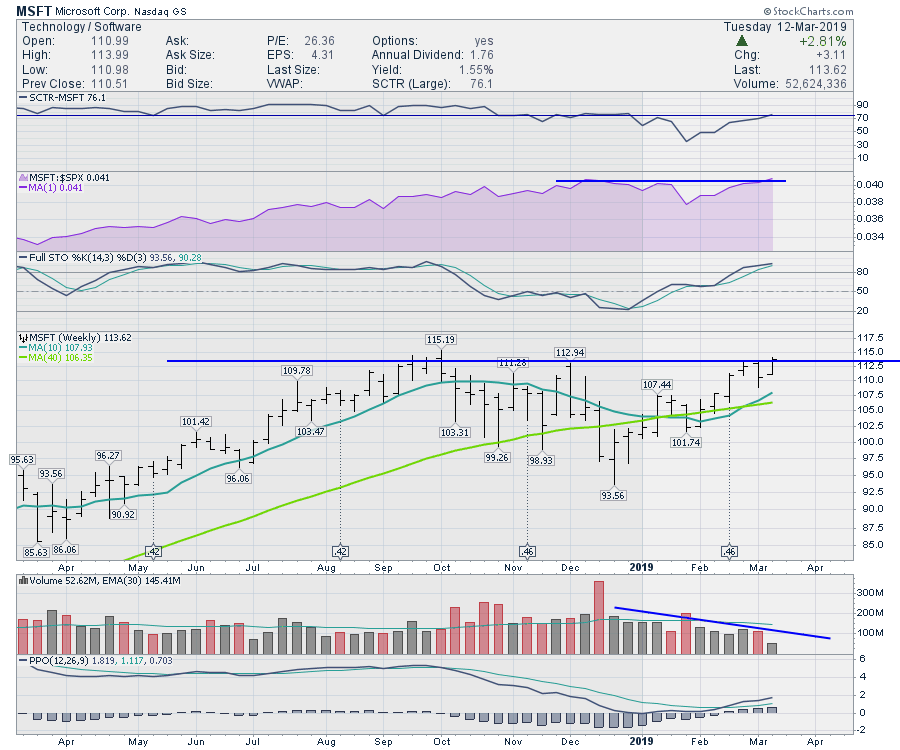
Microsoft (MSFT) is currently up near the previous highs. This comes after a great rally to start the year. As a technician, I consider a previous high as resistance... Read More
Don't Ignore This Chart! March 11, 2019 at 10:18 AM
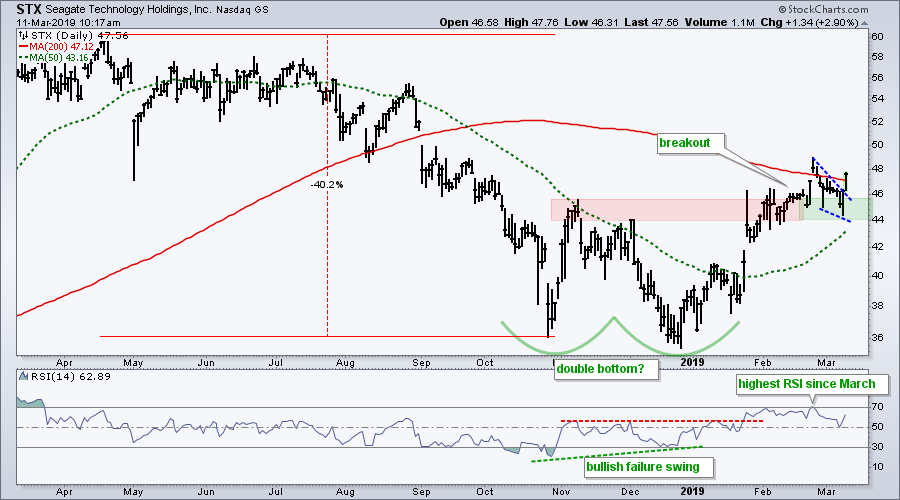
Seagate Technology was one of the weakest tech stocks in 2018 as it fell around 40% from the April high to the October low. Things appear to be turning about here in 2019 as stock finds its footing and triggers two breakouts... Read More
Don't Ignore This Chart! March 08, 2019 at 02:54 PM
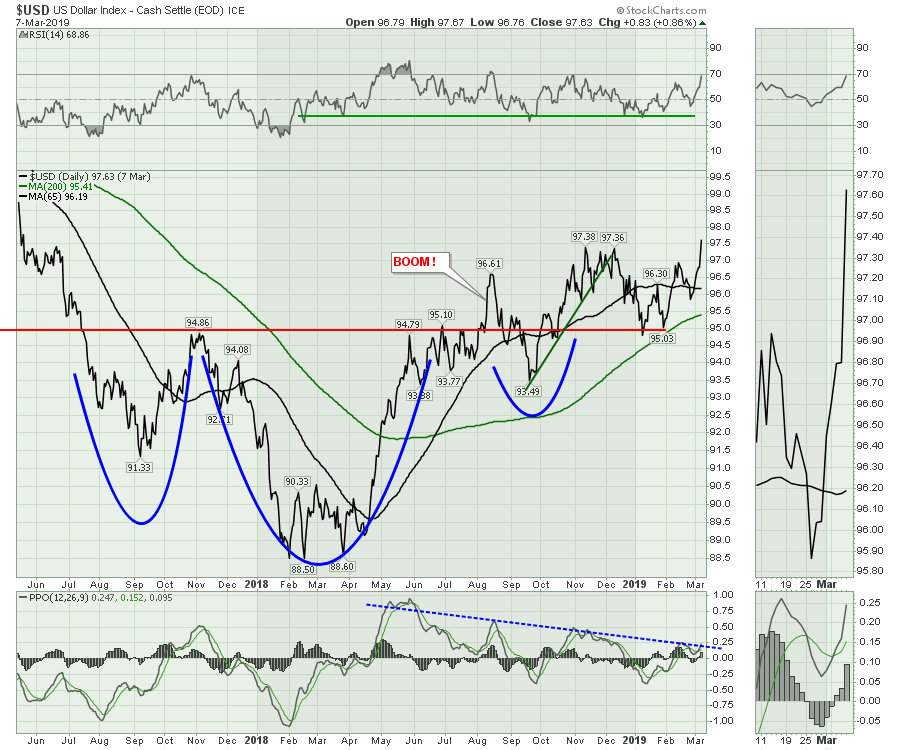
Currency charts are just one type of asset class. They can play a pivotal role in many, many industry groups; they can affect the bond markets, the commodity markets and the equity markets in a single move... Read More
Don't Ignore This Chart! March 07, 2019 at 07:16 AM
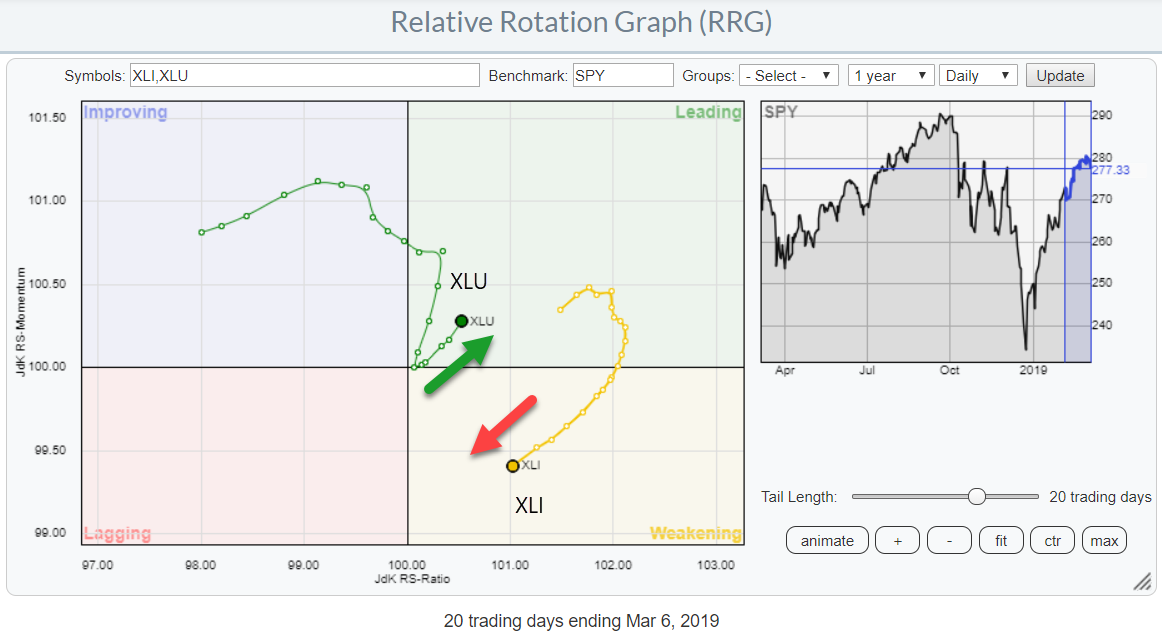
The above Relative Rotation Graph shows the daily rotation over the past 20-days for the Utilities and Industrials sectors. I have isolated the tails of these two sectors to be able to show them in more detail and highlight the opposite directions that they started moving in... Read More
Don't Ignore This Chart! March 06, 2019 at 08:37 AM

Tilray (TLRY) listed on the Nasdaq at $17 with an IPO in July and promptly surged above $300. The stock then worked its way below 100 over the next few months and managed to stabilize in the 65 to 80 zone this year... Read More
Don't Ignore This Chart! March 05, 2019 at 12:31 PM
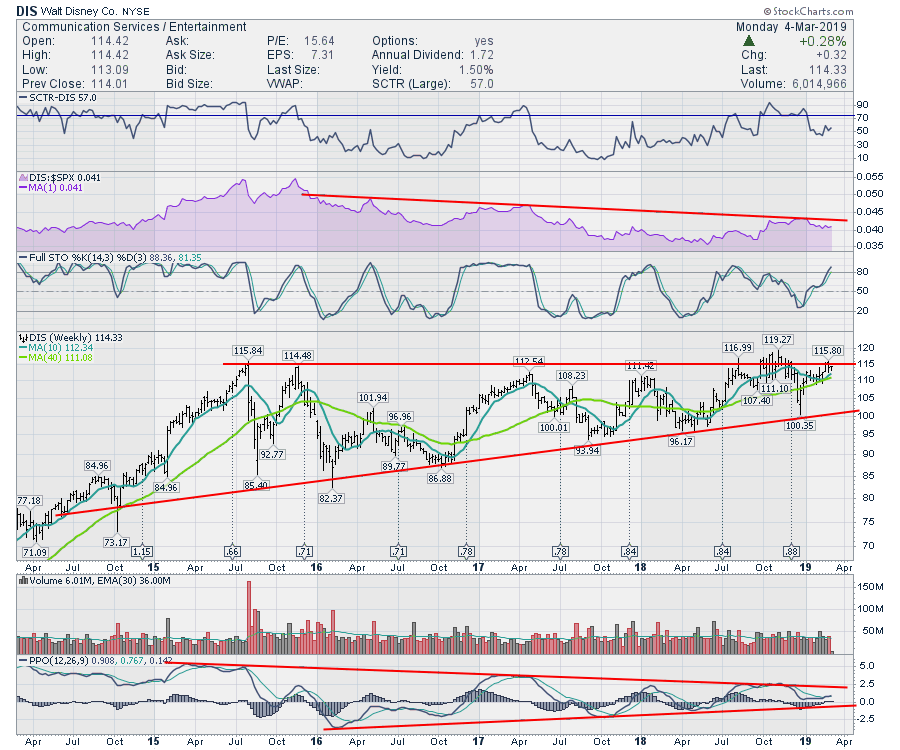
There is a specific culture on this continent that walks and talks the Star Wars franchise. This year, Disney has the Millennium Falcon ready to launch in both of their American theme parks... Read More
Don't Ignore This Chart! March 04, 2019 at 07:57 AM

Google, or rather Alphabet, broke out of a short-term consolidation and this could have long-term implications. The chart below shows GOOGL hitting support in the 980-1000 area from October to December... Read More
Don't Ignore This Chart! March 01, 2019 at 03:54 PM
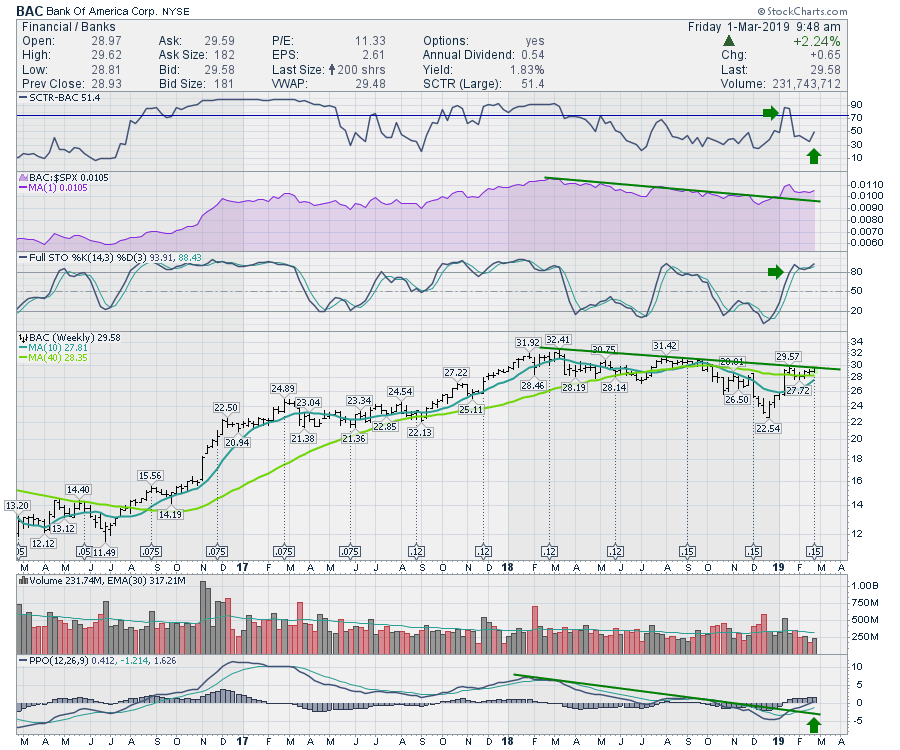
One of the most watched banks is Bank of America (BAC), whose chart has been one of consolidation over the past 12 months... Read More