Don't Ignore This Chart! April 30, 2019 at 07:13 PM
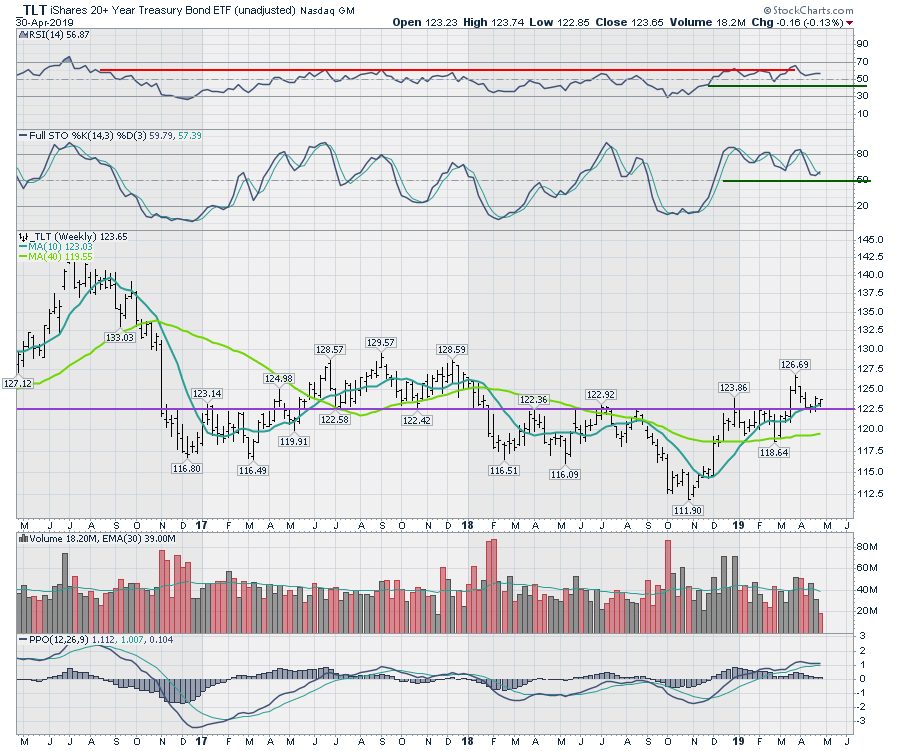
The bond market has narrowed itself into a tight range. Below is the TLT chart, with the yield payments removed from the price action. This chart allows us to see how the price is moving, and right now it is sitting at a particularly interesting junction... Read More
Don't Ignore This Chart! April 29, 2019 at 09:57 AM

Palo Alto Networks (PANW) is a leading cyber-security stock that fits into the technology sector. Needless to say, the Technology SPDR (XLK) and the EW Technology ETF (RYT) are the leading sectors here in 2019... Read More
Don't Ignore This Chart! April 26, 2019 at 02:03 PM
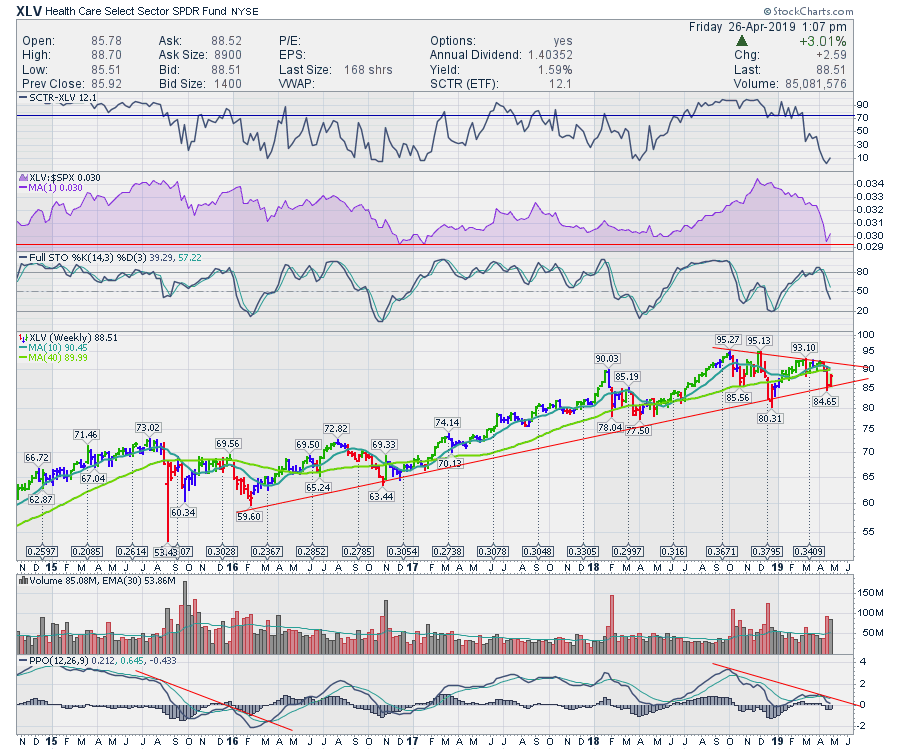
The Healthcare sector recently broke to 2019 lows. Does that make the sector a don't-touch, even as the market makes all-time highs? Well, this week's price bar looks like a strong bounce off a three-year support line... Read More
Don't Ignore This Chart! April 25, 2019 at 04:41 AM
Technology is doing very well on the Relative Rotation Graph for US sectors, with a rotation that is well inside the leading quadrant and pushing further into it... Read More
Don't Ignore This Chart! April 24, 2019 at 07:25 AM

Coupa Software is one of the best performing stocks in 2019 with a 50% advance year-to-date. In addition, the stock is up over 80% from its late December low... Read More
Don't Ignore This Chart! April 23, 2019 at 02:30 PM
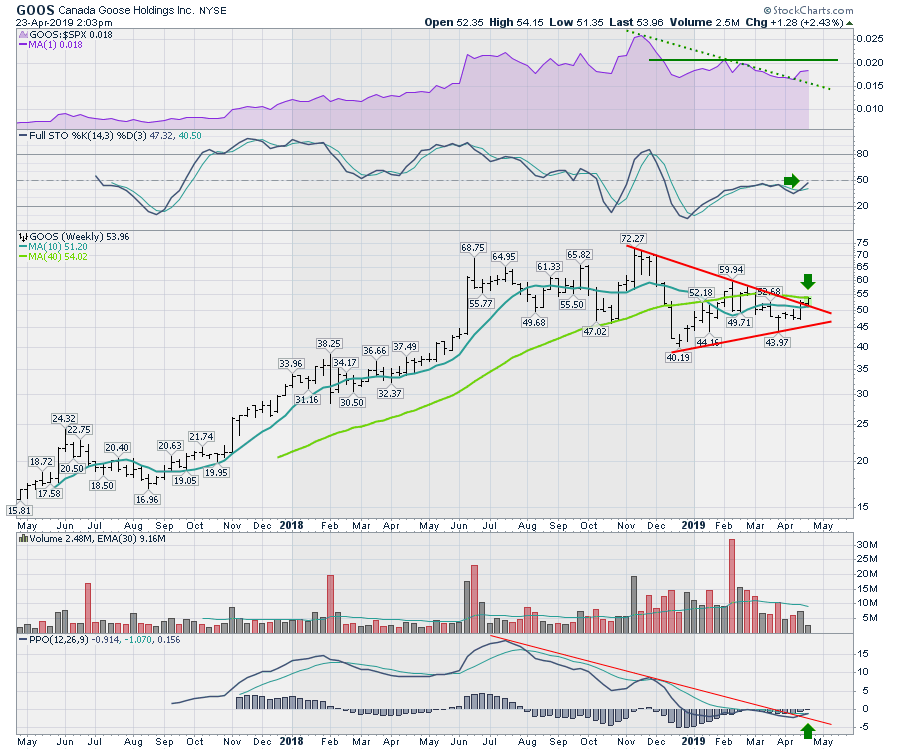
Buying retail at this time of year is tricky, but Canada Goose (GOOS) is sitting at an inflection point on the chart... Read More
Don't Ignore This Chart! April 22, 2019 at 11:36 AM
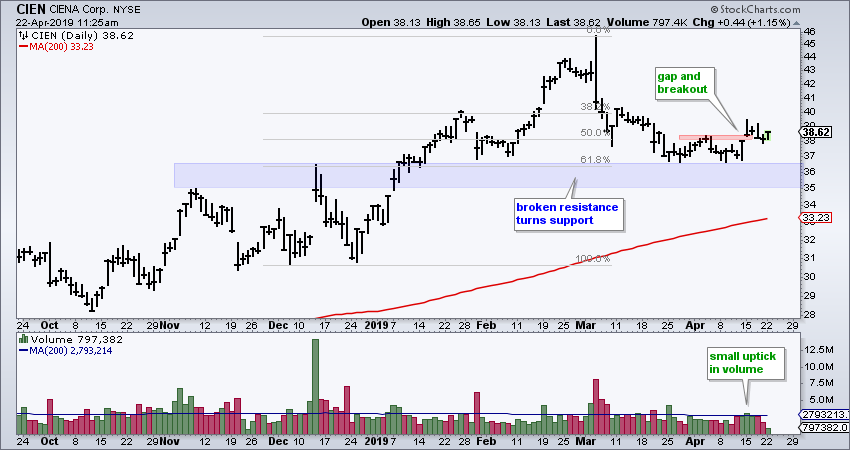
The ideal scenario for traders is to buy after a pullback for a good reward-to-risk ratio. When the long-term trend is up, I look for indications of support and signs that an upturn is in the making... Read More
Don't Ignore This Chart! April 20, 2019 at 03:00 PM
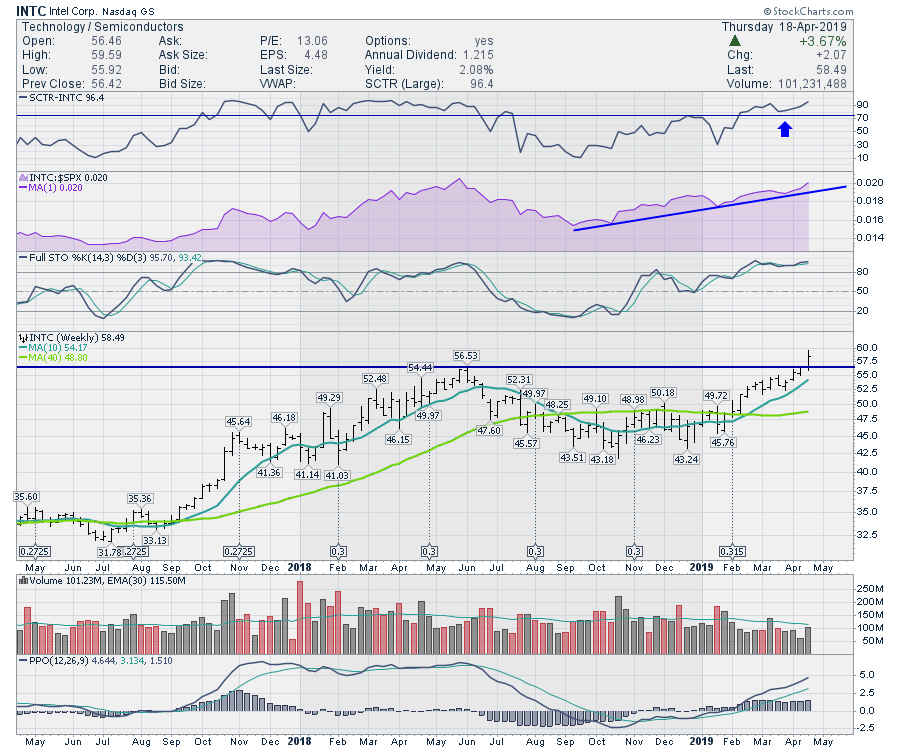
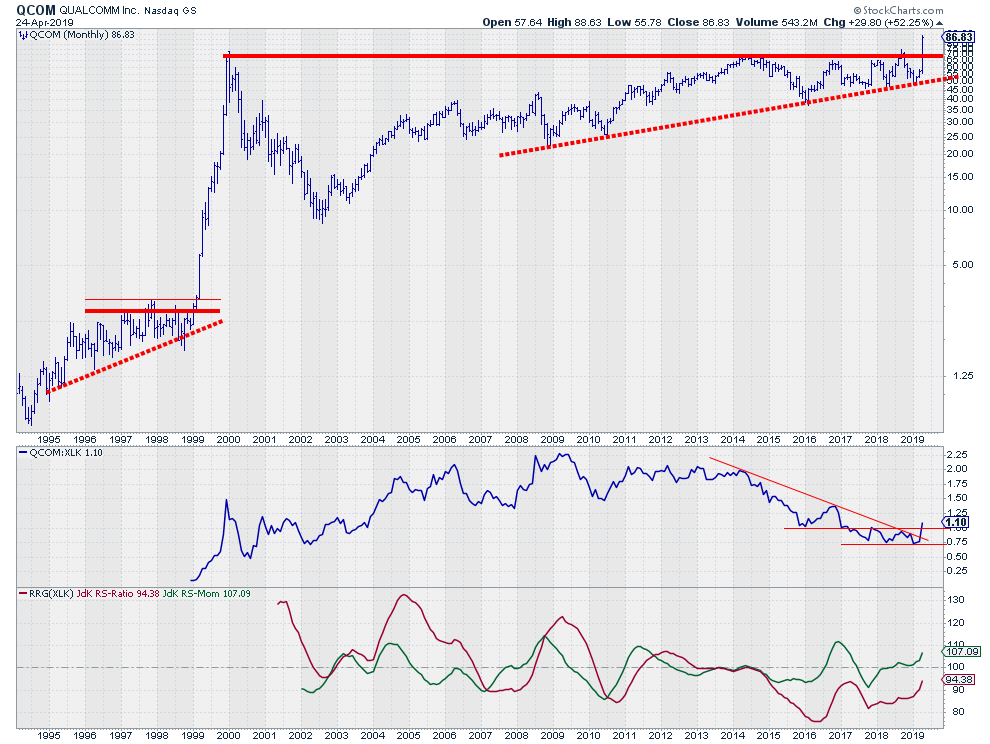
Intel (INTC) is one of the companies currently engaged in the 5G race. While all the attention was focused on the massive move in Qualcomm this week, Intel also quietly broke out to fresh new highs... Read More
Don't Ignore This Chart! April 18, 2019 at 04:58 AM
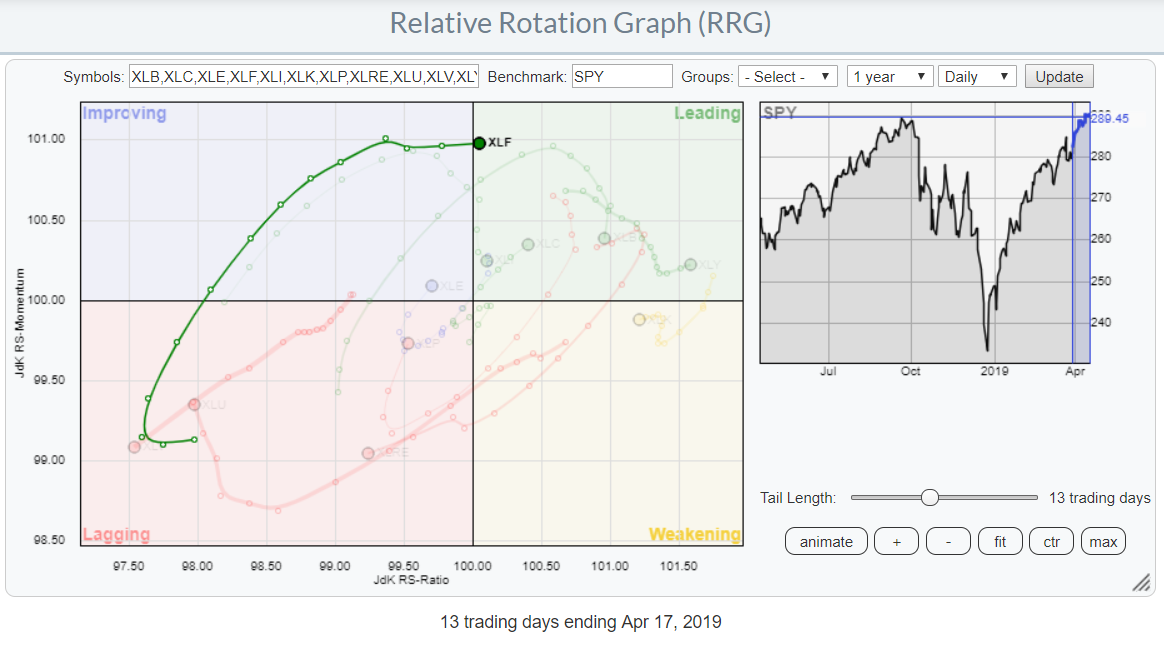
At yesterday's close, the Financials sector (XLF) crossed over into the leading quadrant on the daily Relative Rotation Graph... Read More
Don't Ignore This Chart! April 17, 2019 at 03:24 AM
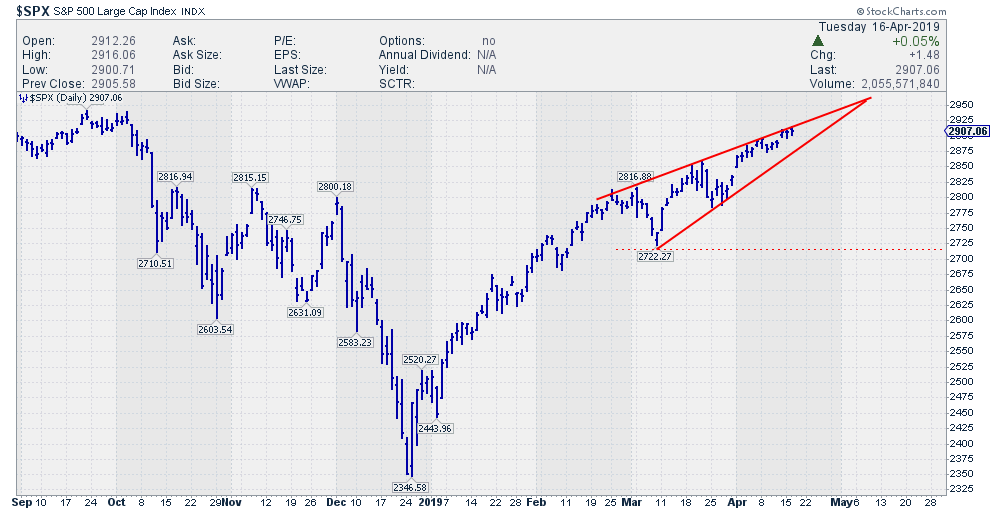
When acting in an environment of uncertainty (of which financial markets are a prime example) it is a good habit to double-check any findings. Think of it as an extra pair of eyes to confirm or deny what you (think you) are seeing... Read More
Don't Ignore This Chart! April 16, 2019 at 07:05 PM
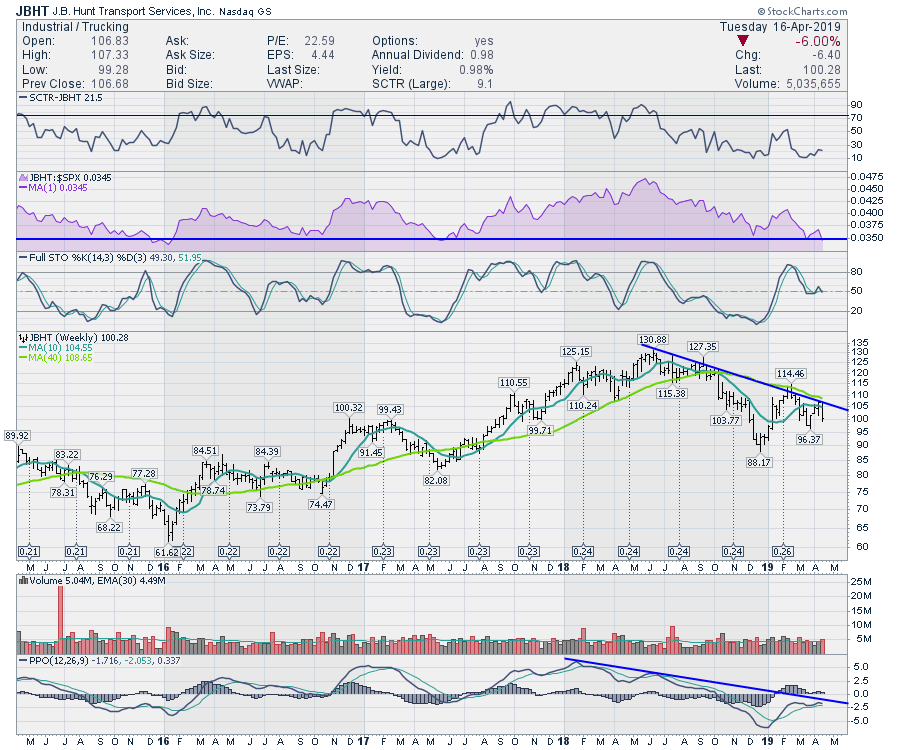
JB Hunt (JBHT) announced results that were not as positive as expectations and the stock dropped in response. The timing of the news happened to stall the stock right at the 40-week moving average... Read More
Don't Ignore This Chart! April 15, 2019 at 05:22 AM
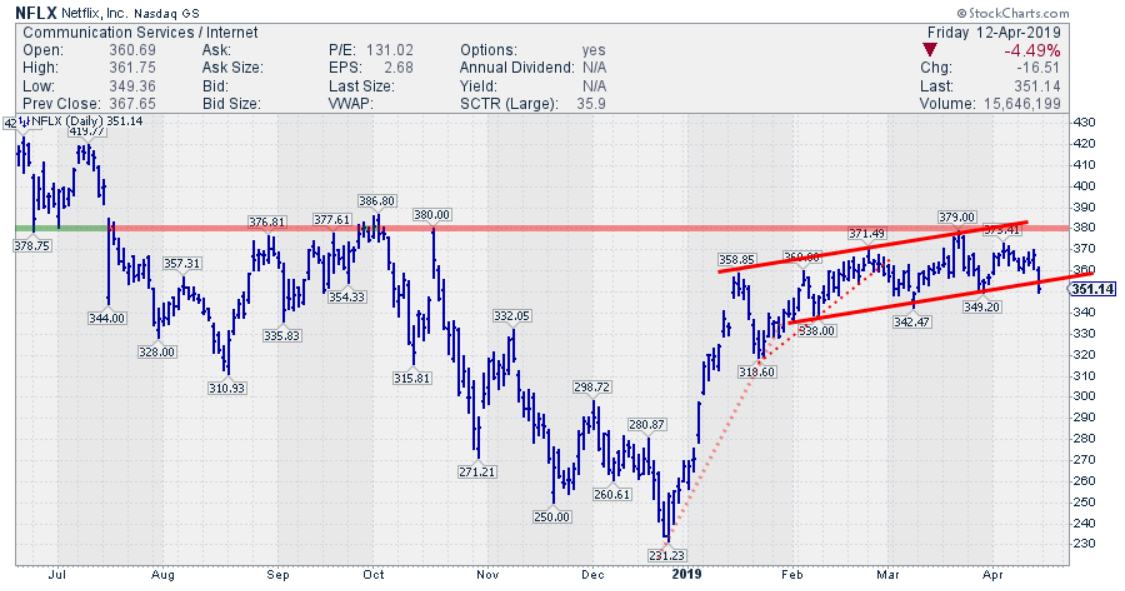
Since the beginning of the month, NFLX is lagging the S&P 500 index by more than 5%... Read More
Don't Ignore This Chart! April 12, 2019 at 12:38 PM
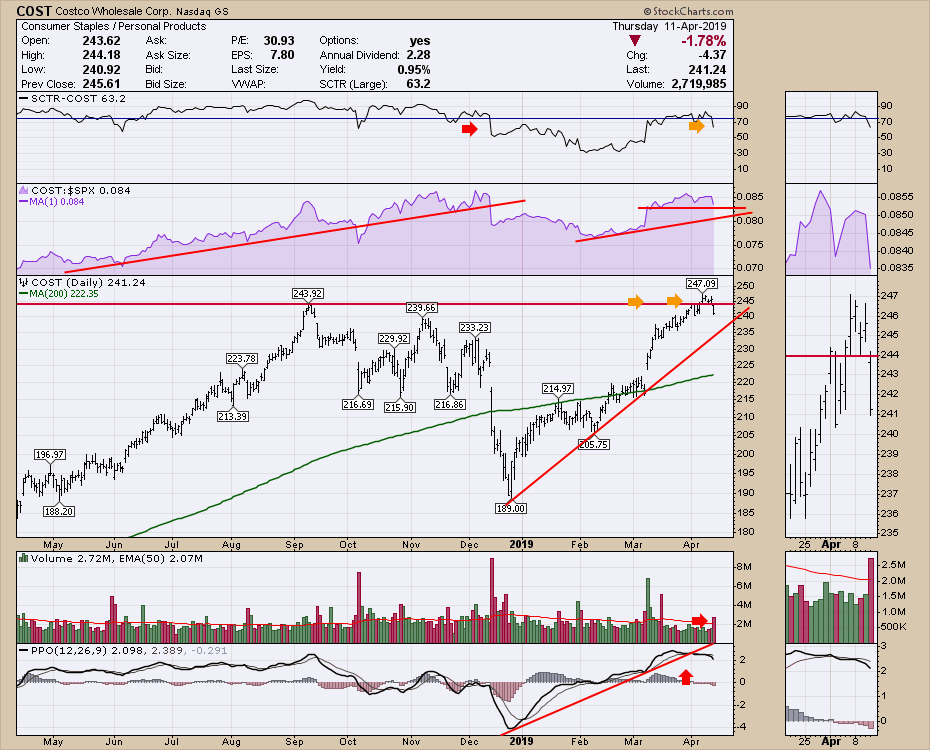
Costco (COST) is one of the great retailers in the modern age. Recently, I went to Best Buy to buy some home electronics, but ultimately found out Costco had a better bundle at a better price... Read More
Don't Ignore This Chart! April 11, 2019 at 05:35 AM
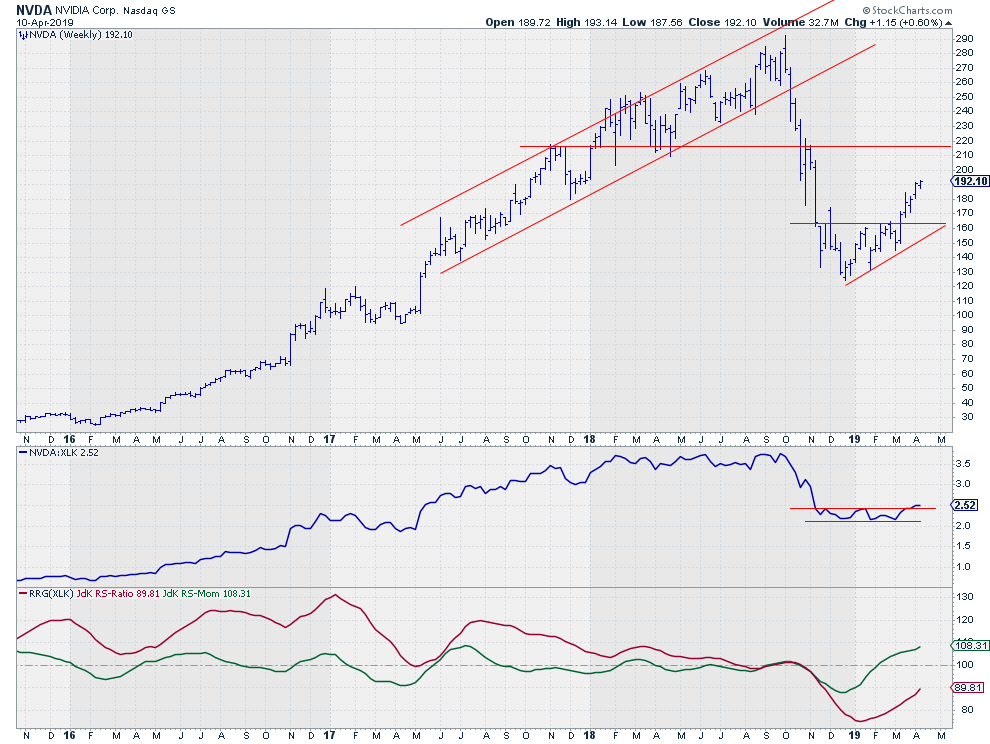
Looking over some Relative Rotation Graphs this morning showed me that the Information Technology sector is currently the strongest sector in the S&P 500 universe. XLK is positioned well inside the leading quadrant and is being powered further into that space by a long tail... Read More
Don't Ignore This Chart! April 10, 2019 at 12:25 AM
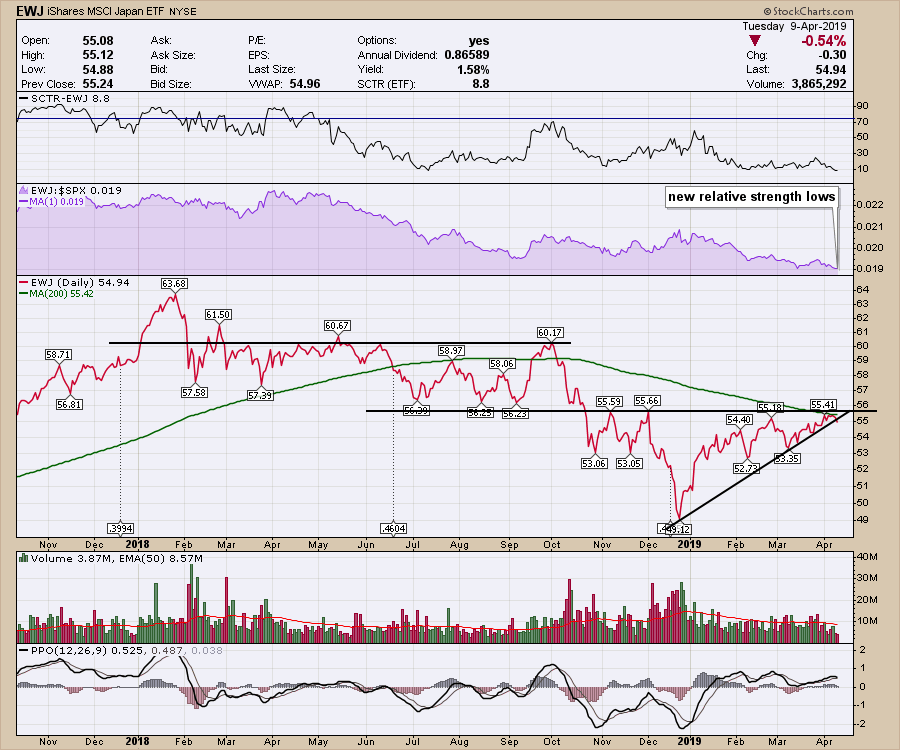
Japan is a market that I like to keep an eye on, as it's a big participant in the global economy. This week, the Japan ETF is in focus as it tries to get through the 200-day moving average, as well as make a topside breakout through a key resistance level... Read More
Don't Ignore This Chart! April 05, 2019 at 12:43 PM
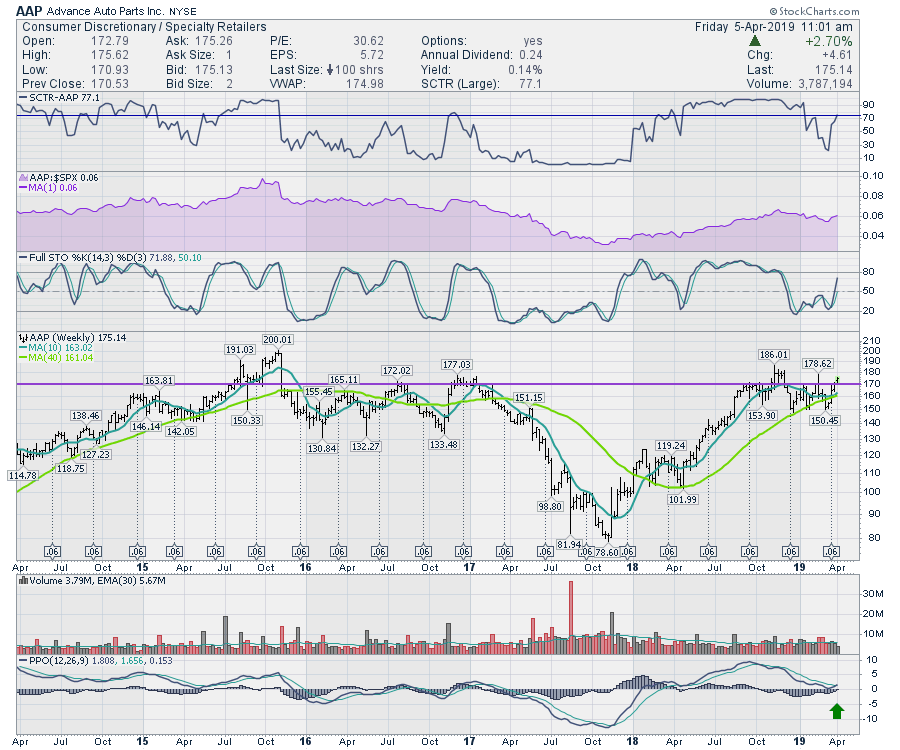
Advanced Auto Parts (AAP) has been struggling around the 170 level for years and we are back to that level once again. The SCTR has been strong, having recently pulled back as price consolidated through the first quarter... Read More
Don't Ignore This Chart! April 04, 2019 at 11:55 AM
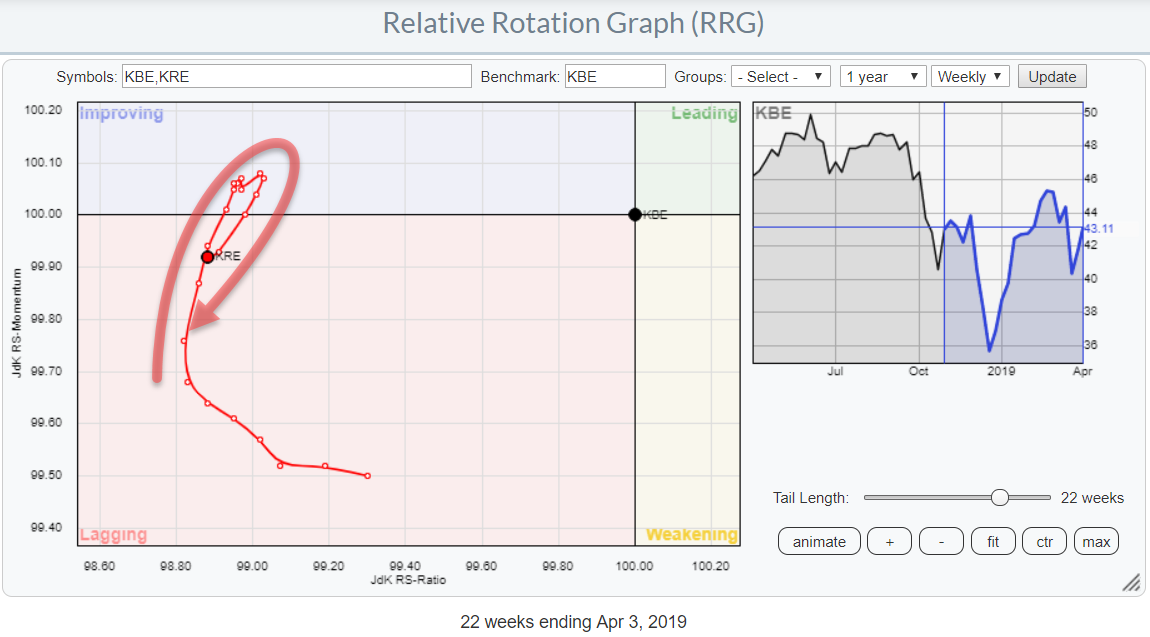
On the Relative Rotation Graph for US sectors, the Financials sector (XLF) is not in the best shape at the moment. It is positioned inside the lagging quadrant and heading lower on both axes. So, not much good there... Read More
Don't Ignore This Chart! April 03, 2019 at 08:40 AM
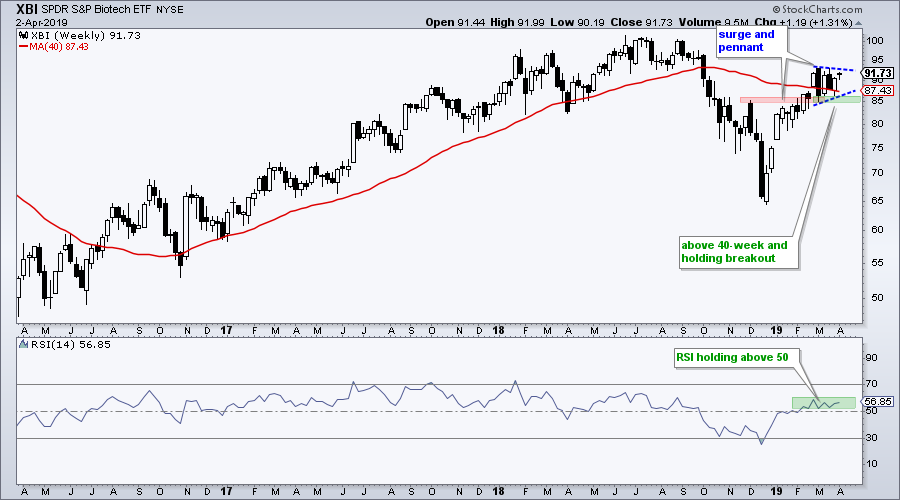
The Biotech SPDR (XBI) is trading at a make-or-break point as it consolidates near the 40-week SMA. Traders should watch for the resolution of this consolidation because it will dictate the next directional move... Read More
Don't Ignore This Chart! April 02, 2019 at 03:19 PM
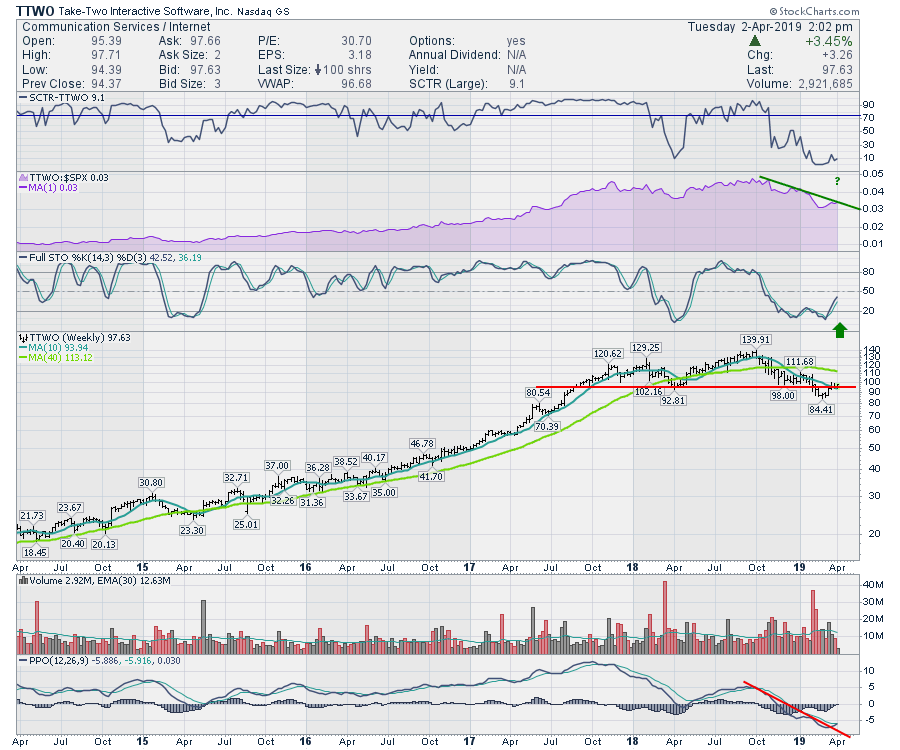
Take Two Interactive (TTWO) has made repetitive lower lows for a while and continues to be in a big downtrend. However, this stock has showed up on some of my scans this week and appears set to change direction... Read More
Don't Ignore This Chart! April 01, 2019 at 10:26 AM

AT&T (T) was one of the worst performing stocks in 2018 with a 20% decline and 52-week low in late December... Read More