 When acting in an environment of uncertainty (of which financial markets are a prime example) it is a good habit to double-check any findings. Think of it as an extra pair of eyes to confirm or deny what you (think you) are seeing.
In this process, please keep an open mind and try not to get (too) married to your own ideas/views. Markets have no mercy. Fellow colleague and commentator Dave Keller has a subtle but great reference in the sign-off below all his blogs - "RR#6." Since you may be wondering what that means, here's a link to the explanation.
In today's technology-driven world, we do not have to go around a (trading) room to talk to other traders/analysts/etc. to get an extra pair of eyeballs and discussion on what we are seeing or thinking. Social media, especially Twitter, is a great resource to see what the world thinks.
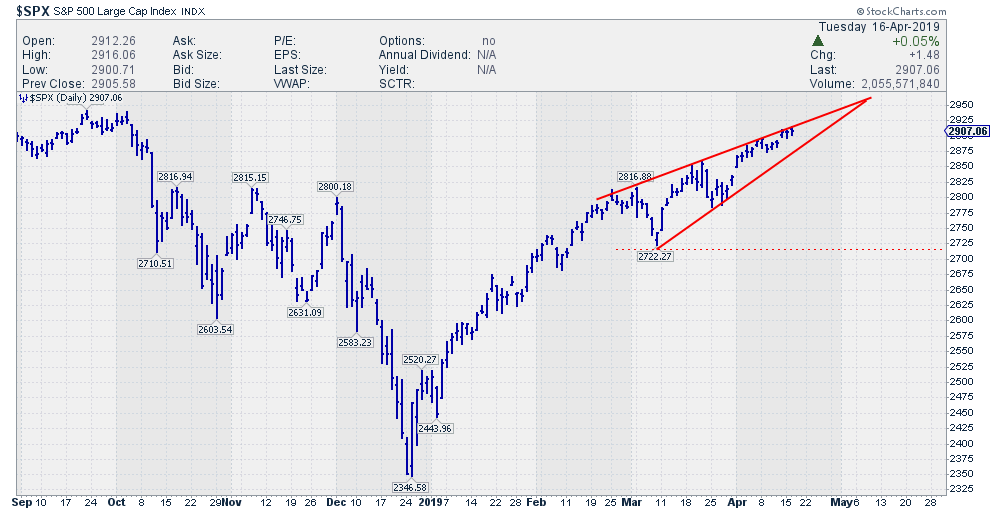
Over the past few days, it looked to me as though a rising wedge has been building up in the chart of $SPX. To double check if I was the only one seeing this, I searched Twitter for "$SPX wedge." I quickly found out I was not alone - over the past few days, a ton of people have been tweeting about this wedge in the S&P 500 index.
In the chart above, I have annotated the wedge on the daily chart and am seeing that is becoming better defined almost by the day. This is especially true of the upper boundary, which has a lot of touch points that make it a reliable resistance level. The lower boundary is connecting only two lows, but I'd like to accept it as support in combination with the upper boundary of the wedge formation.
Rising wedges at the end of a trend are topping formations and have a negative implication - but only when they are broken downward!
That has not happened yet.
How About The Hourly Chart?
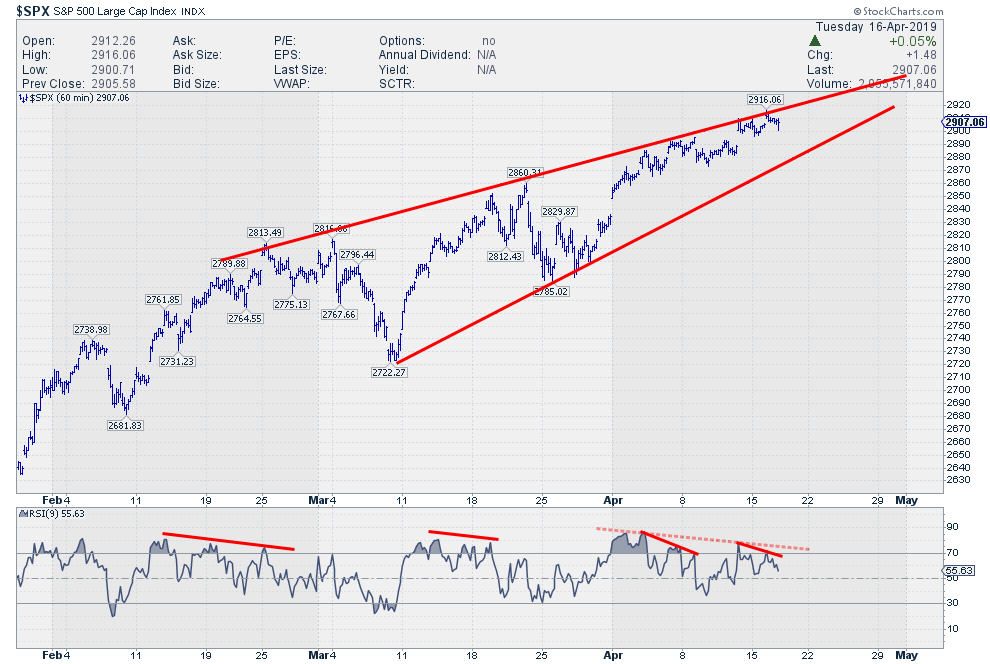 Switching to the hourly chart to see more detail reveals an extra touch point for the lower boundary, confirming the validity of the upper boundary.
Since the start of April, the market's struggle with this slightly up-sloping resistance is very clear. What is also evident is that we still need to decline around 30 points before the $SPX can come close to breaking out of this wedge and really trigger a signal.
Therefore, it is too early to pull the trigger on the completion of that wedge.
Divergences In The RSI
The 9-period RSI on that hourly chart shows a number of divergences that have already occurred during the build-up of the wedge and is showing divergences again at the moment. (There's nothing special about 9-period RSI, by the way; it's just my preferred lookback as it is a bit more sensitive than the default 14-period RSI.)
The combination of that negative divergence with the struggle against overhead resistance leads me to believe that the upside potential for this market is limited and the path of least resistance is down for the time being within the boundaries of the wedge.
A more serious signal will be given by the market when the wedge is broken downward. Such a break suggests a further decline towards the base of the formation, i.e. levels around 2720.
As the apex of the formation lies in the first week of May, it's still "wait and see," but we have a few pretty good pointers and levels to watch IMHO.
Note: An upward break voids the wedge as a topping formation and will likely lead to a continuation of the existing trend. It's not a "signal" per se.
My regular blog is the RRG Charts blog. If you would like to receive a notification when a new article is published there, simply "Subscribe" with your email address.
Julius de Kempenaer
Senior Technical Analyst, StockCharts.com
Creator, Relative Rotation Graphs
Founder, RRG Research
Want to stay up to date with the latest market insights from Julius?
– Follow @RRGResearch on Twitter
– Like RRG Research on Facebook
– Follow RRG Research on LinkedIn
– Subscribe to the RRG Charts blog on StockCharts
Feedback, comments or questions are welcome at Juliusdk@stockcharts.com. I cannot promise to respond to each and every message, but I will certainly read them and, where reasonably possible, use the feedback and comments or answer questions.
To discuss RRG with me on S.C.A.N., tag me using the handle Julius_RRG.
RRG, Relative Rotation Graphs, JdK RS-Ratio, and JdK RS-Momentum are registered trademarks of RRG Research.
