 Browsing some Relative Rotation Graphs, the relationship between Stocks and Bonds once again drew my attention.
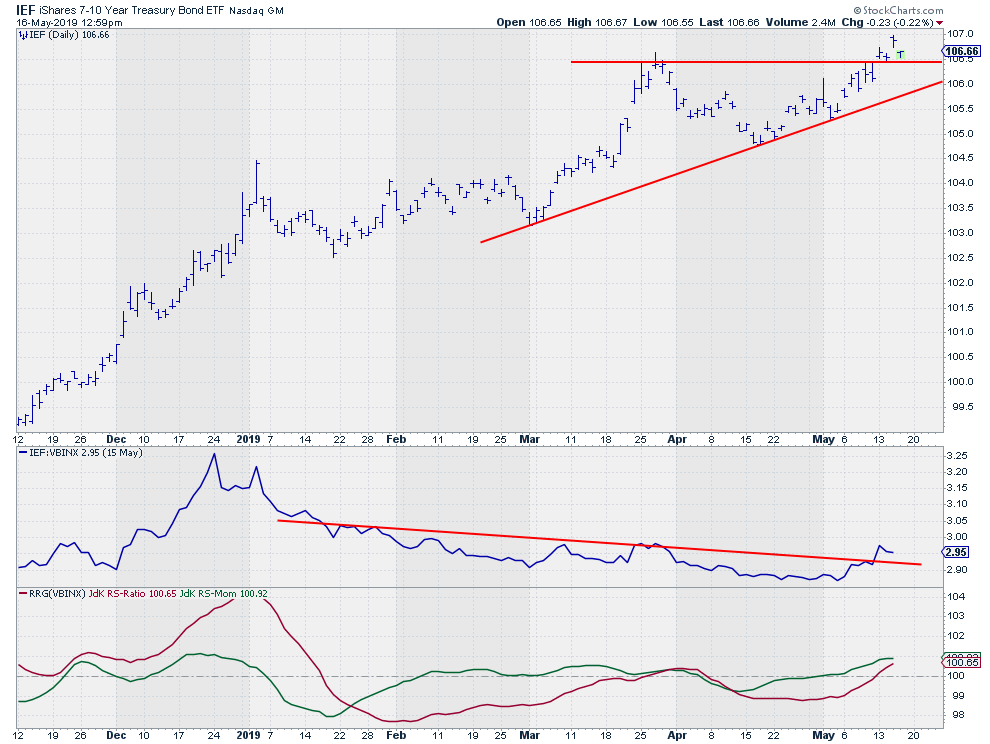
When I shifted to their respective charts, I decided that the current price action of IEF, as shown in the graph above, deserves our (or, at least, my) attention.
This ETF, which tracks the performance of 7-10 year Treasury bonds, broke above an important horizontal resistance level (106.50) three days ago. It then hovered above that breakout level the day after the break, before then jumping to a high of 106.97 yesterday.
Today, IEF dropped back to that breakout level and is testing it as support. So far, it is holding up fine.
Provided that this break holds, it will be positive for bonds (meaning lower yields) and the next target can be pegged around the level of the major high at 107.50, which was set back in 2016 and corresponds with yields around 1.4%.
In the chart above, the relative strength and the RRG-Lines are plotted against VBINX, a balanced benchmark that I mostly use for asset allocation purposes.
The break above the falling trend line in relative strength, with up-sloping RRG-Lines, suggests that the underperformance of IEF against VBINX is (slowly) turning around.
The current break in IEF, if it holds up, could provide the fuel needed for this shift to continue.
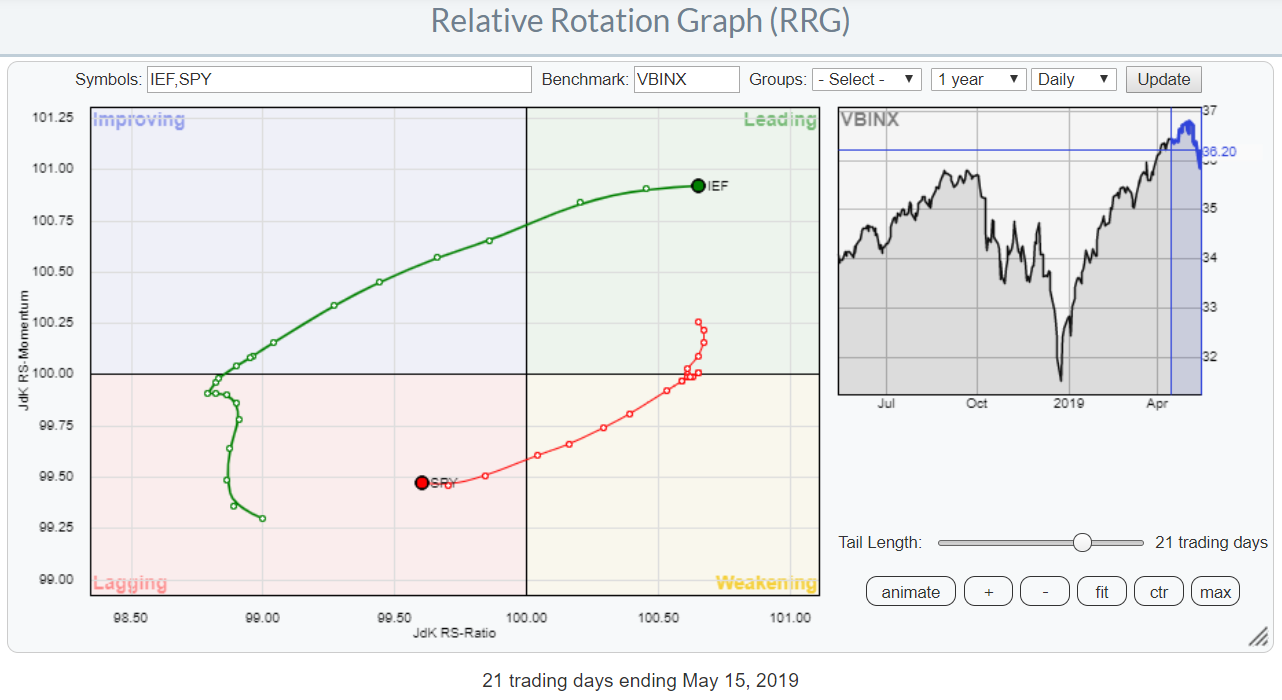
To put things into perspective, the RRG below shows the rotation (based on daily data) of IEF and SPY against VBINX. The graph clearly shows the improvement of IEF over SPY, at least for the time being.
Stay tuned!
My regular blog is the RRG Charts blog. If you would like to receive a notification when a new article is published there, simply "Subscribe" with your email address.
Julius de Kempenaer
Senior Technical Analyst, StockCharts.com
Creator, Relative Rotation Graphs
Founder, RRG Research
Want to stay up to date with the latest market insights from Julius?
– Follow @RRGResearch on Twitter
– Like RRG Research on Facebook
– Follow RRG Research on LinkedIn
– Subscribe to the RRG Charts blog on StockCharts
Feedback, comments or questions are welcome at Juliusdk@stockcharts.com. I cannot promise to respond to each and every message, but I will certainly read them and, where reasonably possible, use the feedback and comments or answer questions.
To discuss RRG with me on S.C.A.N., tag me using the handle Julius_RRG.
RRG, Relative Rotation Graphs, JdK RS-Ratio, and JdK RS-Momentum are registered trademarks of RRG Research.
